Linear Approximation Model Throughput Performance
Analysis of IEEE 802.11 Distributed Coordinated
Function in Wireless Lossy Channel
Salah Abdulghani Alabady
College of Engineering / Computer Engineering Department University of Mosul / Iraq
ABSTRACT
One source of performance degradation in wireless networks is the frame error that occurs because of non-ideal channel conditions. Most previous works assume an ideal transmission channel (i.e., no error in transmission), whereas other works assume that the error is constant and exists only in data packets. These previous works do not consider transmission errors in control frames (i.e., RTS, CTS, and ACK). Therefore, this paper proposes an analytical approximation model to computes the saturation throughput, conditional collision probability, and packet transmission probability, of IEEE 802.11 distributed coordination function (DCF) in the presence of a determinate number of nodes (n) and a wireless noise channel condition. The transmission error that occurs in the data packets and control frames are considered for the computation of the saturation throughput. Furthermore, the effect of network size (n), maximum backoff stage (m), packet length, and minimum backoff window size (W) on the saturation throughput is investigated. The results indicate that the performance of IEEE 802.11 DCF strongly depends on number of nodes, packet length, and BER.
General Terms
Wireless Networks, Networks Performance, Ad-Hoc Networks, Wireless Mesh Networks
Keywords
IEEE 802.11, DCF, BER, Throughput, Wireless Noisy Channel, Performance Analysis, Hidden Nodes
1. INTRODUCTION
Wireless networks have recently become popular in data communications and networking [1]. The IEEE 802.11 is one of the most popular wireless network standards. The fundamental mechanism of IEEE 802.11 medium access control (MAC) in accessing media is a distributed coordination function (DCF) [1] that contains two access mechanisms. The first access mechanism defines a basic access method (a two-way handshake mechanism, data– ACK). The second access mechanism is an optional four-way handshake technique (RTS–CTS–data–ACK) known as the request to send/clear to send (RTS/CTS) access method [2]. Many analytical models have been produced on the 802.11 MAC layer, and most previous works have analyzed and estimated the delay and throughput of IEEE 802.11 in single-hop wireless networks [2–8].
Other works have studied and analyzed the performance of IEEE 802.11 DCF in saturated conditions for the prevention of collisions and for single-hop and multi-hop wireless networks with hidden nodes [9–15]. However, these previous
studies created models by assuming lossless channels or ideal channel conditions (i.e., no errors in transmission frames). The error probability of the data frames is considered as a constant in [16–18], which ignore the transmission error of control frames (RTS, CTS, and ACK). The authors in [18] have proposed an analytical model that focuses on the effect of packet errors on the capacity and variety of MAC protocols.
A model that calculates the throughput, average packet delay, and packet drop probability has been proposed in [19], [20]. The authors considered the channel bit errors and packet retry limits of the basic access method and assumed that an error exists in the data frame. Li et al. [21] also introduced an analytical model to evaluate the performance of the IEEE 802.11 DCF–MAC protocol with time-varying channels. The authors considered different incoming traffic loads and the influence of transmission errors. However, the authors ignored the probability of a transmission error in the control frames.
The authors in [22] presented a method for estimating the saturation throughput for noisy channels. Their analysis was based on the concept of a virtual slot. The authors assumed that collisions only occur during the RTS frame transmission and ignored the hidden node effect, such as in the analysis in [2]. The authors also assumed the same packet transmission probability (τ) in [2]. In another work [23], the authors proposed analytical model for single-hop multi-interface IEEE 802.11 DCF mesh network. In that model the nodes utilize the uniform random interface selection (URIS) policy in order to select the transmitting channel. An analytical model to predict the probability of frame error for the MAC Service Data scheme is proposed in [24].
This paper provides an analytical linear approximation model for computing the saturation throughput for the IEEE 802.11 DCF (RTS/CTS) mechanism for a noisy channel in the presence of hidden nodes. This paper introduces the relationship between the throughput and other network factors, such as the number of nodes (n), minimum backoff window size (W), packet transmission size. By using these models, the effect of noisy channels in the saturation throughput is presented.
2. PROPOSED MATHEMATICAL
MODEL
In this section, the proposed mathematical approximation analytical model is presented. The main aim of the model is to calculate the saturation throughput for lossy wireless network channel. The assumptions that made in the proposed model as following:
1) Data packets have fixed lengths. 2) The RTS/CTS mechanism is used.
3) A finite number of nodes that operate in saturated conditions exists in the network.
4) Timeouts of the ACK and CTS frames are considered.
5) Consider the effect of hidden nodes.
6) Multi-hop communications and some nodes cannot hear other nodes.
7) Suppose a collision maybe happen during transmission the CTS and RTS control frames. 8) The error probabilities for RTS, CTS, ACK, and
data frames are considered.
The differences among the proposed analysis and other previous works [2, 3, 6, 9, 13] are the assumptions in numbers 4 to 8. The differences between the proposed analysis and [22, 23, 24] are the assumptions in numbers 6 to 8. The additions assumptions make the proposed analysis closer to reality. Therefore, the proposed work and previous works are incomparable because of the different assumptions in the proposed model.
2.1 Virtual Time Slots
There are seven types of virtual time slots in RTS/CTS are used to estimate the saturation throughput of the IEEE 802.11 for noisy channels:
1-Empty time slots ( ) defined as:
(1)
Time slot (σ) is the duration that needed to detect the status of the channel (i.e., idle or busy). Therefore, σ is dependent on the physical layer characteristics.
2-The collision time slots ( ) are defined as follows:
(2)
When a collision or error occurs in transmitting RTS and CTS control frames, the transmitting node waits for the end of the CTS timeout timer, whereas the other nodes wait for the time extended inter frame space (TEIFS) interval to resume backoff. The length of the TEIFS interval is the same as that of the CTS timeout timer and DIFS combined.
3-The RTS control frame error time slots are expressed as follows:
(3)
Where
(4)
4- The CTS control frame error time slots ( ) is given by the following:
(5)
A node that receives incorrect data frames waits for the
interval to resume backoff. Meanwhile, the transmitting node waits for the expiration of the ACK timeout timers.
(6)
5- is the error time slots in data frame.
+ + + + + (7)
6- The ACK error time slots is denoted by the following:
+ + + + + +
(8)
7- Finally, denotes the successful transmission of time slots:
(9)
Where is the “short inter-frame space time”, and
is the “time of the distributed inter-frame space”. are the durations of the RTS, CTS, and ACK packets, respectively, where is the channel propagation delay. are the time duration of the physical header, MAC header, and packet payload, respectively. The values of the system parameters used in the proposed analysis are summarized in Table (1).
2.2 Packet Transmission and Conditional
Collision Probabilities
The packet transmission probability ( ) in a randomly chosen slot time is given by [25].
(10)
(25)
) 1 )( 1 (
1 Pc Pe
P (11)
Pc is the conditional collision probability defined as the probability that at least one node of the remaining nodes to transmit within the same time slot. Pc can be expressed as [25];
(12)
Where, (n) is the number of nodes. The frame error
probability (Pe) is the error probability with the condition that there is a successful RTS/CTS transmission within the time slot can be expressed as:
(13)
Eqs. (10), (11), (12) and (13) represent the linear equation systems which are used for computing the packet transmission probability and conditional collision probability, respectively.
2.3 Probability of Successful Transmission
and Saturation Throughput
The saturation throughput defines as:
Let PTR is the probability of at least one transmission in the considered time slot, which is defined as the following:
(14)
is the probability of the idle channel.
= (15)
The probability of a successful transmission on the channel
is provided by the probability that at least one node transmits on the channel [2].
(16)
Let PS is the probability that at least one node transmission is successful in a given time slot on the channel and the probability that other n-1 nodes remain silent in a given time slot on the channel.
(17)
The collision probability is defined as follows:
(18)
By substituting Eqs. (15) and (17) into Eq.(18), becomes the following:
(19)
The error probability of transmitting an RTS frame is defined as the following:
(20)
The error probability of transmitting a CTS frame is defined as the following:
(21)
The error probability of transmitting a data packet is defined as the following:
(22)
The error probability of transmitting an ACK frame is defined as the following:
(23)
A successful transmission probability is expressed as follows:
(24)
The system saturation throughput ( ) can be expressed as Eq.
The total length of the slot time during RTS/CTS is defined as follows:
(26)
From Eq. (13), the probability of error transmission is defined as the following:
(27)
(28)
The natural logarithm of both sides of Eq. (28) is taking.
(29)
After simplifying Eq. (29)
After the exponential of both sides,
(30)
After simplifying,
From the properties of the exponential functions, the equation 31 become as the following equation:
After some calculations, simplify
(32)
3. NUMERICAL RESULTS AND
DISCUSSIONS
[image:4.595.319.539.75.468.2]This section presents the results of the proposed analytical model. The model is based on the formulation of linear mathematical equations. Fig.1a presents the saturation throughput versus network size (number of nodes, n) for different BER values with W = 32 and m = 3. Fig.1a also indicates the effects of the BER on the throughput and network performance. The Figure shows that the throughput strongly depends on the BER, and the throughput always degrades with increasing BER such as when the BER = 10−4.
Table 1. Physical and MAC Layers System Parameters
Parameter Values
Packet payload (bytes) 1023
MAC header (bits) 272
PHY header (bits) 128
ACK Size (bits) 112
CTS Size (bits) 112
RTS Size (bits) 160
DIFS (µsec) 128
SIFS (µsec) 28
Slot time (σ) (µsec) 50
CWmin (units of SLOT) 16
CWmax (units of SLOT) 1024
Channel propagation delay (δ) (µsec) 1
PLCP Preamble Size (bits) 96
PLCP Header Size (bits) 32
Channel bit rate (Mbps) 1
The best performance is obtained when the BER = 10−8. The throughput does not always remain constant as n increases (Fig. 1a).
The throughput versus n at low BER values (10−6 and 10−8) and at the lossless channel condition (BER = 0) are presented in Fig. 1b to show more detailed results on saturation throughput performance. The results indicate that the throughput values do not remain constant and decrease with increasing n.
The best throughput value is achieved with a low BER. Throughput decreases with increasing n because an increasing n increases the collision probability (Pc). Accordingly, the increase in P leads to a decrease in packet transmission probability ( ), thus causing a decreased in the probability of successful transmission (PST). Consequently, the saturation throughput (STH) decreases as indicated in Eq. 25.
Fig. 2 presents the saturation throughput versus W with m = 3, n = 50, with different BER values. The throughput increases with increasing W. The optimal throughput value is achieved at W = 256. Thereafter, the values of W will exceed 256, and the throughput values will start to decrease slightly. The reason for this phenomenon will be discussed later in Figs. 4a and 4b.
0 10 20 30 40 50 60
2 3 4 5 6 7 8 9x 10
5
Number od nodes
S
a
tu
ra
ti
o
n
Th
ro
u
g
h
p
u
t
(b
p
s
)
BER = 0 BER = 1e-4 BER = 1e-5 BER = 1e-6 BER = 1e-8
W = 32 , m =3
Fig 1(a, b): Saturation throughput versus number of nodes at different BER
0 10 20 30 40 50 60
8.5 8.55 8.6 8.65 8.7 8.75
8.8x 10
5
Number of nodes
S
a
tu
ra
ti
o
n
Th
ro
u
g
h
p
u
t
(b
p
s
)
BER = 0 BER = 1e-6 BER = 1e-8
W = 32, m = 3
(a)
[image:4.595.60.277.324.520.2]Fig. 3 shows the saturation throughput versus m at W = 32, n = 50, and different BER (10−5, 10−6 , and 10−8). The figure demonstrates that the optimal values of the saturation throughput are obtained with m = 6, W = 32, and n = 50 for the three values of BER. The optimal values of the saturation throughput depend on the network working conditions in terms of the number of nodes (n), W, and m.
Fig. 4a depicts the BER versus n under W = 32, 128, and 256, which explains the effects of W in case the BER at a large n (more than 200 nodes). Fig. 4b presents the effects of W in case the BER at a lower n (less than 200 nodes). BER increases with increasing network size. However, the best performance of the network occurs when W = 256. Therefore, Fig. 4a shows BER = 10−4 can be achieved when n = 50 at W = 32. The same BER = 10−4 can be achieved when n = 188 and 386 at W = 128 and 256, respectively. Therefore, W = 128 or 256 is better utilized with a large n in the network because the size of the backoff window is crucial and changes depending on network conditions (i.e., BER and n). For example, if the window size is considerably small, the backoff waiting time for the nodes after collision occurs will also be small. In this case, a higher probability exists that two nodes will attempt to transmit at the same time, thus leading to an increase in the possibility of collision. The increase in the possibility of collision leads to an increase in BER. However, a considerably large window size means that the nodes may
wait longer before transmitting, thus leading to an increase in delay and a decrease in throughput. Eq. (12) shows that PC depends on n and W.
Fig. 5 presents the BER versus the packet length with n = 10 and two different minimum window sizes (32 and 128). BER decreases with increasing PPL because an increase in PPL leads to an increase in the successful transmission time slots (TST). By contrast, an increase in PPL leads to an increase in STH. Fig. 5 also shows that the best performance can be
achieved with the fewest number of nodes in the network (n = 10) when W = 32 compared with when W = 128. Consequently, the selection of W depends on network size. Pc Fig. 6 shows the BER versus the number of nodes when W = 32 and PPL = 1500 bytes. The figure demonstrates that the increases number of nodes due to increases the BER.
0 200 400 600 800 1000 1200
10-6 10-5 10-4 10-3
Number of nodes
BER W= 32 W= 128 W= 256 (a) Fig 1(a , b): Sat ur ati on thr ou gh put ver sus nu mb er of no des at dif fer ent BE R
20 40 60 80 100 120 140 160
10-5 10-4
Number of nodes
BER
W= 32 W= 128
W= 256
Fig 4(a, b): BER vs. number of nodes at different minimum widow size
(b)
1 2 3 4 5 6 7 8
7 7.2 7.4 7.6 7.8 8 8.2 8.4 8.6 8.8x 10
5
Maximum backoff stage (m)
S a tu ra ti o n Th ro u g h p u t (b p s )
BER = 1e-5 BER = 1e-6 BER = 1e-8 W = 32 , n =50
Fig 3: Saturation throughput versus maximum backoff stage at different BER
Fig 2: Saturation throughput versus minimum backoff window at different BER
0 200 400 600 800 1000 1200
7.4 7.6 7.8 8 8.2 8.4 8.6 8.8x 10
5
Minimum backoff window (W)
S a tu ra ti o n Th ro u g h p u t (b p s
) BER = 1e-5
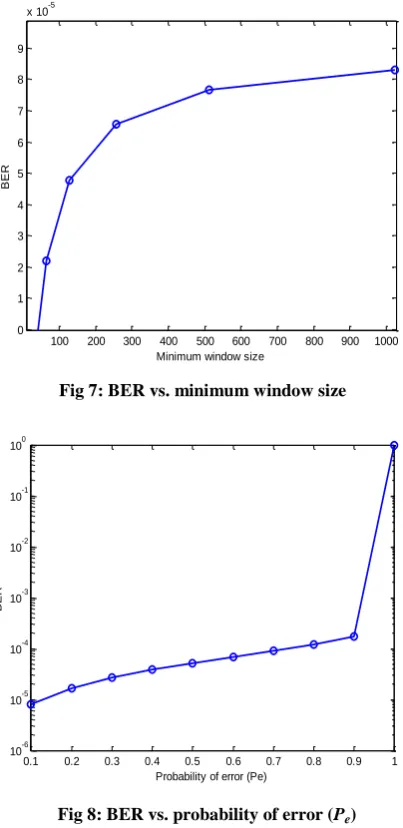
Fig. 7 shows the BER versus the minimum window size under n = 10, PPL= 1500 bytes, and m = 3. The figure shows that the increases the minimum window size due to increase the BER is low because the n in the network is few.
Fig. 8 presents the BER versus the error probability in the data and control frame transmission (Pe). BER increases with increasing (Pe). The minimum BER is 7.8486×10⁻⁶ when Pe = 0.1, and the BER is equal to 1.7151×10⁻⁴ when Pe = 0.9 with PPL = 1500 bytes, W = 32, and m = 3. Fig. 8 evidently shows that the effect of Pe on BER and network performance.
Fig. 9 shows Pc versus n when W = 32, 64, and 128. Pc rapidly increases at W = 32 as the network size grows. The best performance occurs when W = 128 because the chances for two nodes to attempt to transmit at the same time are numerous when W is small. This phenomenon leads to an increase in the possibility for collision.
100 200 300 400 500 600 700 800 900 1000 0
1 2 3 4 5 6 7 8 9
x 10-5
Minimum window size
[image:6.595.61.264.68.505.2]BER
Fig 7: BER vs. minimum window size
0 10 20 30 40 50 60
0 0.1 0.2 0.3 0.4 0.5 0.6 0.7 0.8
Number of nodes
C
o
ll
is
io
n
p
ro
b
a
b
il
it
y
W = 32 W = 64 W = 128
BER = 0 , m = 3
Fig 9: Collision probability vs. number of nodes at different minimum window size
0.1 0.2 0.3 0.4 0.5 0.6 0.7 0.8 0.9 1
10-6 10-5 10-4 10-3 10-2 10-1 100
BER
Probability of error (Pe)
Fig 8: BER vs. probability of error (Pe)
0 20 40 60 80 100 120 140 160
10-6 10-5 10-4 10-3
Number of nodes
BER
W = 32, Packet length = 1500 Byte
Fig 6: BER vs. number of nodes
0.2 0.4 0.6 0.8 1 1.2 1.4 1.6 1.8 2
x 104 0
1 2
x 10-4
Packet length (bits)
BER
W = 32 W = 128
[image:6.595.321.523.76.491.2]4. CONCLUSION
This article presents an accurate analytical approximation model of throughput performance analysis for IEEE 802.11 DCF that uses the RTS/CTS mechanism in wireless networks for noisy channels. In the model, the probability of errors in the data frame and control frames (RTS, CTS, and ACK) is considered. The results analysis of this paper demonstrates the relationship between the saturation throughput and network size (number of nodes, n), maximum backoff stage (m), packet transmission size and W with different BER values. The proposed analytical model examines with different number of nodes and different values of m, W and BER. The results confirm that the performance of IEEE 802.11 DCF strongly depends on BER, network size, packet length, and W.
5. REFERENCES
[1] Wireless LAN medium access control (MAC) and physical layer (PHY) specification: High- speed physical layer extension in the 2.4 GHz band, IEEE Standard 802.11, 2012.
[2] G. Bianchi, “Performance Analysis of the IEEE 802.11 Distributed Coordination Function,” IEEE Journal on Selected Areas in Communications, vol. 18, no. 3, pp. 535–547, 2000.
[3] N. Gupta, and C. S. Rai, “Non-saturation throughput analysis of IEEE 802.11 DCF considering short retry limit for single hop ad hoc networks,” In Proceedings of the Second International Conference on Future Generation Communication Technology (FGCT), pp. 10-15, 2013.
[4] M. M. Carvalho. Analytical Modeling of Medium Access Control Protocols in Wireless Networks. Ph.D dissertation, Computer Engineering, University of California Santa Cruz, 2006.
[5] J. Sartthong and S. Sittichivapak, “Near Theoretical Maximum Throughput Limits of CSMA/CA RTS CTS Protocol in IEEE 802.11 Wireless Networks Using Active Node Back-off Algorithm,” In proceeding of International Conference on Circuits, System and Simulation, IPCSIT, IACSIT Press, Singapore, 2011.
[6] P. Chatzimisios, V. Vitsas and A. C. Boucouvalas, “Throughput and Delay analysis of IEEE 802.11 protocol,” In Proceeding of IEEE International Workshop on Networked Appliances (IWNA), pp. 168-174, 2002.
[7] P. Chatzimisios, A. C. Boucouvalas and V. Vitsas, “IEEE 802.11 Packet Delay – A Finite Retry Limit Analysis,” In proceeding of IEEE GLOBECOM, vol. 2, pp. 950-954, 2003.
[8] P. Chatzimisios, A. C. Boucouvalas and V. Vitsas, “Packet delay analysis of the IEEE 802.11 MAC protocol,” Electronics Letters, vol. 39, no. 18, pp. 1358-1359, 2003.
[9] Y. Wang and J. J. Garcia-Luna-Aceves, “Modeling of Collision Avoidance Protocols in Single-Channel Multihop Wireless Networks,” Wireless Networks Journal, vol. 10, pp. 495-506, 2004.
[10]Y. Wang and J. J. Garcia-Luna-Aceves, “Collision Avoidance in Multi-hop Ad Hoc Networks,” In proceedings of 10th IEEE International Symposium on
Modeling, Analysis and Simulation of Computer and Telecommunications Systems, pp. 145–154, 2002.
[11] Ting-Chao Hou, Ling-Fan Tsao and Hsin-Chiao Liu, “Analyzing the Throughput of IEEE 802.11 DCF Scheme with Hidden Nodes,” In Proceedings of the IEEE 58th Vehicular Technology Conference (VTC 03), vol. 5, pp. 2870 – 2874, 2003.
[12] A. A. Abdullah, F. Gebali and L. Cai, “Modeling the Throughput and Delay in Wireless Multihop Ad Hoc Networks,” In Proceedings of the Global Telecommunications Conference, GLOBECOM, pp. 1-6, 2009.
[13] Ting-Chao Hou, Ling-Fan Tsao and Hsin-Chiao Liu, “Throughput analysis of the IEEE 802.11 DCF scheme in multi-hop ad hoc networks,” In Proceedings of the International Conference on Wireless Networks (ICWN’03), pp 1-6, 2003.
[14] Ping Ding, JoAnne Holliday, and Aslihan Celik, “Modeling the performance of a wireless node in multihop ad-hoc networks,” In Proceedings of the International Conference on on Wireless Networks, Communications and Mobile Computing, vol. 2, pp.1424–1429, 2005.
[15] P. Siripongwutikorn, “Throughput analysis of an IEEE 802.1lb multihop ad hoc network,” In proceeding of the IEEE Region 10 Conference, TENCON, pp. 1-4, 2006.
[16] Z. Hadzi-Velkov and B. Spasenovski, “Saturation throughput - delay analysis of IEEE 802.11 DCF in fading channel,” In proceeding of the IEEE International Conference on Communications, ICC '03, vol. 1, pp. 121-126, 2003.
[17] Jianhua He, Zuoyin Tang, Zongkai Yang, Wenqing Cheng, and Chun Tung Chou, “Performance evaluation of the distributed access scheme in error-prone channel,” In Proceedings of the IEEE Region 10 Conference on Computers, Communications, Control and Power Engineering, TENCON '02, vol. 2, pp. 1142-1145, 2002.
[18] Y. Jihwang and A. Agrawala, “Packet error model for the IEEE 802.11 MAC protocol,” In proceedings of 14th IEEE on Personal, Indoor and Mobile Radio Communications, PIMRC, vol. 2, pp. 1722-1726, 2003.
[19] P. Chatzimisios, A. C. Boucouvalas and V. Vitsas, “Influence of channel BER on IEEE 802.11 DCF,” Electronics Letters, vol. 39, pp. 1687-1689, 2003.
[20] P. Chatzimisios, A. C. Boucouvalas and V. Vitsasl, “Performance analysis of IEEE 802.11 DCF in presence of transmission errors,” In proceedings of the IEEE International Conference on Communications, vol. 7, pp. 3854-3858, 2004.
[21] L. Xiaolong and Z. Qing-An, “Influence of Bit Error Rate on the Performance of IEEE 802.11 MAC Protocol,” In proceedings of the IEEE Conference on Wireless Communications and Networking, WCNC, pp. 367-372, 2007.
[23]L. Bencini and R. Fantacci, “Performance evaluation of an IEEE 802.11g mesh network with multiradio nodes,” International Journal of Communication Systems, vol. 26, pp. 56-67, 2013.
[24]T. Y. Arif and R. F. Sari, “Frame Error Estimation for DCF Scheme with HT-PHY Performance Evaluation,” In proceedings of International Conference on Internet
Services Technology and Information Engineering (ISTIE), pp. 1-6, 2013.