OPTIMIZATION OF FRICTION PERFORMANCE OF A HEAT TREATED MODIFIED ZA
USING DESIGN OF EXPERIMENTS
1,*
Veerabhadrappa Algur,
1
Department of Industrial and Production Engineering, Rao
College, Bellary, Visvesvaraya Technological University,
2,4
Department of Mechanical Engineering, Nitte Meenakshi Institute of Technology, Yelahanka,
Bengaluru, Visvesvaraya
3
Thakur Polytechnic, Kandivali, Mumbai, Maharashtra State, India
ARTICLE INFO ABSTRACT
This paper describes some aspects of concerning the effect of heat for Modified ZA
through Taguchi’s technique. A L25 orthogonal array was selected for analysis of the data. Orthogonal arrays of Taguchi, the
regression analysis are employed to find the optimal process parameter levels and to analyze the effect of these parameters on coefficient of friction. The result shows that Normal Pressure i more sensitive parameter
Copyright © 2015 Veerabhadrappa Algur et al. This
unrestricted use, distribution, and reproduction in any medium, provided the original work is properly cited.
INTRODUCTION
Amongst the zinc-based alloys, the ZA family has been extremely popular during recent years. Zinc
high amount of aluminium comprise a new family of die-casting alloys that have proven themselves in a wide variety of demanding applications (Jovanovic
Jovanovic et al., 2007). ZA-27 alloy belongs to a group of zinc
alloys with increased content of aluminium (ZA alloys) which has been used in technological applications for several decades
(Bobic et al., 2011). ZA-27 alloy with a nominal aluminium
content of 27wt% is distinguished with highest strength and lowest density of all ZA alloys. These alloys feature clean, low temperature and energy-saving melting, supreme castability, high as-cast strength and hardness, corrosion resistance and equivalent or even superior bearing and wear properties as compared to standard bronze bearing (Sharma
Sharma et al., 1995; Ahmet Turk et al., 2006
Prasanna Kumar and Kanakuppi Sadashivappa
Satry et al., 2001; Yuanyuan et al., 1996 and
Sharma, 2011). Babic Miroslav et al. (2009)
of heat treatment on friction coefficient of ZA
*Corresponding author: Veerabhadrappa Algur,
Department of Industrial and Production Engineering, Rao Bahadur Y, Mahabaleshwarappa Engineering College, Bellary,
Technological University, India.
ISSN: 0975-833X
Article History:
Received 19th October, 2014 Received in revised form 21st November, 2014 Accepted 08th December, 2014 Published online 23rd January,2015
Key words:
ANOVA,
Coefficient of Friction, Orthogonal Arrays, Signal-to-Noise Ratio.
RESEARCH ARTICLE
OPTIMIZATION OF FRICTION PERFORMANCE OF A HEAT TREATED MODIFIED ZA
USING DESIGN OF EXPERIMENTS
Veerabhadrappa Algur,
2Kabadi, V.R.,
3Ganechari, S. M. and
Department of Industrial and Production Engineering, Rao Bahadur Y, Mahabaleshwarappa Engineering
Visvesvaraya Technological University, Belgaum,
Department of Mechanical Engineering, Nitte Meenakshi Institute of Technology, Yelahanka,
Visvesvaraya Technological University, Belgaum, India
Thakur Polytechnic, Kandivali, Mumbai, Maharashtra State, India
ABSTRACT
This paper describes some aspects of concerning the effect of heat
for Modified ZA-27 alloy. Experiments were conducted based on the plan of experiments generated through Taguchi’s technique. A L25 orthogonal array was selected for analysis of the data. Orthogonal arrays of Taguchi, the signal-to-noise (S/N) ratio, the analysis of variance(ANOVA) and regression analysis are employed to find the optimal process parameter levels and to analyze the effect of these parameters on coefficient of friction. The result shows that Normal Pressure i more sensitive parameter.
This is an open access article distributed under the Creative Commons Att use, distribution, and reproduction in any medium, provided the original work is properly cited.
based alloys, the ZA family has been extremely popular during recent years. Zinc-based alloys with high amount of aluminium comprise a new family of
casting alloys that have proven themselves in a wide
Jovanovic et al., 2005;
27 alloy belongs to a group of zinc alloys with increased content of aluminium (ZA alloys) which has been used in technological applications for several decades 27 alloy with a nominal aluminium content of 27wt% is distinguished with highest strength and lowest density of all ZA alloys. These alloys feature clean, low saving melting, supreme castability, ss, corrosion resistance and equivalent or even superior bearing and wear properties as
Sharma et al., 1998;
2006; Mukundadas Kanakuppi Sadashivappa, 2006; Shanta and Seenappa and ) studied the effect of heat treatment on friction coefficient of ZA-27 alloy.
,
Department of Industrial and Production Engineering, Rao Bahadur Y, Mahabaleshwarappa Engineering College, Bellary, Visvesvaraya
It reveals that Friction coefficient increase with applied load and decrease with the sliding speed.
the regime of lubrication. Miroslav Babic
on the influence of solutionizing temperature of 370 short period of time on coefficient of friction of ZA The result obtained is improved
heat-treated alloy samples attained improved tribological behavior (reduced coefficient of friction an over as
for all applied loads. Babic et al
better coefficient of friction for as
casted in sand compared to mold cast alloy. However, when mold cast alloy is heat treated showed positive effect on friction coefficient when compared to sand cast alloy
The degree of improvement depends on the corresponding
annealing duration time. Shuqing yan
show that coefficient of friction of ZA
with increasing in load. The mating surface between metals during friction is usually in an elastoplastic state and the true contact area is nonlinear to the applied load. This results in a fluctuation in the coefficient of friction with increasing applied
loads. Seenappa et al. (2011
friction increases with increase in the sliding speed in turn increase in the applied load for all tested alloy.
effect of heat treatment on the coefficient of friction of Modified zinc-aluminium alloys has been studied in the past and there is still a lack of information.
International Journal of Current Research
Vol. 7, Issue, 01, pp.11526-11533, January, 2015
INTERNATIONAL
OPTIMIZATION OF FRICTION PERFORMANCE OF A HEAT TREATED MODIFIED ZA-27 ALLOY
. and
4Shetty, P.B.
Mahabaleshwarappa Engineering
Belgaum, India
Department of Mechanical Engineering, Nitte Meenakshi Institute of Technology, Yelahanka,
India
Thakur Polytechnic, Kandivali, Mumbai, Maharashtra State, India
This paper describes some aspects of concerning the effect of heat treatment on friction coefficient 27 alloy. Experiments were conducted based on the plan of experiments generated through Taguchi’s technique. A L25 orthogonal array was selected for analysis of the data. noise (S/N) ratio, the analysis of variance(ANOVA) and regression analysis are employed to find the optimal process parameter levels and to analyze the effect of these parameters on coefficient of friction. The result shows that Normal Pressure is the
is an open access article distributed under the Creative Commons Attribution License, which permits
It reveals that Friction coefficient increase with applied load g speed. This is in accordance with
Miroslav Babic et al. (2010) focused
on the influence of solutionizing temperature of 3700C for a
short period of time on coefficient of friction of ZA-27 alloy. The result obtained is improved in coefficient of friction. The treated alloy samples attained improved tribological behavior (reduced coefficient of friction an over as-cast ones,
et al. (2007) obtained results that better coefficient of friction for as-cast alloy when the alloy casted in sand compared to mold cast alloy. However, when mold cast alloy is heat treated showed positive effect on friction coefficient when compared to sand cast alloy.
The degree of improvement depends on the corresponding
Shuqing yan et al. (2010) results
show that coefficient of friction of ZA-27 alloy is non linear with increasing in load. The mating surface between metals is usually in an elastoplastic state and the true contact area is nonlinear to the applied load. This results in a fluctuation in the coefficient of friction with increasing applied 2011) studied that coefficient of ases with increase in the sliding speed in turn increase in the applied load for all tested alloy. Although the effect of heat treatment on the coefficient of friction of aluminium alloys has been studied in the past
k of information.
Therefore, purpose of this work is to analyze the effects of
annealing treatment at temperature of 3700C for 5 hours,
followed by water quenching and also furnace cooling on friction coefficient of Modified ZA-27 alloy in dry sliding condition using taguchi method. Tribological tests were conducted by varying in normal pressure and in sliding speed.
Experimental Procedures
Alloy preparation
The chemical composition of the alloy studies was based on
the ZA-27 containingAl – 27 wt%, Cu – 2 wt%, Mg – 0.04
wt%, and balance Zn with an addition of 1%Mn alloy content and Si – 3.5% was prepared. The chemical compositions of these alloys were weighted according to ratios and melted in a graphite crucible. Alloying temperature was controlled below
7000 C to avoid the lost of Zn. The melt was then degassed and
stirred well before being poured into the sand molds, which
were preheated to approximately 1500 C in open air. The
[image:2.595.311.551.83.287.2]process parameters and their levels and codes are shown in the Table 1 each process parameters having five levels.
Table 1. Control and Noise Factors
Wear test
Dry sliding wear tests were conducted on flat-ended 10mm diameter, 33mm long cylindrical (pin) samples using a pin-on-disc machine (Model: TR-20, DUCOM) as per ASTM: G99 – 05 as shown in Fig 1. The track diameter of 80mm enabled the rotational speeds of 136, 272, 409, 545 and 682 rpm to attain linear sliding speeds of 0.5, 1.0, 1.5, 2.0 and 2.5 m/s respectively. The friction force is measured by a frictional force sensor that uses a beam type load cell.
The coefficient of friction is evaluated by the following equation
CoF = ( )
( ) ……… (1)
Fig. 1. Wear and Friction Monitor Testing Machine
Experimental Design
The design of experiments (DOE) approach using Taguchi method is a powerful tool for design of high quality systems. In Taguchi method, the term ‘signal’ represents the desirable value (mean) for the output characteristics and the term ‘noise’ represents the undesirable value for the output characteristics. It allows carrying out modeling and analysis of the influence of process variables on the response variables. This optimization technique is carried out in a three stage approach such as system design, parameter design and tolerance design.
Based on taguchi method an orthogonal array (OA) is considered to determine the optimal friction coefficient for Modified ZA-27 alloy. For this experiment, L25 orthogonal
array is chosen. The 1st column is assigned to Normal Pressure
(A) and 2nd column is assigned to sliding speed (B). Table 2
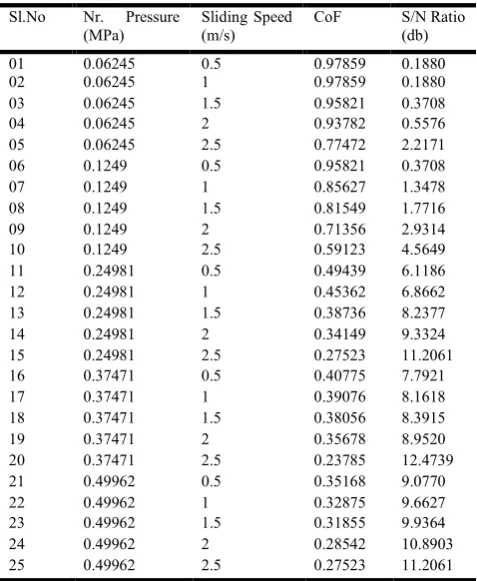
shows the L25 orthogonal array with design factors assigned. The experiments were conducted based on the run order generated by Taguchi technique and the results were obtained. This analysis includes the rank based on the delta statistics, which compares the relative value of the effects. The experimental results were transformed into S/N ratios. The S/N ratio for the CoF using ‘smaller the better’ characteristics, which can be computed as logarithmic transformation of the loss function is given as
S/N = -10 log10 (MSD) ……… (2)
Where MSD = Mean square Deviation
For the lower the better characteristic,
MSD = (Y12 + Y22 + Y32 +………….) x 1/n
Where Y12, Y22, Y32 are the response and ‘n’ is the number of
tests in a trial.
Sl.No Nr. Pressure (MPa)
Sliding Speed (m/s)
CoF S/N Ratio (db)
01 0.06245 0.5 0.97859 0.1880 02 0.06245 1 0.97859 0.1880 03 0.06245 1.5 0.95821 0.3708 04 0.06245 2 0.93782 0.5576 05 0.06245 2.5 0.77472 2.2171 06 0.1249 0.5 0.95821 0.3708
07 0.1249 1 0.85627 1.3478
08 0.1249 1.5 0.81549 1.7716
09 0.1249 2 0.71356 2.9314
[image:2.595.31.270.339.630.2]Table 2. Results of L25 Orthogonal array for Modified ZA-27 Alloy (As-received)
S.No. Process Parameters Codes Level 1 Level 2 Level 3 Level 4 Level 5 1 Normal Pressure (MPa) A 0.06245 0.1249 0.24981 0.37471 0.49962
[image:3.595.198.394.134.215.2]2 Sliding Speed (m/s.) B 0.5 1.0 1.5 2.0 2.5
Table 2.1. Response Table for S/N Ratios for Modified ZA-27 Alloy (As-received)
Level A B
1 0.7043 4.7093
2 2.1973 5.2453
3 8.3522 5.7416
4 9.1543 6.5327
5 10.1545 8.3336 Delta 9.4502 3.6243
[image:3.595.153.442.240.749.2]Rank 1 2
Table 2.2. Response Table for Means for Modified ZA-27 Alloy (As-received)
Level A B
1 0.9256 0.6381
2 0.7870 0.6016
3 0.3904 0.5720
4 0.3547 0.5270
5 0.3119 0.4309
Delta 0.6137 0.2073
Rank 1 2
(a)
(b)
Fig. 2. Main effects plots for coefficient of friction of Modified ZA-27 Alloy (As- received) S/N Ratios (b) Mean
5 4 3 2 1 10
8
6
4
2
0
5 4 3 2 1
Nr. Pressure
M
e
a
n
o
f
S
N
r
a
ti
o
s
Sliding speed
Main Effects Plot for SN ratios Data Means
Signal-to-noise: Smaller is better
5 4 3 2 1 1.0
0.9
0.8
0.7
0.6
0.5
0.4
0.3
5 4 3 2 1
Nr. Pressure
M
e
a
n
o
f
M
e
a
n
s
Sliding speed
RESULTS AND DISCUSSION
Analysis of Control factors
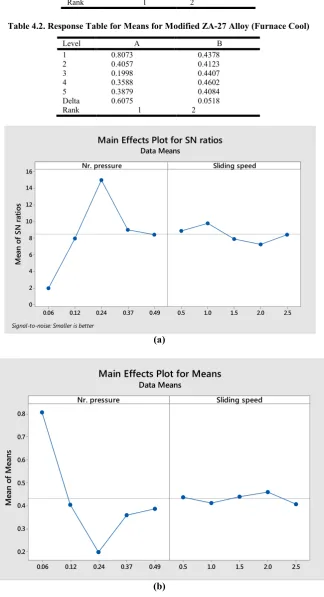
The influence of control factors like Nr. Pressure and sliding speed on coefficient of friction was been criticized using S/N ratio response analysis. The ranking of control factors using S/N ratio obtained for different parameters levels for coefficient of friction is given in Table 2, Table 3 and Table 4 respectively for As-received, Quenching and furnace cool for Modified ZA-27 alloy. Figure 2 (a and b) shows main effects plots of S/N and mean for As-received Modified ZA-27 alloy.
[image:4.595.143.451.246.494.2]Figure 2 (a and b) shows main effects plots of S/N and mean for Quenched Modified ZA-27 alloy. Figure 2 (a and b) shows main effects plots of S/N and mean for Furnace cool Modified ZA-27 alloy. It suggests that the optimum condition for minimum coefficient of friction is the combination of A5B5, A3B4 and A3B2. From the Fig 2, 3 and 4 it is evident that Normal pressure is the most dominating factor controlling the friction coefficient behavior of Modified ZA-27 alloy the optimum condition for wear rate as shown in Table 8.
Table 3. Results of L25 Orthogonal array for Modified ZA-27 Alloy (Quenched)
S.No Nr. Pressure (MPa) Sliding Speed (m/s) CoF S/N Ratio (db)
01 0.06245 0.5 1.44750 -3.21237
02 0.06245 1.0 1.38634 -2.83740
03 0.06245 1.5 1.12130 -0.99444
04 0.06245 2.0 1.01937 -0.16664
05 0.06245 2.5 0.89704 0.94376
06 0.12490 0.5 0.79511 1.99146
07 0.12490 1.0 0.78491 2.10360
08 0.12490 1.5 0.76453 2.33211
09 0.12490 2.0 0.64220 3.84659
10 0.12490 2.5 0.95821 0.37079
11 0.24981 0.5 0.69317 3.18320
12 0.24981 1.0 0.56065 5.02616
13 0.24981 1.5 0.53007 5.51334
14 0.24981 2.0 0.36697 8.70739
15 0.24981 2.5 0.48930 6.20850
16 0.37471 0.5 0.58784 4.61482
17 0.37471 1.0 0.55046 5.18548
18 0.37471 1.5 0.70336 3.05645
19 0.37471 2.0 0.54366 5.29345
20 0.37471 2.5 0.43833 7.16398
21 0.49962 0.5 0.54536 5.26633
22 0.49962 1.0 0.60143 4.41630
23 0.49962 1.5 0.54536 5.26633
24 0.49962 2.0 0.41284 7.68436
[image:4.595.194.397.531.612.2]25 0.49962 2.5 0.62691 4.05590
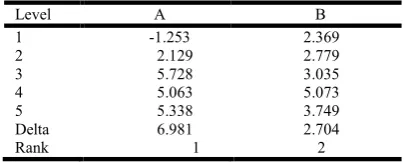
Table 3.1. Response Table for S/N Ratios for Modified ZA-27 Alloy (Quenched)
Level A B
1 -1.253 2.369
2 2.129 2.779
3 5.728 3.035
4 5.063 5.073
5 5.338 3.749
Delta 6.981 2.704
[image:4.595.199.392.649.730.2]Rank 1 2
Table 3.2. Response Table for Means for Modified ZA-27 Alloy (Quenched)
Level A B
1 1.1743 0.8138
2 0.7890 0.7768
3 0.5280 0.7329
4 0.5647 0.5970
5 0.5464 0.6820
Delta 0.6463 0.2168
(a)
[image:5.595.160.439.53.460.2](b)
Fig. 3. Main effects plots for coefficient of friction of Modified ZA-27 Alloy (Quenched) (a) S/N Ratios (b) Mean
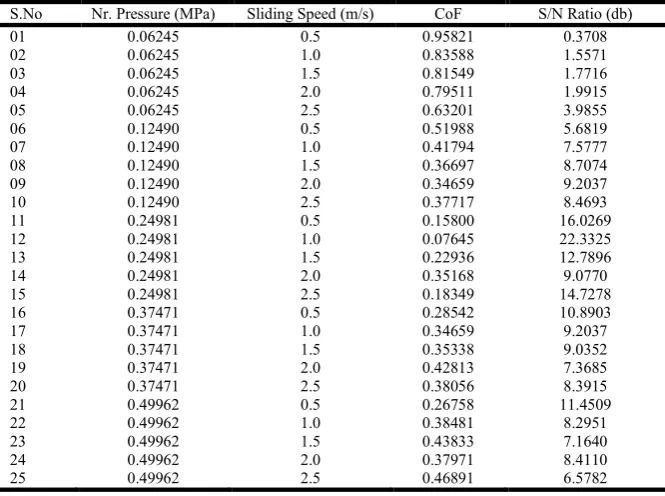
Table 4. Results of L25 Orthogonal array for Modified ZA-27 Alloy (Furnace Cool)
S.No Nr. Pressure (MPa) Sliding Speed (m/s) CoF S/N Ratio (db)
01 0.06245 0.5 0.95821 0.3708
02 0.06245 1.0 0.83588 1.5571
03 0.06245 1.5 0.81549 1.7716
04 0.06245 2.0 0.79511 1.9915
05 0.06245 2.5 0.63201 3.9855
06 0.12490 0.5 0.51988 5.6819
07 0.12490 1.0 0.41794 7.5777
08 0.12490 1.5 0.36697 8.7074
09 0.12490 2.0 0.34659 9.2037
10 0.12490 2.5 0.37717 8.4693
11 0.24981 0.5 0.15800 16.0269
12 0.24981 1.0 0.07645 22.3325
13 0.24981 1.5 0.22936 12.7896
14 0.24981 2.0 0.35168 9.0770
15 0.24981 2.5 0.18349 14.7278
16 0.37471 0.5 0.28542 10.8903
17 0.37471 1.0 0.34659 9.2037
18 0.37471 1.5 0.35338 9.0352
19 0.37471 2.0 0.42813 7.3685
20 0.37471 2.5 0.38056 8.3915
21 0.49962 0.5 0.26758 11.4509
22 0.49962 1.0 0.38481 8.2951
23 0.49962 1.5 0.43833 7.1640
24 0.49962 2.0 0.37971 8.4110
25 0.49962 2.5 0.46891 6.5782
0.49962 0.37471 0.24981 0.12490 0.06245 6
5
4
3
2
1
0
-1
-2
2.5 2.0 1.5 1.0 0.5
Nr. pressure
M
e
a
n
o
f
S
N
r
a
ti
o
s
Sliding speed
Main Effects Plot for SN ratios
Data Means
Signal-to-noise: Smaller is better
0.49962 0.37471 0.24981 0.12490 0.06245 1.2
1.1
1.0
0.9
0.8
0.7
0.6
0.5
2.5 2.0 1.5 1.0 0.5
Nr. pressure
M
e
a
n
o
f
M
e
a
n
s
Sliding speed
[image:5.595.132.465.527.775.2]Table 4.1. Response Table for S/N Ratios for Modified ZA-27 Alloy (Furnace Cool)
Level A B
1 1.935 8.884
2 7.928 9.793
3 14.991 7.894
4 8.978 7.210
5 8.380 8.430
Delta 13.055 2.583
[image:6.595.133.458.159.757.2]Rank 1 2
Table 4.2. Response Table for Means for Modified ZA-27 Alloy (Furnace Cool)
Level A B
1 0.8073 0.4378
2 0.4057 0.4123
3 0.1998 0.4407
4 0.3588 0.4602
5 0.3879 0.4084
Delta 0.6075 0.0518
Rank 1 2
(a)
(b)
Fig. 4. Main effects plots for coefficient of friction of Modified ZA-27 Alloy (Furnace Cool) (a) S/N Ratios (b) Mean
0.49 0.37 0.24 0.12 0.06 16
14
12
10
8
6
4
2
0
2.5 2.0 1.5 1.0 0.5 Nr. pressure
M
e
a
n
o
f
S
N
r
a
ti
o
s
Sliding speed Main Effects Plot for SN ratios
Data Means
Signal-to-noise: Smaller is better
0.49 0.37 0.24 0.12 0.06 0.8
0.7
0.6
0.5
0.4
0.3
0.2
2.5 2.0 1.5 1.0 0.5
Nr. pressure
M
e
a
n
o
f
M
e
a
n
s
Sliding speed
Main Effects Plot for Means
[image:6.595.137.452.193.492.2]Analysis of variance (ANOVA)
The experimental results were examined with analysis of variance (ANOVA) which is used to carry out a systematic influence of the parameters like, Nr. Pressure and sliding speed
that significantly affect the performance measures.
Statistically, F test tool is performed to see which design parameters have a significant effect on the quality characteristic. The F-ratio is a ratio of the mean square error to the residual error and is traditionally used to determine the significant of a factor. The P-value reports the significant level (suitable and unsuitable) in Table 5, 6 and 7. Percentage of contribution is defined as the significance rate of process parameters on the coefficient of friction.
This analysis is performed for a significance level of α = 0.05, i.e. for a confidence level of 95%. Thus, if a P-value is less than 0.05, than the result would be considered as a statistically significant.
Multiple Linear Regression Model
A multiple linear regression model is used to develop using statistical software ‘MINITAB 16’. This model gives the correlation between the effective factors (Normal pressure and sliding speed) and the coefficient of friction (quality characteristic) to observed data.
The regression equation for Modified ZA-27 alloy (As-received)
COF = 0.55392 - 0.2420 (A) - 0.1231 (B) ---Eq (2)
R-sq = 98.09%
The regression equation for Modified ZA-27 alloy (Quenched)
COF = 0.7205 - 0.1925 9 (A) - 0.1235 (B) --- Eq (3)
R-sq = 86.89%
The regression equation for Modified ZA-27 alloy (Furnace cool)
COF = 0.4319 - 0.2321 Nr. Pressure (A) - 0.0196 (B) -- Eq (4)
R-sq = 87.97%
From Eq (2), Eq(3) and Eq(4) noticed that the negative value of coefficient of Nr. Pressure and sliding speed reveals that increase in Nr. Pressure and sliding speed decreases the coefficient of friction of Modified ZA-27 alloy.
Conclusions
The experimental reveals the following conclusions.
Taguchi method can be used to analyze the friction
coefficient of Modified ZA-27 alloy.
Normal Pressure (90.78%) has the highest influence on
coefficient of friction followed by sliding speed (7.31%) for Modified ZA-27 alloy (As-received).
Normal Pressure (79.34%) has the highest influence on
[image:7.595.69.519.248.301.2]coefficient of friction followed by sliding speed (7.55%) for Modified ZA-27 alloy (Quenched).
Table 5. Analysis of Variance for Modified ZA-27 Alloy (As- received)
Source DF Seq SS Adj SS Adj MS F-Value P-Value % of contribution Nr. Pressure 4 1.58703 1.58703 0.396758 190.61 0.000 90.78%
Sliding speed 4 0.12781 0.12781 0.031952 15.35 0.000 7.31%
Error 16 0.03330 0.03330 0.002081 1.91%
[image:7.595.74.512.332.385.2]Total 24 1.74814 100.00%
Table 6. Analysis of Variance for Modified ZA-27 Alloy (Quenched)
Source DF Seq SS Adj SS Adj MS F-Value P-Value % of contribution Nr. pressure 4 1.5113 1.5113 0.37783 24.20 0.000 79.34%
Sliding speed 4 0.1438 0.1438 0.03595 2.30 0.103 7.55%
Error 16 0.2498 0.2498 0.01561 13.11%
Total 24 1.9049 100.00%
Table 7. Analysis of Variance for Modified ZA-27 Alloy (Furnace Cool)
Source DF Seq SS Adj SS Adj MS F-Value P-Value % of contribution Nr. pressure 4 1.01397 1.01397 0.253492 28.98 0.000 87.17% Sliding speed 4 0.00925 0.00925 0.002312 0.26 0.897 0.80%
Error 16 0.13995 0.13995 0.008747 12.03%
Total 24 1.16317 100.00%
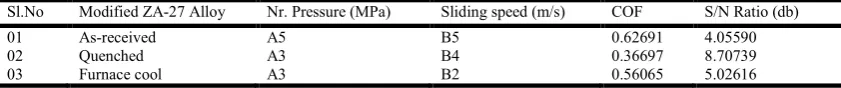
Table 8. Optimum level Process parameters for Volumetric Wear rate
Sl.No Modified ZA-27 Alloy Nr. Pressure (MPa) Sliding speed (m/s) COF S/N Ratio (db)
01 As-received A5 B5 0.62691 4.05590
02 Quenched A3 B4 0.36697 8.70739
[image:7.595.83.502.420.471.2] [image:7.595.84.505.511.555.2] Normal Pressure (87.17%) has the highest influence on coefficient of friction followed by sliding speed (0.80%) for Modified ZA-27 alloy (Furnace cool).
The optimal tribological testing combination for minimum
coefficient of friction is found to be A5B5, A3B4 and A3B2 for As-received, Quenched and Furnace cool specimen.
The Normal Pressure parameter can be considered as
statistically significant for As-received, Quenched and Furnace cool specimen.
REFERENCES
Ahmet Turk, Mehmet Durman, E. and Sabri Kayali 2006. “The effect of Ti-B and Sr on the mechanical behavior of the Zinc-aluminum based ZA-12 alloy produced by gravity
casting” , Intl Journal of Materials Research, Volume 97,
(8), 1-6.
Babic Miroslav, Aleksandar Vencl, Slobodan Mitrovic and Ilija Bobic, 2009. “Influence of T4 Heat Treatment on Tribological Behavior of ZA-27 Alloy Under Lubricated Sliding Condition”, Tribol Lett 36:125–134, DOI 10.1007/s11249-009-9467-x.
Babic, M., Ninkovic, R., Mitrovic, S., Bobic, I. 2007. “Influence of heat treatment on tribological behavior of
Zn-Al alloys”, Tribology in industry, volume 29, No. 1and 2.
Bobic, B., Mitrovic, S., Babic, M., Vencl, A. and Bobic, I. 2011. “Corrosion behaviour of the As-cast and Heat-treated
ZA-27 Alloy”, Tribology in industry, Vol. 33, No.2, pp-
87-93.
Jovanovic, M.T., Bobic, I., Djuric, B. Grahovac, N., Ninkovic, R. 2005. “Lubricated and Dry Sliding of a Heat Treated
Zn-basedAlloy”,2ndInternational conference, Deformation
processing and structure of materials, pp- 83-87.
Jovanovic, M.T., Bobic, I., Djuric, B., Grahovac, N. and Ilic, N. 2007. “Microstructural and sliding wear behaviour of a
hea-treated zinc-based alloy”, Tribology letters, Vol.25,
No. 3. pp-173-184.
Miroslav Babic, Slobodan Mitrovic and Branislav Jeremic, 2010. “The influence of heat treatment on the sliding wear
behavior of a ZA-27 alloy”, Tribology International, 43
16-21.
Mukundadas Prasanna Kumar and Kanakuppi Sadashivappa 2006. “Dry sliding wear behaviour of garnet particles reinforced Zinc aluminium alloy metal matrix composites”,
Materials Science, Volume 12, 1392–1320.
Seenappa, and Dr. Sharma, K.V. 2011. “Effect of alloying additions on tribological properties of ZA alloys”,
International Journal of Advanced Engineering and Applications, Jan, pp 152-155.
Seenappa, K.V. and Sharma 2011. “Effect of alloying additions on tribological properties of ZA alloys”,
International Journal of Advanced Engineering and Application, Volume2, Jan 152–155.
Shanta Satry, M.Krishna and Jayagopalan Uchil 2001. “A study on damping behavior of aluminite particulate
reinforced ZA-27 alloy metal matrix composites”, J. Alloys
and Compounds, Volume 314, 268-274.
Sharma, S. C., Girish, B. M., Kamath, R. and Satish, B. M. 1998. “Graphite particles reinforced ZA-27 alloy composite materials for Journal bearing applications”, Wear 219,162- 168.
Sharma, S. C., Rao, P. R. and Girish, B. M. 1995. “Mechanical properties of as-cast and heat-treated ZA-27/silicon carbide
particulate composites”, Materials and Design, 16 ,(5)
277-280.
Shuqing Yan, Jingpei Xie, Zhongxia Liu, Wenyan Wang, Agin Wang and Jiwen Li, 2007. “Influence of different Al contents on microstructure, tensile and wear properties of
Zn-based alloy”, J.Mater. Sci. Technol., 26970, 2010, Pp
648-652.
Yuanyuan, Tungwai, Wei Xia and Wen Zhang 1996. “Effect of Mn content on the tribological behaviour of ZA27%Al-2%Cu alloy”, Wear, Volume 198, 129-135.