Geometrical Feature Extraction for Glaucoma Detection
M. Arulmary
Research Scholar Bharatiyar University
Coimbatore
S. P. Victor,
PhD Dean of Science St. Xavier’s CollegePalayamkottai
ABSTRACT
Glaucoma affects most of the eyes of the people which leads to blindness. Glaucoma harms the optic nerve cells that transmit graphic information to the brain. Hence it is important to detect glaucoma in eyes. Cup-to-Disc Ratio (CDR) is commonly used as an important parameter for glaucoma screening, involving segmentation of the optic cup on fundus images. A novel approach is proposed using the intensity values and size of the cup and disc. The proposed method uses the radius of the cup and disc for feature extraction. The features are classified using Support Vector Machine (SVM) classifier. The proposed method uses RIM-ONE dataset for evaluation. It achieves 99% specificity at 82% sensitivity with 0.863 AUC.
Keywords
Optic cup, Optic disc, SVM classifier, Retinal rim
1.
INTRODUCTION
Glaucoma is an eye disease which occurs due to the intraocular pressure inside the eye triggered by secretion of excess fluid which in turn leads to damage of the optic nerve. This can impair vision by causing irreversible damage to the optic nerve and to the retina. This will lead to the blindness if it is not detected at the earlier stage. Glaucoma results in vision loss, and is an especially dangerous eye condition because it frequently progresses without noticeable symptoms .Early glaucomatous is complicated to detect, requiring suspicious examination of the optic nerve. The detection of glaucoma through Optical Coherence Tomography (OCT) and Heidelberg Retinal Tomography (HRT) are very costly [1, 2] compared to digital fundus images. It is easy to extract the features of the fundus images such as optic disc and cup to suspect the glaucoma [3, 4, 5].Glaucoma detection is classified into two categories: Primary open angle glaucoma and another is secondary glaucoma. In very early stage if it is diagnosed as glaucoma, that stage is called as primary open angle glaucoma. If it is diagnosed at later stage, it is secondary glaucoma. In [6], open angle glaucoma diagnosis is introduced which makes use of the area of optic cup and neuron retinal rim.
Optic Nerve Head (ONH) assessment for glaucoma detection is commonly done by observing stereo optic disc images for structural abnormalities. Stereoscopic photographs of the optic nerve allow a perception of the cup depth, which is an important cue for glaucoma. There are many researches in monocular images that have evaluated the changes in the optic nerve by computing the ONH depth map using stereo matching methods [7-8]. Cup-to-Disc Ratio (CDR) is an important parameter which is calculated from the optic disc and cup and is commonly used in identifying elongation of optic cup and loss of neuron-retinal rim. In [9], CDR estimation with thresholding techniques is calculated from stereo images. This method requires the huge cost and high
level of expertise required for stereoscopic evaluation. Hence, the use of stereo imaging is limited in glaucoma detection.
In [10], depth estimation and cup extraction is done on a single image using a coupled sparse dictionary based supervised method. CDR estimation has been widely used for glaucoma detection in monocular retinal fundus images. Various methods such as deformable model based [11], super pixel based [12] and supervised classifier based methods [13] have been implemented on monocular images to segment the optic cup and compute CDR. Very few works have directly used CDR for classification of normal and glaucomatous discs [14]. The use of CDR for glaucomatous detection is limited due to the considerable overlap between glaucomatous and normal cases [15].
Akshaya et al. introduce a technique [16] which is based on the assumption that the actual depth map of the disc is related to the intensity variations inside the disc. They performed super pixel-based supervised soft segmentation of optic cup from the retinal fundus image [17], and build a depth map of the optic disc ROI. They also developed a fast marching technique to estimate the unsupervised depth map, and combine the two to compute our final depth estimate of the optic disc. This is used to compute spatial features and intensity features that characterize the variations in the depth, for the detection of glaucoma.
Many methods have focused on achieving accurate cup segmentation to compute CDR, but only few have explored the next step of using this information for detection. In [18], a super pixel-based segmentation is developed followed by ellipse fitting, while in [19], thresholding and morphological operations are performed, to extract the optic disc and optic cup boundaries. Various parameters are calculated from these structures and used for image level classification. Many methods are concentrated in extracting features from the retinal images. Features like wavelet-based features [20], fractal features [21], and Gabor features [22] are extracted for classification of normal and glaucomatous images. Recent work shave also tried reconstruction based learning techniques [23-24] to compute the optic disc and optic cup parameters for glaucoma detection.
2.
SYSTEM ARCHITECTURE
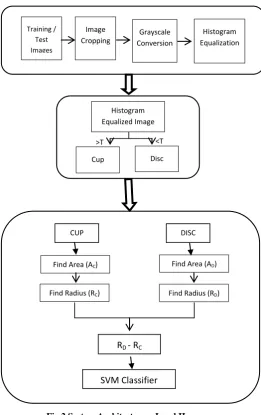
[image:2.595.312.574.69.485.2]The proposed method extract geometrical feature of optic cup and disc from fundus images. For this purpose, the fundus image is pre-processed to obtain the optic disc and cup. Then the area is calculated for the disc and cup from which the radius is calculated. The distance between the cup and the disc is calculated from the radius. It is observed that the distance between the cup and disc of normal eyes and glaucomatous eyes are dissimilar. Figure 1 and 2 shows the overall architecture of the proposed system. The proposed system consists of two phases: training phase and testing phase. The features are extracted and it is trained in training phase using SVM classifier.
Fig. 1 System Architecture – Level I
The algorithm for feature extraction is as follows:
Step 1: Image cropping. As the fundus image is too large, feature extraction may take long time. Hence, the region of interest is cropped for further processing.
Step 2: Gray-scale Conversion Step 3: Histogram equalization
Step 4: Identification of cup and disc. Thresholding is used to Differentiate cup, disc and the background. It is observed that the gray scale of cup is above 250 and the disc is between 240 and 250. The remaining gray values are identified as background.
Step 5: Calculating area of cup and disc, it is denoted as AC and AD respectively.
Step 6: Calculating radius of the cup and disc, it is denoted as RC and RD respectively.
[image:2.595.47.299.213.412.2]Step 7: The difference between cup and disc is calculated as …….. (1)
Fig.2 System Architecture – Level II
After extracting features, it is trained and classified using SVM classifier. The choice of SVM over other traditional methods such as nearest neighbours, regression, neural networks and discriminant analysis is by their reported advantages [25]. It does not require regularity in the data so that it can be applied to data following an unknown distribution. It scales well to high dimensional data, and the trade-off between complexity and error can be controlled explicitly. Moreover, SVM is the classifier providing the best framework for comparison with other state-of-art methodologies without compromising future improvements of the system.
3.
EXPERIMENTAL RESULTS
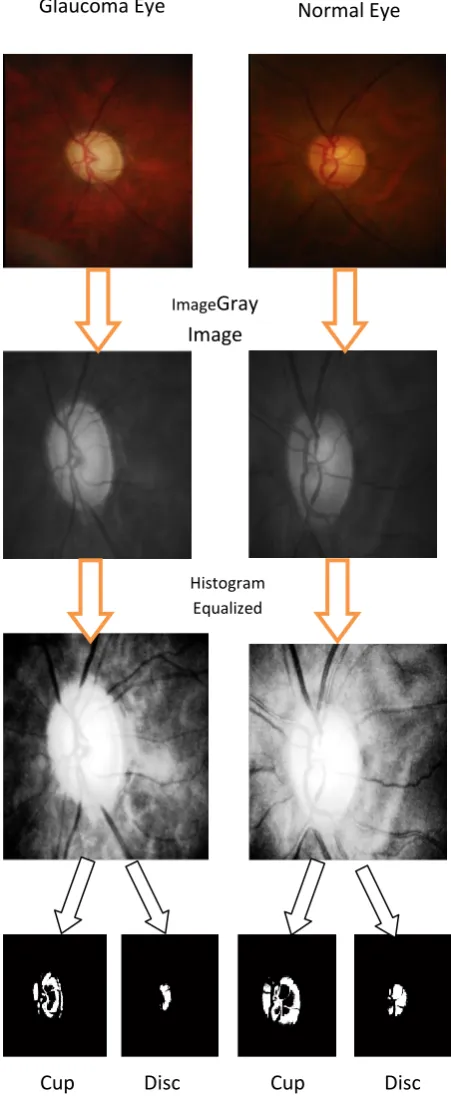
The proposed method is evaluated on publicly available RIM-ONE r3 database [26]. The RIM-RIM-ONE database is specifically designed for glaucoma diagnosis, not only for medical educational purposes, but also as an evaluation tool for designers of segmentation algorithms. RIM-ONE allows the free download of different fundus images (healthy eyes and eyes with different glaucoma levels). It consists of 159-image among which 85 are normal eyes, and 74 are glaucomatous eyes. The process of feature extraction is shown in Fig. 3.
Training Phase
Training Images
Feature Extraction
Pre-Processing
Training
Training Phase
Test Images
Feature Extraction
Pre-Processing
Classifica tion
Histogram Equalization Grayscale
Conversion Training /
Test Images
Image Cropping
Histogram Equalized Image
Cup Disc
>T <T
Find Radius (RC) Find Area (AC)
Find Radius (RD) Find Area (AD)
CUP DISC
Input Image of
Normal Eye
Input Image of
Glaucoma Eye
[image:3.595.323.537.82.654.2]
Cup
Disc
Cup
Disc
Fig 3 Process of Feature extraction (a) Glaucoma Suspects (b) Normal Eyes
[image:3.595.54.280.93.644.2]From Fig. 3, it is clear that the thresholding technique is well suited to identify cup and disc of the eyes.
Fig 4. shows the disc and cup of various fundus images.
Glaucoma Normal Glaucoma Normal
Fig. 4 Left 2 Columns Optic Disc Segmentation and Right 2 Columns Optic Cup Segmentation
It is observed that the size of the cup of glaucoma suspect eyes is larger than the normal eyes. The radius is calculated for optic cup and disc and the difference is shown in Table 1. Histogram
Equalized Image
Gray
Table 1. Radius Difference for Glaucoma suspects and healthy eyes
Glaucoma Suspects Healthy Eyes
Image Radius
Difference Image
Radius Difference
G-1-L 52.01 N-1-L 33.44
G-2-R 53.67 N-2-R 29.40
G-3-L 51.81 N-3-L 29.34
G-4-R 55.26 N-4-R 29.67
G-5-L 52.86 N-5-L 31.16
G-6-R 51.12 N-6-R 28.33
G-7-L 52.84 N-7-L 30.23
G-8-R 52.46 N-8-R 30.63
G-9-L 55.09 N-9-L 28.95
G-10-R 55.14 N-10-R 32.56
Average 53.23 Average 30.37
It is observed that the radii difference of healthy eyes and glaucoma suspects eyes are dissimilar. This difference is given to SVM classifier. The performance of the proposed method is evaluated using accuracy, specificity and sensitivity. In order to calculate these measures, following terminologies must be known:
True Positives (TP) True Negatives (TN) False Positives (FP) False Negatives (FN)
The accuracy, specificity and sensitivity are calculated as
(2)
(3) (4)
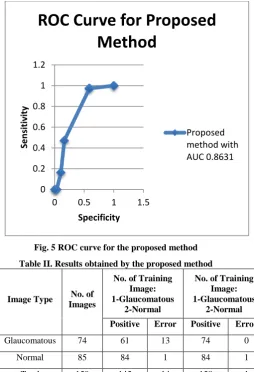
Where N is the total number of fundus images, F are actual false, P are actual true. The proposed method is evaluated by plotting ROC curve. The number of training images is varied to find the sensitivity and specificity. It is shown in Fig. 5. Table II shows the results obtained by the proposed method.
Fig. 5 ROC curve for the proposed method Table II. Results obtained by the proposed method
Image Type No. of Images
No. of Training Image: 1-Glaucomatous
2-Normal
No. of Training Image: 1-Glaucomatous
2-Normal Positive Error Positive Error
Glaucomatous 74 61 13 74 0
Normal 85 84 1 84 1
Total 159 145 14 158 1
4.
CONCLUSION
Glaucoma is a disease that causes optic nerve damage, and can lead to permanent vision loss. Early detection of its presence is the key to prevent complete vision loss. Image processing technique can be used to identify glaucoma at its earlier stage. In this work, glaucoma is identified in fundus images making use of the distance between cup and disc. The proposed method is tested in RIM-ONE dataset and it achieves 99% specificity at 82% sensitivity with 0.863 AUC.
5.
REFERENCES
[1] Acharya, U. R., Ng, E.Y.K., and Suri, J. S., “Image modeling of humanEye” Artech House, MA, USA, 2008a,April.
[2] U.R., Chau, K. C., Ng, E. Y. K., Wei, W., and Chee, C., “Application of higher order spectra for the identification of diabetes retinopathy stages”. J. Medsyst. USA. 2008b. doi: 10.1007/s10916-008-9154-8.
[3] Song, X., Chen, Y., Song, K., and Chen, Y., “A Computer – based diagnosis of glaucoma using an artificial neural network”. Proceedings of 17th Annual Conference IEEE Engineering in Medicine and Biology, 1, 847-848, 1995.University Science, 1989.
[4] Viranee Thongnuch, Bunyarit Uyyanonvara, “Automatic optic disc detection from low contrast retinal images of ROP infant using mathematical morphology”, 2000.
0 0.2 0.4 0.6 0.8 1 1.2
0 0.5 1 1.5
Se
n
si
tiv
ity
Specificity
ROC Curve for Proposed
Method
[image:4.595.56.280.78.347.2][5] Nayak, J. Bhat, P.S., Acharya, U. R., Lim, C.M., and Kagathi, M., “Automated identification of different stages of diabetic retinopathy using digital fundus images”. J. Med. Sys.USA. 32:2107-115, 2008,doi:10.1007/s10917-007-9113-9.
[6] Dnyaneshwari D. Patil, Ramesh R. Manza, “Primary Open Angle Glaucoma Diagnosis using Neuro Retinal Rim Ratio”, International Journal of Computer Applications (0975 – 8887) National Conference on Digital Image and Signal Processing 2016, pp: 6-11 [7] L. Tang, et al., “Robust Multi-scale Stereo Matching
from Fundus Images with Radiometric Differences,” IEEE Transactions on Pattern Analysis and Machine Intelligence, vol. 33, no. 11, pp. 2245–2258, Nov. 2011. [8] T. Nakagawa, et al., “Quantitative depth analysis of optic
nerve head using stereo retinal fundus image pair,” J. Biomed. Opt, vol. 13, no. 6, pp. 064026–064026– 10,2008.
[9] C. Muramatsu, et al., “Determination of cup-to-disc ratio of optical nerve head for diagnosis of glaucoma on stereo retinal fundus image pairs,” 2009, vol. 7260, p72603L– 72603L–8.
[10]A. Chakravarty and J. Sivaswamy, “Coupled Sparse Dictionary for Depth-Based Cup Segmentation from Single Color Fundus Image,” in MICCAI 2014, Springer, 2014, pp.747–754.
[11]. D. W. K. Wong, et al., “Level-set based automatic cup-to-disc ratio determination using retinal fundus images in ARGALI,” in IEEE EMBS 2008, pp. 2266–2269.
[12]J. Cheng, et al., “Super pixel Classification Based Optic Disc and Optic Cup Segmentation for Glaucoma Screening,” IEEE Transactions on Medical Imaging, vol.32, no. 6, pp. 1019–1032, 2013.
[13]D. W. K. Wong, et al., “Intelligent fusion of cup-to-disc ratio determination methods for glaucoma detection in ARGALI,” in IEEE EMBC 2009, pp. 5777–5780.
[14]J. Nayak, S. Bhat, N. Shetty, and T.-C. Lim, “Automated Diagnosis of Glaucoma Using Digital Fundus Images,” J Med Syst, vol. 33, no. 5, pp. 337–346, Oct. 2009.
[15]J.B. Jonas, et al., “Optic disc, cup and neuron retinal rim size, configuration andcorrelations in normal eyes”, Invest Ophthalmol Vis Sci. 1988;29:1151–8
[16]Akshaya Ramaswamy1, Keerthi Ram2, Mohana sankar Sivaprakasam1, “A Depth Based Approach to Glaucoma Detection Using Retinal Fundus Images”,
Proceedings of the Ophthalmic Medical ImageAnalysis International Workshop, 2016, pp. 9-16
[17]A. Ramaswamy, et al.,"A polar map based approach using retinal fundus images for glaucoma detection," Second Ophthalmic Medical Image Analysis International Workshop, OMIA 2015
[18]Jun Cheng et al., “Super pixel Classification Based Optic Disc and Optic Cup Segmentation for Glaucoma Screening”, IEEE Trans. Med. Img, 2013.
[19]J. Nayak, et al., “Automated Diagnosis of Glaucoma Using Digital Fundus Images,” JMed Syst, 2009.
[20]Yun, Wong Li et al., “Glaucoma Classification Using Brownian Motion and Discrete Wavelet Transform”, Journal of Medical Imaging and Health Informatics, 2014
[21]P. Y. Kim, et al, “Novel Fractal Feature-Based Multiclass Glaucoma Detection and Progression Prediction,” IEEE Journal of Biomedical and Health Informatics, 2013.
[22]U. R. Acharya, et al, “Decision support system for the glaucoma using Gabor transformation,” Biomedical Signal Processing and Control, 2015.
[23]Y. Xu et al., “Efficient reconstruction-based optic cup localization for glaucoma screening,” in MICCAI 2013.
[24]J. Cheng et al., “Sparse Dissimilarity-Constrained Coding for Glaucoma Screening, ”IEEE Trans. Biomed. Engg, 2015.
[25]Auria L, Moro R (2008). Support Vector Machines (SVM) as a technique for solvency analysis. Discussion papers, 811, DIW Berlin.