29
Push and Update Model for Supporting Service
Availability in a Local Mobile Cloud
Oladeji P. Akomolafe
Department of Computer Science University of Ibadan, Ibadan, NigeriaOluwabusayo Omotosho
Department of Computer Science University of Ibadan, Ibadan, NigeriaABSTRACT
Mobile cloud computing (MCC) is the blend of cloud computing, mobile computing and wireless network to solve resource limitations of mobile devices by providing virtualized computing resources and services in a shared and scalable environment through network on a pay per use model to mobile clients. The availability of these active services- storage, google mail etc- in the mobile cloud keep the mobile cloud active and relevant. Research reveals that battery plays a major role in the provisioning of a service in a mobile cloud. However, Mobile Ad-hoc Network (MANET) as a platform that support local mobile cloud exhibits battery problems that pose greater challenges to the availability of a service as users move from one node to the other. Hence, this work aims at reducing the energy requirement of the monitoring service system in a local mobile network using a push and update technique.
A push and update service monitoring model was developed and simulated on ns-3 to monitor service availability and necessary device status parameters such as energy level, processing power and storage capacity of mobile devices (nodes) in MANET. The push and update table was used to hold necessary device information by the service monitoring system which enables it to rest (come up at set time intervals) and alternate between two modes (Hibernation and Activation), and by so doing it saves computing resource and energy for other computation tasks. The model was evaluated by comparing it with the existing framework using service availability and battery consumption.
The simulation results revealed on average 96.86% and 676.73mAh, of service availability and battery consumption respectively, for the developed PUP model, against 95.93% and 895.43mAh of average service availability and battery consumption respectively, for the existing framework.
General Terms
Cloud Computing, Mobile Cloud Computing, Service Availability
Keywords
Local Mobile Cloud, Push and Update
1.
INTRODUCTION
In the recent times, there has been a significant upsurge in the use of mobile applications and systems i.e the number of systems that are specially based on mobile technologies is increasing, and new computation models (e.g., Cloud Computing) provide advances in these systems. Cloud Computing helps to address one of the main weaknesses of mobile systems which is the lack of computational resources. Even with advances in device technology, resources (energy, storage, and processing) at the mobile host are limited [3].
The Cloud enables the delegation of some processing and storage tasks that must otherwise be executed in nodes with limited resources. This opens up new prospects for mobile systems and as such the concept of Mobile Cloud Computing has emerged, that is, “an infrastructure where storage and processing of data could happen outside the mobile device”. More explicitly, [7] defines Mobile Cloud Computing as the blend or hybrid of cloud computing technology, mobile computing technology and wireless network to create great computational resources to mobile clients.
Data storage and processing happening outside the mobile devices in the cloud function under three schemes [8]: traditional scheme, local mobile scheme and thirdly, a hybrid scheme. The Local Mobile Cloud is needed in domains where mobile applications also need to be supported by data storage and processing services provided by the mobile platform itself in a transparent and flexible way, such as rescue teams [9], security forces [10], tourism [11], et cetera. This is of key interest in case of disasters in remote areas, where typically the common network infrastructures are not accessible and the government agencies need to apply certain action protocols to support victim search, rescue and identification. [1]. Nevertheless, the Local Mobile Cloud approach is typically supported by a Mobile Ad-Hoc NETwork (MANET), which poses new challenges [12] such as battery problems, dynamic topology among others, that must be appropriately addressed to ensure the dependability of the Mobile Cloud. Dependability concepts involve the quality attributes of availability, reliability, safety, and integrity [6], of which availability is particularly susceptible to the dynamicity of the network topology that characterize the mobile networks.
This dynamicity is created by the mobility of nodes (devices) that make up the network. More so, the nodes may be switched of or disconnected either temporarily or permanently, and since these networks are typically multi-hop, it usually entails link failures, route changes, or even network partitions, which could have deep impact on the availability of the services deployed in the network. The availability of a service is directly proportional to its number of active replicas. However, to replicate a service intensively, it requires intensive energy consumption. Hence, it is necessary to provide an energy-aware solution that compliments the performance of the system with efficient energy consumption.
2.
RELATED WORKS
provide a major impact on their efficiency: when to replicate and where to deploy a service.
There are various events that can activate the creation, migration or deletion of replicas: the battery of the host node is running out, or the node switches off, the demand for the service increases, along with others. In addition to these events, it is worth mentioning the prediction of a network partition. A network partition can affect the availability of a service and the constancy of the shared information [5]. [2] observed that in wireless ad-hoc networks, the network topology changes dynamically and erratically due to node mobility, and that such topological dynamics are further exacerbated by the natural grouping behavior as users move from one end to the other, which frequently leads to network partitioning. In ad-hoc networks, network partitioning poses critical threats to the provisioning of centralized services because it disconnects many mobile users from the central server. So a collection of novel run-time algorithms was proposed which adaptively ensure the centralized service is available to all mobile nodes during network partitioning, while reducing the number of servers required. The wide network service coverage is attained by prediction of partition and replication of service on the servers, and assisted by distributed service selection on steady mobile nodes.
[3] exploits the observation that using tiered clouds, i.e. clouds at multiple levels (local and public) can boost the performance and scalability of mobile applications. The mobility of users introduces new difficulties in facilitating an optimal breakdown of tasks that can implement cooperatively on mobile clients and the tiered cloud architecture while considering multiple QoS goals like delay, device power consumption and user cost/price. A novel framework to model mobile applications as location-time workflows (LTW) of tasks was proposed; where user mobility patterns are converted to a mobile service usage pattern, which shows that an optimal mapping of LTWs to tiered mobile cloud resources is a problem very difficult to solve. An efficient heuristic algorithm called MuSIC (Mobility-Aware Optimal Service
Allocation) was proposed, which is able to perform well and scale well to a large number of users while ensuring high application QoS.
3.
METHODOLOGY
31
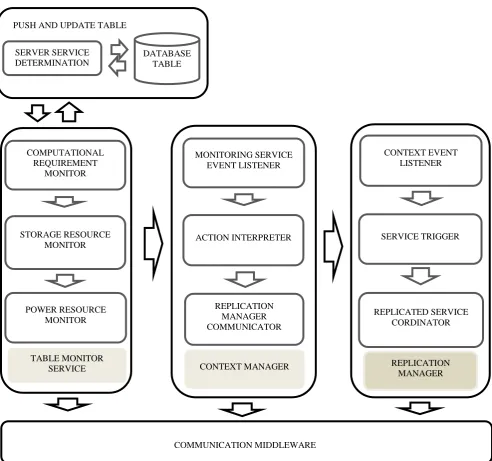
Figure 1: Proposed Push and Update
3.1
The push and update table
The push and update table is used by the monitoring service to hold device status parameters, as it requires liitle or no computational resource to maintain its contents. The push and update table is composed of two (2) main sub-components which are:
1. The service server determination computation module, and
2. The database module
3.1.1 The service server determination
computation module
The service server determination computation module is the module that computes the scores from the parameters collected by the monitoring service module to determine, from all the nodes on the network, the node that is best suited to serve as the server and the service host. The service server determination computation module is responsible for processing and storing the information received from the
Monitoring Service. This information will be used by the Replica Manager Service in order to adjust the configuration of the activation/hibernation of the replicas according to the changes produced in the context.
3.1.2 The Database Module
The database module is intended to hold the scores gotten from the service server determination module. It simply holds the score and basically requires no computation resource. A copy of the table may be held in memory at any particular time and it only needs a small amout of memory space to perform it’s task. Since insertion and deletion from the table only takes place when a node first enters a network domain or when a node leaves a network domain respectively, the only activity that happens at specific time intervals are the updating of scores on the table when a push and update event takes place. This way, the table only needs very little or no energy or computational resource to be maintained and managed. The interaction with the table is only with the monitoring service, and the monitoring service in this research work only runs at
REPLICATED SERVICE CORDINATOR SERVICE TRIGGER
CONTEXT EVENT LISTENER
REPLICATION MANAGER STORAGE RESOURCE
MONITOR COMPUTATIONAL
REQUIREMENT MONITOR
[image:3.595.57.550.65.526.2]POWER RESOURCE MONITOR
TABLE MONITOR SERVICE
ACTION INTERPRETER MONITORING SERVICE
EVENT LISTENER
REPLICATION MANAGER COMMUNICATOR
CONTEXT MANAGER
COMMUNICATION MIDDLEWARE SERVER SERVICE
DETERMINATION
DATABASE TABLE PUSH AND UPDATE TABLE
specific intervals and hence communication and unnecessary iterations between the two modules is reduced to the bearest minimum.
4.
RESULTS AND EVALUATION
The Push and Update architecture was simulated and evaluated using the network simulator 3 (NS-3) on Ubuntu Linux version 14.04 LTS and mobile application client. C++ code was used to write the script to generate the XML file that was used to generate the scenarios on the screen through NAM (network animator). The computational capabilities of each node on the network was determined for the kind of service needed and also the kind of service to be rendered by
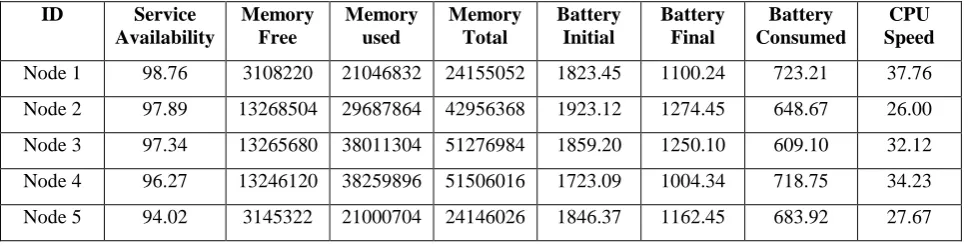
[image:4.595.57.542.226.350.2]the device through the evaluation function. The mobile nodes contains the monitoring service which gathers the information needed to compute the necessary resources the node has to offer the network i.e, it computes the scores of the CPU, battery life and memory of the nodes. The computed scores by the monitoring service in each node is pushed to the push and update table (which is a small path in the main memory). The monitoring service in the simulator monitors these scores for all nodes. The experiment is conducted within one hour interval and the information of the scores updated for each hour of the experiment. The results of the simulation obtained is presnted in table 1 and and averages for each parameter taken and tabulated in table 2 below.
Table 1: Results Obtained
ID Service Availability
Memory Free
Memory used
Memory Total
Battery Initial
Battery Final
Battery Consumed
CPU Speed
Node 1 98.76 3108220 21046832 24155052 1823.45 1100.24 723.21 37.76
Node 2 97.89 13268504 29687864 42956368 1923.12 1274.45 648.67 26.00
Node 3 97.34 13265680 38011304 51276984 1859.20 1250.10 609.10 32.12
Node 4 96.27 13246120 38259896 51506016 1723.09 1004.34 718.75 34.23
Node 5 94.02 3145322 21000704 24146026 1846.37 1162.45 683.92 27.67
Table 2: Averages for each parameter
Service Availability
Memory Free
Memory Used
Memory Total
Battery Initial
Battery Final
Battery Consumed
CPU Speed
96.86 9206769.2 29601320 38808089.2 1835.05 1158.32 676.73 30.76
4.1
Result discussion
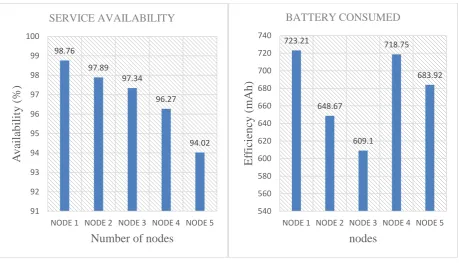
Figure 2 shows the graph for the service availability for each node in the experiment. We recorded the availability of a service based on the CPU, Memory and Battery and the amount of time (in an hour of the experiment) the service is supported by a node.
33
Figure 2: service availability graph for all nodes Figure 3: Battery consumed graph for all nodes
4.2
Result evaluation
An important factor in evaluating the system performance is the level of service availability provided and battery consumed by the push and update (PUP) model against the existing model.
As can be seen in table 3 and 4 below, the push and update model provided on average a service availability of 96.86% as against 95.93% obtained by gabriel et al., 2017 and the battery consumption on average for the push and update model is 676.73 mAh as against the existing model of 895.43 mAh, which is about 218.7 mAh difference.. the graphs in figure 4 and 5 are visual representations for comparison.
Table 3: Service availability comparison between the PUP model aand the existing model
SOLUTION SERVICE AVAILABILITY (%)
Push and Update model 96.86
[image:5.595.59.519.69.332.2]Guerero et al., 2017 (existing) 95.93
Table 4: Battery cosumption comparison between the proposed and the existing model
SOLUTION BATTERY CONSUMED (mAh)
Push and Update model 676.73
Guerero et al., 2017 (existing) 895.43
98.76
97.89
97.34
96.27
94.02
91 92 93 94 95 96 97 98 99 100
NODE 1 NODE 2 NODE 3 NODE 4 NODE 5
A
va
il
abil
it
y
(%
)
Number of nodes
SERVICE AVAILABILITY
723.21
648.67
609.1
718.75
683.92
540 560 580 600 620 640 660 680 700 720 740
NODE 1 NODE 2 NODE 3 NODE 4 NODE 5
Ef
fic
ienc
y
(mA
h)
nodes
Figure 4: Service availability comparison graph Figure 5: Battery consumed comparison graph
Thus, from the results above, it becomes evident that the energy consumption (requirements) of the monitoring service sub-system in a local mobile cloud was reduced by this approach, which is to say the battery consumption was reduced by 218.7mAh and service availability increased by 1.61%.
5.
CONCLUSION
The main idea in this work is that a push and update model was introduced to monitor service availability by monitoring device status in the local network (a community of nodes make up a local cloud between them through short range connections), which aimed at reducing the energy requirement of the monitoring service subsystem in the network. The computational capabilities of each node on the network was determined for the kind of service needed and service rendered by each device through the evaluation function in the push and update table. The PUP model was designed to hold necessary device information provided by the service monitoring systems, and allows the system to save some computing resource and energy for other computation tasks. The simulation was done on network simulator (NS-3) and evaluated results indicates reduced and increased values in terms of battery consumption and service availability respectively, than the existing model.
6.
ACKNOWLEDGEMENTS
Our profound gratitude to all anonymous experts reviewers for their valuable and detailed comments.
7.
REFERENCES
[1] Gabriel Guerrero-Contreras, Jose Luis Garrido, Sara Balderas-Dıaz, and Carlos Rodrıguez-Domınguez (2017). A Context-Aware Architecture Supporting Service Availability in Mobile Cloud Computing IEEETransactions On Services Computing, Vol. 10, no. 6, November/December, 2017.
[2] Karen H. Wang, Baochun Li. Efficient and GuaranteedService Coverage in Partitionable Mobile Ad-hoc Networks (2016). IEEE Sixth International Conference on Cloud Computing (2016).
[3] Reza Rahimi M., Nalini Venkatasubramanian, Athanasios V. Vasilakos. (2015). MoSIC:
Mobility-Aware Optimal Service Allocation in Mobile Cloud Computing IEEE Sixth International Conference on Cloud Computing, 2015.
[4] IBM, “An architectural blueprint for autonomic computing,” IEEE Internet Comput., vol. 18, no. 21, 2005.
[5] Guerrero-Contreras G., J. L. Garrido, S. Balderas D_ıaz, and C. Rodr_ıguez- Dom_ınguez, “Consistent management of context information in ubiquitous systems,” in Internet and Distributed Computing Systems. New York, NY, USA: Springer, 2014, pp. 184– 193.
[6] A. Avizienis, J. C Laprie, B. Randell and C.LandwehrBasic concepts and taxonomy of dependable and secure computing, “IEEE Trans Dependable Secure Comput., vol. 1, no. 1, pp. 11-33, Jan. 2004.
[7] Akomolafe Patrick Oladeji, and Ajayi Olubunmi, “Data Offloading Security Framework in MCLOUD.” Journal of Computer Sciences and Applications, vol. 5, no. 1 (2017): 25-28. doi: 10.12691/jcsa-5-1-4.
[8] N. Fernando, S. Loke, and W. Rahayu, “Mobile cloud computing: A survey,” Future Gener. Comput. Syst., vol. 29, no. 1, pp. 84–106, 2013.
[9] Neyem, S. Ochoa, J. Pino, and R. Franco, “A reusable structural design for mobile collaborative applications,” J. Syst. Softw., vol. 85, no. 3, pp. 511–524, 2012. [10] C. Rodrıguez-Domınguez, K. Benghazi, J. L. Garrido,
and A. V. Garach, “Designing a communication platform for ubiquitous systems: The case study of a mobile forensic workspace,” in New Trends in Interaction, Virtual Reality and Modeling. New York, NY, USA: Springer, 2013, pp. 97–111.
[11] A. Derhab and N. Badache, “A pull-based service replication protocol in mobile ad hoc networks,” Eur. Trans. Telecommun., vol. 18, no. 1, pp. 1–11, 2007. [12] P. Choudhury, A. Sarkar, and N. Debnath, “Deployment
of service-oriented architecture in MANET: A research roadmap,” in Proc. 9th IEEE Int. Conf. Indus. Informat., 2011, pp. 666–670.
96.86
95.93
95.4 95.6 95.8 96 96.2 96.4 96.6 96.8 97
PUP model Guerero et al 2017
A
va
il
abil
it
y
(
%
)
Models
SERVICE AVAILABILITY
676.73
895.43
0 100 200 300 400 500 600 700 800 900 1000
PUP model Guerero et al 2017