REVIEW ARTICLE
APPROACHES TO PHYSICAL DISTRIBUTION COSTS AND EFFICIENCY MEASUREMENTS AND
IMPLICATIONS FOR ECONOMIC DEVELOPMENT OBJECTIVES
*Ehikwe Andrew Egede
Department of Marketing, Faculty of Business Administration, University of Nigeria, Enugu Campus
ARTICLE INFO ABSTRACT
The measurement of cost and efficiency in physical distribution has been a subject of serious debate in marketing literature, particularly the concern for high costs and the need for improvements on the methods and processes of operations. What to be measured and how these are measured remain difficult in physical distribution tasks or functions. A survey design was used, and the population of study was some selected manufacturing firms in south east Nigeria, that are directly involved with finished goods distribution. Data collection was by questionnaire and interview. The data presentation was by simple percentages. The findings were that costs and efficiency in physical distribution were never really measured, appropriated as percentages of stock value and also by estimation. Physical distribution costs is a priority that must be fully established, the methods used properly documented and measures taken to control the costs.
Copyright © Ehikwe Andrew Egede. This is an open access article distributed under the Creative Commons Attribution License, which permits unrestricted use, distribution, and reproduction in any medium, provided the original work is properly cited.
INTRODUCTION
Physical distribution is strategic to the success of marketing that involves product movement to customers. The costs of physical distribution has been on the increase and now constitute more than 25 percent of sales costs, 20 percent of GDP, yet lost sales cost is not involved, and it is the major cost of distribution (Stewart,1970:4-54), while Eztel, Walker andStanton (2001:465) suggest 10 percent of GDP and 15 percent of sales. The approaches to efficiency measurement in physical distribution now constitute serious challenges to the firm in its marketing activities, as Dalrymple (1980:473-438) argues that keeping low costs of distribution and maximisation of customer needs in prompt delivery are the prerogatives of managers, in finding the trade off between a realistic level of customer service and reasonable expenditure on distribution. The determination of optimum levels of customer service (however measured) is one of the most difficult tasks confronting physical distribution managers. The organisations may differ in methods and circumstances of measurements that justify the physical distribution processes of operations, especially the functions of warehousing, transportation, inventory control, order processing, material handling and customer services. In material carrying costs for example, cost reductions in taxes, insurance, obsolescence, obsolete, pilferage, tracing lost shipments, damages in transit, losses from delays and errors of deliveries may be evidences of efficiency. These are the costs that can affect efficiency in
meeting customer satisfaction positively when such are ‘0’
percent (0%) occurrence and negatively in their frequent occurrences.
*Corresponding author: Ehikwe Andrew Egede, Department of Marketing, Faculty of Business Administration, University of Nigeria, Enugu Campus.
The contributions of Smith (1970:4-102) suggests that operating profit is the primary measure of distribution efficiency. The creation of values for customers through value chain management (VCM) or supply chain management (SCM) is also a measure of efficiency, and a functional spin off occurs where an organisation is disadvantaged or can no longer be efficient in creating more values (Mallen (1978:311). Thus, Christopher (1997:71) submits that networking of organisations in the supply chain is striving to increase efficiency by converting information to inventory that can reduce costs, and seeking areas of comparative advantages and outsourcing other areas of minimal competence. The use of qualitative and quantitative values for efficiency measurement have also been considered as the processes of physical distribution are time bound, result specific, and definite standard.In specific terms, Gumdux, Jeyakumar and Tetali (2003: 3-7) suggest productivity, financial and quality as
metrics for measurement of inventory management
performance of organisations, whereas, Lalonde (1985:248) considers these as a drive to more efficient management of inventory assets that has direct impact on customer service. The qualitative measurement of service levels using product availability, order cycle time, consistency in order processing and shipment, response time, error rates, product/shipment related malfunction and special handling are determinants of efficiency standards in the operations of physical distribution functions.
Statement of the Problem
Physical distribution constitutes an area of marketing often
referred to as the “dark continent of marketing” because of the
cost implications involved in the functions and operations of
ISSN: 0975-833X
International Journal of Current Research
Vol. 5, Issue, 12, pp.3782-3788, December, 2013
INTERNATIONAL JOURNAL OF CURRENT RESEARCH
Article History:
Received 14thSeptember, 2013
Received in revised form 25thOctober, 2013
Accepted 10thNovember, 2013
Published online 02ndDecember, 2013
Key words:
Physical Distribution, Cost and Efficiency Measurement, Economic Development.
REVIEW ARTICLE
APPROACHES TO PHYSICAL DISTRIBUTION COSTS AND EFFICIENCY MEASUREMENTS AND
IMPLICATIONS FOR ECONOMIC DEVELOPMENT OBJECTIVES
*Ehikwe Andrew Egede
Department of Marketing, Faculty of Business Administration, University of Nigeria, Enugu Campus
ARTICLE INFO ABSTRACT
The measurement of cost and efficiency in physical distribution has been a subject of serious debate in marketing literature, particularly the concern for high costs and the need for improvements on the methods and processes of operations. What to be measured and how these are measured remain difficult in physical distribution tasks or functions. A survey design was used, and the population of study was some selected manufacturing firms in south east Nigeria, that are directly involved with finished goods distribution. Data collection was by questionnaire and interview. The data presentation was by simple percentages. The findings were that costs and efficiency in physical distribution were never really measured, appropriated as percentages of stock value and also by estimation. Physical distribution costs is a priority that must be fully established, the methods used properly documented and measures taken to control the costs.
Copyright © Ehikwe Andrew Egede. This is an open access article distributed under the Creative Commons Attribution License, which permits unrestricted use, distribution, and reproduction in any medium, provided the original work is properly cited.
INTRODUCTION
Physical distribution is strategic to the success of marketing that involves product movement to customers. The costs of physical distribution has been on the increase and now constitute more than 25 percent of sales costs, 20 percent of GDP, yet lost sales cost is not involved, and it is the major cost of distribution (Stewart,1970:4-54), while Eztel, Walker andStanton (2001:465) suggest 10 percent of GDP and 15 percent of sales. The approaches to efficiency measurement in physical distribution now constitute serious challenges to the firm in its marketing activities, as Dalrymple (1980:473-438) argues that keeping low costs of distribution and maximisation of customer needs in prompt delivery are the prerogatives of managers, in finding the trade off between a realistic level of customer service and reasonable expenditure on distribution. The determination of optimum levels of customer service (however measured) is one of the most difficult tasks confronting physical distribution managers. The organisations may differ in methods and circumstances of measurements that justify the physical distribution processes of operations, especially the functions of warehousing, transportation, inventory control, order processing, material handling and customer services. In material carrying costs for example, cost reductions in taxes, insurance, obsolescence, obsolete, pilferage, tracing lost shipments, damages in transit, losses from delays and errors of deliveries may be evidences of efficiency. These are the costs that can affect efficiency in
meeting customer satisfaction positively when such are ‘0’
percent (0%) occurrence and negatively in their frequent occurrences.
*Corresponding author: Ehikwe Andrew Egede, Department of Marketing, Faculty of Business Administration, University of Nigeria, Enugu Campus.
The contributions of Smith (1970:4-102) suggests that operating profit is the primary measure of distribution efficiency. The creation of values for customers through value chain management (VCM) or supply chain management (SCM) is also a measure of efficiency, and a functional spin off occurs where an organisation is disadvantaged or can no longer be efficient in creating more values (Mallen (1978:311). Thus, Christopher (1997:71) submits that networking of organisations in the supply chain is striving to increase efficiency by converting information to inventory that can reduce costs, and seeking areas of comparative advantages and outsourcing other areas of minimal competence. The use of qualitative and quantitative values for efficiency measurement have also been considered as the processes of physical distribution are time bound, result specific, and definite standard.In specific terms, Gumdux, Jeyakumar and Tetali (2003: 3-7) suggest productivity, financial and quality as
metrics for measurement of inventory management
performance of organisations, whereas, Lalonde (1985:248) considers these as a drive to more efficient management of inventory assets that has direct impact on customer service. The qualitative measurement of service levels using product availability, order cycle time, consistency in order processing and shipment, response time, error rates, product/shipment related malfunction and special handling are determinants of efficiency standards in the operations of physical distribution functions.
Statement of the Problem
Physical distribution constitutes an area of marketing often
referred to as the “dark continent of marketing” because of the
cost implications involved in the functions and operations of
ISSN: 0975-833X
International Journal of Current Research
Vol. 5, Issue, 12, pp.3782-3788, December, 2013
INTERNATIONAL JOURNAL OF CURRENT RESEARCH
Article History:
Received 14thSeptember, 2013
Received in revised form 25thOctober, 2013
Accepted 10thNovember, 2013
Published online 02ndDecember, 2013
Key words:
product movements. These activities which includes warehousing, transportation, inventory management, order processing, customer services and material handling attracts huge costs in capital outlay and transaction costs associated with the movements of products. The management of these costs has been an enormous challenge to marketers especially in determining the actual distribution costs and the efficient handling of the costs through standard measurements that could provide better control.
Objectives of the Study
This study has the objectives to determine
The nature of the costs and efficiency of distribution of products, and this is to further examine what constitutes costs and efficiency in physical distribution that can ensure that these are actually measureable.
The approaches used in measuring costs and efficiency of physical distribution of goods that can enhance improvements and establish standards and procedure for the measurements.
The cost centres for measuring costs and efficiency of physical distribution of products where the proper records of transactions could be standardised for subsequent measurements.
Theoretical Framework
Physical distribution costs and efficiency measurements can be discussed from the systems perspectives involving the movements of materials from the production centres to the consumers. The processes and methods of the movements are based on the relationships between the component functional units that include the following areas and the functions performed:
Warehousing - Storage and handling of stock
Transportation - Physical movements/handling of
stock
Inventory Control - Management of physical stock
Order Processingcustomer needs/demand measurements and documentation.
Handling aids- Unitisation for convenient handling
and Movement
Customer Service and Satisfaction - Combination of the functions to meet the needs of customers
efficiently.
e
The efficiency in the management of the functions is dependent on the minimisation of costs and the maximisation of the delivery services. The problems associated with this, however, are the possibility of determining and measuring all the individual costs involved in distribution as a determinant of the level of efficiency and the use of acceptable and appropriate standards for the total costs of distribution as a system. The marketing literature has explained efficiency as the methods, procedures, and equipment used to accomplish a warehouse task, and as productivity that can be improved by maximising output, (Acker and Landes, 1985:567 and579). For example, an order selection line might be arranged according to the product number sequence, or arranged according to the frequency of movement. Efficiency is improved through the
analysis, evaluation, and selection of methods and performance monitored and reviewed and corrective action should be taken in a timely fashion to increase efficiency. There are no universal standards for determining and measuring efficiency in all organisations, as Taff (1965:67) argues that probing of all cost components has often revealed that some have been more rigorously controlled than others and the total cost approach can be applied to all the component functional units.
Dommermuth and Anderson (1978:324) discuss the
improvement of efficiency through inter functional efficiency that occurs when increased total expenditure for performance of one function results in a more than offsetting decrease in the total cost of another function. The substitutability factor for example, one form of transport (air versus land) increases delivery time but with lower volume of inventory, and since there is a decrease in total inventory cost greater than the increase in total transportation costs, there could be gain through inter functional efficiency. The incompatibility factor was discussed by Nekvasil (1978:254) with the problem of pallet size in measuring efficiency such as a manufacturer with pallet size of 48ft x 4oft for the convenience of stock quantity holding versus a wholesaler favouring 40ft x 32ft pallet size for the convenience of wide variety stocking flexibility of items. The differences in sizes may compel manual loading on the driver which could have ordinarily involved a simple exchange of pallets. The outcome compels a 4 hours labour that would ordinarily have taken a 30minute transaction. The manufacturer clings to the pallet for efficiency while the wholesaler seeks the same reasons to gain efficiency; the result is a loss of efficiency due to lack of agreed standard for achieving efficiency. Efficiency measurements in physical distribution can best be considered as a measure of actual output to the standard output expected or performance relative to expectations. There are various concepts and assumptions on physical distribution efficiency measurements, including the use of total cost concept that measures cost and benefit interests, operating profit values, qualitative values for customer services and the marginal cost or benefit arising from the additional increase per unit of efforts in performing the tasks.
Review of Related Studies on Efficiency Measurement
The discussions in various marketing literature on efficiency measurement in physical distribution have been based on costs, productivity and profitability factors (Bonoma and Clark, 1988:22-34). Others such as Sevin, (1965:vii,7), and Goodman (1972:90-91) consider marketing productivity analysis intended to show how a firm can improve its cost and profitability information for allocating marketing efforts to the performance of different tasks. The basic concept is the cost reduction and increase in revenue in a given segment, and the collation of costs summed up against revenue gives the measurement of efficiency in productivity. There is also the factor of return on investment (ROI) that measures the efficiency of profits rather than (absolute) dollars. The
approach of Feder (1965:134) was on marginal
revenue/marginal costs that define good marketing
performance– the “marketing objective”. The opportunity rate
potential profit/expense ratios may be determinants of efficiency measurements.
The ideas of Anderson and Weitz (1986:3-19) was “long term efficiency” anchored on “net effectiveness” and overheads.
Net Effectiveness= Revenue–Direct Costs.
Efficiency = Net Effectiveness
Administrative Overheads
The use of quantitative costs as basis for determining marketing productivity is not disputable, except that submissions on qualitative costs have also been highly advocated. Bucklin (1978:94) argues on the use of changes in quality of marketing services as productivity measures, including logistical, informational and product functionality. Logistical services address the delivery time, stock availability, and order size, product quality (freshness due to quick delivery after production and storage facilities). Informational services are on waiting time for right information, feedback on return product as quickly as possible, breadth and depth of product in stock, product clustering (easy identification) and standardization (reduce doubts on specifications). Functionality of product enhances value, after sales services, set up costs, warranties, packaging and strength and durability. The various methods and contributions on approaches to physical distribution efficiency measurements are not exhaustive and are applicable to organisations in their peculiar circumstances. In large warehouse, methods could be automated to increase efficiency, but smaller warehouses may simply depend on routine but speedy performance to increase efficiency.
Physical Distribution in Perspectives
Physical distribution accounts for the movement of goods and services to various destinations. In costs and efficiency measurements of physical distribution, the performance standard is measured against established or set standards. The various physical distribution functions are directed at order fulfilments with prompt and timely delivery, least damage in stock and transit, consistency in stock availability to meet time, place, and volume quantity and possession utilities. The assessments of standards of performance are diverse as Smith (1970:4-101) argues that the standards are not clear-cut and tangible as other aspects may be rather intangible. The procedures for measuring efficiency may be accounting oriented with costs as factors that may vary with volume of performance and may otherwise vary with the use of facilities. The interrelatedness of various physical distribution functions could be considered as systems approach, with each segment depending on the other.
Warehouse Transportation Inventory
Control Order Processing Materials
handling Customer Services.
Warehouse determines volume of stock held, transport
movements of stock, level of customer services.
Transportation is important for order processing and fulfilments, warehouse locations. Eztel et al. (2001:464) argue that a decision regarding any of these activities affects all others.
Decentralization versus Centralisation
The controversies on methods, processes and procedures for physical distribution could be extended to the need for centralization or decentralization.
Centralization
Centralization is the process of using a central warehouse, transportation and order processing under a central control. The objective is to enhance efficiency in distribution and cost control. Dalrymple (1980:439-440) suggests that Burroughs was able to close eight regional warehouses and save hundreds of thousands of dollars in rent, personal costs, taxes and inventory carrying costs by moving to centralized distribution. Christopher (1997:123) notes that by reducing the number of stock locations and consolidating inventory in fewer places, higher level of services can be achieved with less total
inventory, in what was considered the “Square Root Rule”
(SRR): where the reduction in inventory is proportional to the square root of the number of locations before and after the rationalization.
A reduction in location from 100 to 25 for example, will approximate 50 percent, thus,
100 to 25 or 10:5.
A central control is the objective. The advantages are the dispensation of quick decisions, common pool of resources and time saving costs in implementation of ideas and planning.
Decentralisation
The decentralization of physical distribution is directed at reaching wider markets at the shortest possible time at minimum costs through the reduction of distances and reduction of bulk as items get closer to consumers at their convenience. Eztel et al. (2001: 474) suggest that the use of distribution centres around markets rather than transportation requirements is to develop under one roof an efficient fully integrate system for the flow of products – taking orders, filling them and preparing them for delivery to customers. Physical distribution is split into different segments and locations in order to maximize the overall efficiency. This is the optimality principle of providing the greatest satisfaction to customers in each segment of the market.
Physical Distribution Cost
The costs of physical distribution cannot be easily quantified such as cost of lost sales, cost of wastes in physical products–
being provided customers, the amount of inventory in the
“distribution pipeline and the costs of physical movements of
inventories constitute the major activities of physical distribution.
The Cost Centres
Warehouse
The warehouse is a major cost centre where the inventories are stocked, though modern inventory management advocates the stockless system that rely on information management using
for example the Electronic Data Interchange (EDI),
Collaborative Planning Forecasting and Replenishment
(CPFR), Efficient Consumer Response (ECR) and Economic Value Added (EVA), all with the objective of increasing efficiency at minimum costs (Donald Walters (ed) (2003). Wentz (1970:391) suggests that as products flow from manufacturers to ultimate consumers, the sizes reduce in quantity and variety. Warehouse locations are based on operating costs, plant to warehouse and to buyers, transportation costs, and costs of delivery delays. The warehouse costs are made up of 70 percent space cost and 30 percent structure of all physical facilities. Gill, Isoma and Sutherland (1985:628) argue that cost reduction is highly dependent on efficient space utilization.
Transportation
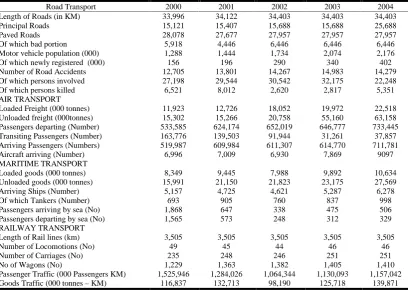
Transportation innovation in capacity and volume, speed and flexibility of operations has contributed greatly to efficiency in customer delivery services. The inter modality of transport within a single organisation or firm is the greatest achievement of efficiency in distribution cost management that reduces multiple handling, trans-loading, losses of goods in transit, and direct destination deliveries, (Eztel et al. (2001:475). The data in the following tables could give an insight into the efficiency
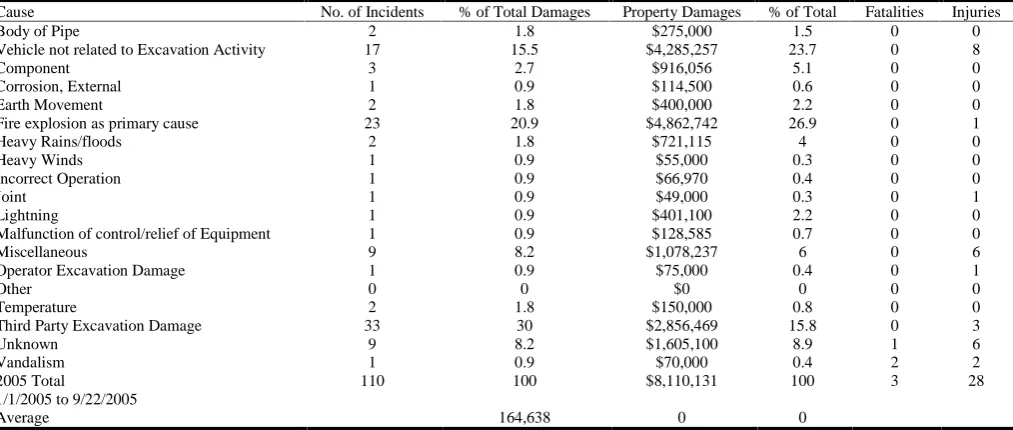
status in transportation used for physical distribution. The Tables 1, 2 and 3 would immediately reveal the enomity of physical distribution costs that are not reflected in the accounts books or Balance Sheet of most companies and organisations and there are indications 100% efficiency in physical distribution may not be easily achieved.
In Table 1 for example, Road transport in Nigeria could be considered hazardous and risky for the distribution of goods. The level of efficiency in the use of road transport may be hampered by the bad roads that have been contributing to the high accident rates. The same problems exist in the use of other modes of transport though the accident rates were not documented. However, the expected efficiency in the use of these modes for physical distribution recorded tremendous growth over the years with the improvements on the volume of goods transported within and out of the country. The pipeline has peculiar characteristics of carrying petroleum and Gas products, yet it did not record accident free usage both in Nigeria and United States as shown in Tables 2 and 3 respectively.
Cost Centres Operations
The functions and tasks of physical distribution are carried out at facilitating or activity points that could be considered as cost centres such as obtained at the following areas of operations.
Warehouse Operations
[image:4.595.94.503.483.773.2]The major activities of the warehouse are the storage of goods and some of the operations that attract costs are the movements of goods. This involves throughput time when the operations start and stop. The output measured are the efforts for the execution and effectiveness including costs and efficiency in the use of storage space, inventory stock holding capacities, storage facilities and other accessories.
Table 1. Transportation Basic Data 2000–2004
Road Transport 2000 2001 2002 2003 2004
Length of Roads (in KM) 33,996 34,122 34,403 34,403 34,403 Principal Roads 15,121 15,407 15,688 15,688 25,688 Paved Roads 28,078 27,677 27,957 27,957 27,957 Of which bad portion 5,918 4,446 6,446 6,446 6,446 Motor vehicle population (000) 1,288 1,444 1,734 2,074 2,176 Of which newly registered (000) 156 196 290 340 402 Number of Road Accidents 12,705 13,801 14,267 14,983 14,279 Of which persons involved 27,198 29,544 30,542 32,175 22,248 Of which persons killed 6,521 8,012 2,620 2,817 5,351 AIR TRANSPORT
Loaded Freight (000 tonnes) 11,923 12,726 18,052 19,972 22,518 Unloaded freight (000tonnes) 15,302 15,266 20,758 55,160 63,158 Passengers departing (Number) 533,585 624,174 652,019 646,777 733,445 Transiting Passengers (Number) 163,776 139,503 91,944 31,261 37,857 Arriving Passengers (Numbers) 519,987 609,984 611,307 614,770 711,781 Aircraft arriving (Number) 6,996 7,009 6,930 7,869 9097 MARITIME TRANSPORT
Loaded goods (000 tonnes) 8,349 9,445 7,988 9,892 10,634 Unloaded goods (000 tonnes) 15,991 21,150 21,823 23,175 27,569 Arriving Ships (Number) 5,157 4,725 4,621 5,287 6,278 Of which Tankers (Number) 693 905 760 837 998 Passengers arriving by sea (No) 1,868 647 338 475 506 Passengers departing by sea (No) 1,565 573 248 312 329 RAILWAY TRANSPORT
Length of Rail lines (km) 3,505 3,505 3,505 3,505 3,505
Number of Locomotions (No) 49 45 44 46 46
Number of Carriages (No) 235 248 246 251 251
No of Wagons (No) 1,229 1,363 1,382 1,405 1,410 Passenger Traffic (000 Passengers KM) 1,525,946 1,284,026 1,064,344 1,130,093 1,157,042 Goods Traffic (000 tonnes–KM) 116,837 132,713 98,190 125,718 139,871
Transportation
Traffic indicators are the loading bays at the warehouse, transportation of goods for internal and external location movements, types of transport used, speed, capacity, loading and unloading facilities, accident rates, safety of goods, damage in transit, truck turn rate and reverse logistics, handling of losses, pilferages, truck availability and other costs associated with transportation of goods. The suggestions of Bowersox, Lamber and Taylor (1980) on total incremental costs by statistical audit of freight, Stewart(1970) for linear programming in determining origin and destination, usage modes of air, water, pipelines, shipment sizes inbound and outbound movements are possible determinants of measures of cost and efficiency in physical distribution.
Inventory Indicators
The requirements for assessing inventories in costs and efficiency could include consistency in availability, losses from non availability, delays in stock supplies, orders fulfilled within a given time, mobile and pipeline stock, carrying costs, taxes, insurance, interests on capital, volume of residual stock,
[image:5.595.163.431.75.238.2]obsolescence, obsolete, perishable standards and many other costs associated with inventory holding (Berkowitz, Kerin, Hartley and William (2000). Inventory constitute the greatest costs in physical distribution with capital tied down in investments, on stocks, transportation costs for the movements of inventory (transit inventory), warehouse costs for the storage of stock and inventory carrying costs. The carrying costs are those that vary with the volume of inventories. The greatest concern for efficiency in inventory is in the areas or aspects of stock control as Ehikwe (2002:192) suggests that cost reduction in inventory management w are on the aspects of reduction in ordering costs, maximisation of inventory movements, minimisation of stock out and stock out periods, risks of pilferage, physical damages and wastes/deterioration of stock. Thus, Wentz (1970:395) argues that excessive inventories or stock imply excessive costs while stock inadequacy can mean shut down plant and at best unsatisfied customers. The real money costs of inventory are processing costs and carrying costs. The dilemma of inventory managers is the loss of sales for less stock and the increase or excess costs for large stocks.
Table 2. Pipeline Petrol Accidents 1998–2006
LOCATION YEAR LIVES LOST
Jesse, Delta State 1998 1082
Acute–Odo 1999 15
Ogwe, Abia State 2000 17
Isioma Abia State 2000 50
Okuedjeba, Warri, Delta State 2000 28
Warri Delta State 2000 300
Afro Kpe, Sapele Delta State 2000 55
Lagos 2000 60
Umudike, Imo State 2001 15
Ovim Abia 2003 125
Lagos 2004 60
Ilado Lagos 2004 27
Beach, Lagos 2006 200
Abule Egba Lagos 2006 200
Total 1334
Average Yearly Deaths 190.57 (191)
Source: Nwachukwu, C., Adeyemi, K., Oke, B., Adetayo, O., and Obasola, K. (2006) 700 burnt to death in Lagos. The punch, Lagos: Punch Newspapers (Nig.) Ltd. P2.
Table 3. Distribution Pipeline Incident By Cause Year 2005
Cause No. of Incidents % of Total Damages Property Damages % of Total Fatalities Injuries
Body of Pipe 2 1.8 $275,000 1.5 0 0
Vehicle not related to Excavation Activity 17 15.5 $4,285,257 23.7 0 8
Component 3 2.7 $916,056 5.1 0 0
Corrosion, External 1 0.9 $114,500 0.6 0 0
Earth Movement 2 1.8 $400,000 2.2 0 0
Fire explosion as primary cause 23 20.9 $4,862,742 26.9 0 1
Heavy Rains/floods 2 1.8 $721,115 4 0 0
Heavy Winds 1 0.9 $55,000 0.3 0 0
Incorrect Operation 1 0.9 $66,970 0.4 0 0
Joint 1 0.9 $49,000 0.3 0 1
Lightning 1 0.9 $401,100 2.2 0 0
Malfunction of control/relief of Equipment 1 0.9 $128,585 0.7 0 0
Miscellaneous 9 8.2 $1,078,237 6 0 6
Operator Excavation Damage 1 0.9 $75,000 0.4 0 1
Other 0 0 $0 0 0 0
Temperature 2 1.8 $150,000 0.8 0 0
Third Party Excavation Damage 33 30 $2,856,469 15.8 0 3
Unknown 9 8.2 $1,605,100 8.9 1 6
Vandalism 1 0.9 $70,000 0.4 2 2
2005 Total 110 100 $8,110,131 100 3 28
1/1/2005 to 9/22/2005
Average 164,638 0 0
Note:FY 2005 data continues to be updated as the reports are obtained by OPS. Comparison of Pipeline Incident Totals 2004 Total:172100$39,283,9061001841 2005 Total (9/22/2005)110100$18,110,131100328
[image:5.595.48.555.274.489.2]Gill et al. (1985:630) Summarize inventory carrying costs as:
Space costs 8.0 percnet Maintenance Costs Product Insurance 1.3 Taxes on Insurance 0.3 Physical Inventory Costs 0.1 Risk Costs
Obsolescence 2.0 Damage 0.2 Pilferage 0.1 Capital Costs Total 42.5percent
The percentage multiplied by the actual amount of stock for a given period, constitute the cost of carrying inventory for the period.
Order Processing
The activities here are the invoicing, delays in confirming and raising orders, verification of payments, picking of products, shipping, return orders, damages and replacements, and transit irregularities associated with pipeline and motion products. The order processing in physical distribution are the set of procedures for receiving, handling, and filling orders promptly and accurately, including provisions for billing, granting credit, preparing invoices, and collecting past-due accounts, (Eztel et al.., 2001:469). Thus inefficient order processing can lead to unnecessarily large inventories and customer ill will from delays and unmet orders.
Material Handling Costs
There have been great loss of man hours in labour time for manual operations in the handling of stocks and inventories in warehouses and stock yards, including damages and losses from wastes, injuries and fatigues, hand picking and counting of stock, hand stacking, the separation of packs of boxes that may require tying of ropes round the box before loading and off loading of inbound and out bound goods to various customers. At customer locations, the processes are carried out with even greater difficulties.
METHODOLOGY
The study was a survey. The population of study was some selected production firms in the south east and South South including Aba, Enugu, Onitsha and Portharcourt as the industrial hubs. Several visits were made to these firms to observe activities in the warehouses, movements of transport into and out of the production centres to various customer destinations. Data collection was by questionnaire and interview and secondary data was heavily relied upon that satisfied the qualitative and empirical nature of the study.
Discussion of Findings
The findings were very made from the various investigation sources In the firms. The nature of costs and efficiency measurements of physical distribution were not easily established, rather the costs were ascribed to the various activities of distribution. The various accidents reduced the efficiency level of distribution as many goods were regularly
lost in transit. The customer order fulfilments were often erratic and disruptive with the consequences of high product prices, black market boom and long quay at pump stations with high loss of man-hours in the distribution of petroleum products. The nature of physical distribution costs and efficiency problems could be comparable to what obtains in United States of America as in the figures 1, 2, and 3 in this study. The experience of blackout or power outage was the height of inefficiency in petroleum supplies over the years which caused the short down of the turbines and other problem areas that escalated costs. This findings agree with what Tubb
(2006:32) submits that the nation’s gas distribution system had seen number of changes over the past year. The wholesale price of natural gas rose from around $6 per Mcf in May 2005 to near $13 in early November, in large part because of the damages caused by Hurricanes Katrina and Rita that also shut
down 10% of the nation’s natural gas production and
negatively impacted the distribution of plastic pipe market. The U.S. Energy Information Administration has warned that customers who heat with natural gas can expect to pay 31 –
62% more this winter, depending on weather and other factors.
Transportation is a major driver of physical distribution with high consequences of cost accumulation and acceleration to meet the urgent needs and fast deliveries of customer orders. This can increase efficiency by reducing costs through minimisation of delays in all activities. The approaches used in measuring costs and efficiency are determinable in the efficient processing of customer orders as the key to maximisation of customer satisfaction. The current vogue in inventory management has been the elimination of bottleneck in order processing through the use of Electronic Data Processing (EDI) that requires that orders are transmitted including invoices and other bills by electronic devices rather than mail or personal physical transactions. The use of General System of Mobile (GSM) for communication has improved this devise in Nigeria against the actual establishment of Computer devices in the warehouses. Transporters also have their transport vehicles fitted with communication devices that can facilitate monitoring of movements on the high ways and at problem points. The other versions of effective and efficient order processing are the use of Just In Time (JIT) for immediate replenishment of orders or materials required for immediate production; the Market Response System (MRS) in the use of electronic devices to monitor inventory in stock and get them replenished as soon as the level is low or nil. The Efficient Consumer Response (ECR) is also an important aspect of inventory control and order processing. These are the supply chain optimisation management necessary for the improvement of materials and inventory control in physical distribution of goods. The improvements on physical distribution in marketing have been greatly made possible by the efficient handling of materials at the loading and unloading bays, handling techniques at storage points for stacking and retrieval and general movements of material in transit and within the warehouse areas.
types of loads. The containerisation for example minimise physical handling, thereby reducing damages, lessening risks of theft, and allowing for more efficient transportation and handling. Handling costs are associated with both warehouse throughput and inventory levels of stock. The established cost centres were the operational points where the physical distribution activities took place, including warehouses, transportation, inventory control, order processing and materials handling. The costs associated with these centres were both fixed and variable costs.
Conclusions
The results of the performance of specific physical distribution tasks or functions should be continuously improved as a way of improving and determining the efficiency in the performance of the functions. The use of operating profit, total costs, Economic Order Quantity (EOQ), Economic Value Added (EVA), Efficient Consumer Response (ECR), Electronic Data Interchange (EDI), Operating ratios, and Just in Time (JIT) are some of the approaches for costs and efficiency measurements currently in vogue in most organisations. These could facilitate fulfilments of customer orders and satisfaction, which can reduce or eliminate delays in delivery services through timely and prompt order processing, consistent and continuous stock availability, safe and quick transportation of products to desire destinations, good materials handling and safe storage.
Recommendations
The need for continuous monitoring of costs and efficiency measurements should be established as a physical distribution process in all organisations. The use of percentage of stock value or estimation method of assumed volume of transactions as measures for costs and efficiency measurements cannot be relied on as much losses are incurred especially with damages, costs of transportation and other handling costs, obsolescence and obsolete of products. Therefore, actual costs have to be established at the scene of incident or activities and other centres of physical distribution operations.
REFERENCES
Acker, K. B., and Landes, N. E. 1985. Warehouse Operations. In Roveson, J. F., and House, R. G. (eds). The Distribution Handbook. New York: The Free Press.
Anderson, E., and Weitz, B. A. 1986. “Make or Buy
Decisions; Vertical Integration and Marketing
Productivity,” in Bonoma, T. V., and Clark, B. H..
Marketing Performance Assessment. Boston: Harvard Business School Press.
Berkowitz, E. N. Kerin, R. A., Hartley, S. W., William, R. 2000. Marketing 6thed. Boston: Irwin McGraw Hill. Bonoma, T. V., and Clark, B. H. (1988) Marketing
Performance Assessment. Boston: Harvard Business School Press.
Bower Sox, D. J., Lamber, M. D., Taylor, D. A. 1980. Management in Marketing Channels. London: McGrawHill International Book Company.
Bucklin, L. P. 1978. Productivity in Marketing. Chicago: American Marketing Association.
Christopher, M. 1997. Marketing Logistics, Oxford:
Butterworth. Heinemann.
Dalrymple, D. J. and Parsons, L. J. 1980. Marketing Management, Text and Cases. New York: John Wiley and Sons.
Dommermuth, W. P., and Anderson C. R. 1978.“Distribution
Systems – Firms, Functions and Efficiencies”, Reprinted
From Nsu Business Topics, Published by The Graduate School of Bus. Admin Michigan State University, Vol. 17 No. 2. (Spring 1969), PP51 – 56, in Jack Taylor, Jr. and James F. Robb, Fundamentals of Marketing, Additional Dimensions; Selections from the Literature Second Edition, New Delhi: Tata McGraw Hill Publishing Company Ltd.
Donald, W. 2003. Global Logistics and Distribution Planning; strategies for management; London: Kogan Page
Donaldson, B. 1995. “Customer Care,” in Baker, M. J. (ed),
Marketing Theory and Practice, (3rd ed). London: Macmillan Press Ltd.
Ehikwe, A. E. 2002. Transportation and Distribution
Management, Enugu: Precision Publishers Ltd.
Eztel, M. J., Walker, B. J., and Stanton, W. J. 2001. Marketing. 12thed. Boston: McGraw Hill, Irwin.
Feder, R. A. 1965.“How to Measure Marketing Performance”,
Harvard Business Review, Boston: Harvard Business Press, May-June PP 132–142.
Gill, L. E., Isoma, G., and Sutherland, J. L. 1985. Inventory and Physical Distribution Management in Robeson, J. F., and House, R. G. The Distribution Handbook. London: The Free Press.
Gumdux, F., Jeyakumar, M., and Tetali, R. 2003. Inventory Positioning in the Distribution Channel, Performance Measurements and Metrics, Supply Chain Management and Information Digest for the Supply Chain Management Professional. North Carolina University. http;//tli.isye. gatech.edu/education/ips/courses/2000/ipc vm.htm.
Lalonde, B. J. 1985. “Customer Service”, in James R.
Robeson, Robert. G. House, DBA. The Distribution Handbook. London: The free Press. Collier Macmillan Publishers.
Mallen, B. 1978. Functional Spin Off: A Key to Anticipating Charge in Distribution Structure. In Brit, S. H., and Boyd, H. W. Jr. Marketing Management and Administrative Action. Tokyo: McGraw Hill Kogakusha Ltd.
Nekvasil, C. A. 1978. Standardisation Holds The Key, in J. L. Taylor Fr., James, F. Robb, Opcit.
Sevin, C. H. 1965. Marketing Productivity Analysis. New York: McGraw Hill.
Smith, C. 1970. “Distribution Planning and Research,” in
Victor P. Buell and Carl Heyel,(ed). Handbook of Modern Marketing. New York: McGraw Hill, Inc.
Stewart, W. M. 1970. “Physical Distribution – Coordinating Inventory, Warehousing, and Transportation for Optimum
Service at Lowest Cost”, in Victor P. Buell and Carl Heyel.
(Ibid).
Taff, C. A. 1965. Management of Traffic and Physical Distribution. 3rded. Homewood Illinois. Richard D. Irwin. Tubb, R. 2006. Gas Distribution Spending to Top $8.9 Billion
in 2006. Pipeline and Gas Journal. Houston, Texas: Oildom Publishing Co. p 36.
Wentz, B. W., and Eyrich, G. I. 1970. Marketing Theory and Applications, New York: Harcourt, Bruce and World, Inc.