© 2019, IRJET | Impact Factor value: 7.211 | ISO 9001:2008 Certified Journal | Page 7605
EXPERIMENTAL ANALYSIS AND TOPOLOGY OPTIMIZATION OF LOWER
SUSPENSION ARM OF CAR
Rupali Dhore
1, Prof. M.L. Thorat
21B.E.MECH. (M.E.Pursuing), Mechanical Department, RMD SINHGAD SCHOOL OF ENGINEERING, PUNE
2 ASSISTANT PROFESSOR of Mechanical Department RMD SINHGAD SCHOOL OF ENGINEERING, PUNE
---***---Abstract -
In the automotive industry, the riding comfort and handling qualities of an automobile are greatly affected by the suspension system, in which the suspended portion of the vehicle is attached to the wheels by elastic members in order to cushion the impact of road irregularities. Suspension arm is one of the main components in the suspension systems. It can be seen in various types of the suspensions like wishbone or double wishbone suspensions. Most of the times it is called as A-type control arm. It joins the wheel hub to the vehicle frame allowing for a full range of motion while maintaining proper suspension alignment.Uneven tire wear, suspension noise or misalignment, steering wheel vibrations are the main causes of the failure of the lower suspension arm. Most of the cases the failures are catastrophic in nature. Hence, it is reported that the structural integrity of the suspension arm is crucial from design point of view both in static and dynamic conditions. Finite Element Method (FEM) gives better visualization of this kind of the failures.
Suspension is the system which consists of dampers, spring and mechanical linkages that connects a vehicle to its wheels. Suspension systems have been evolved from early day’s horse-drawn carriage with simple leaf springs to modern era vehicles with complex mechanisms. Vehicle suspension system fulfils following purposes:
1) In order to maintain contact between ground and wheel it provides a vertical obedient element between un-sprung and sprung mass, by reducing the sprung mass motion.
2) To maintain proper attitude of the vehicle during various operating conditions like braking, cornering, accelerating etc.
3) To maintain road holding and steering characteristics. Overall performance of suspension system is limits on maximum suspension travel, transmissibility of forces, road holding, minimum weight and cost.
Key Words: Suspension system, Steering wheel vibrations, Topology optimization, Experimental Testing
1. INTRODUCTION
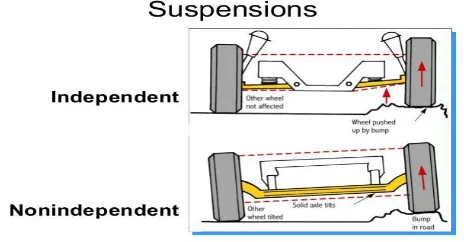
Types of Suspension System Independent Suspension System
This system means that the suspension is set-up in such a way that allows the wheel on the left and right side of the vehicle to move vertically independent up and down while driving on uneven surface. Force
acting on the single wheel does not affect the other as there is no mechanical linkage present between the two hubs of the same vehicle. In most of the vehicle it is employed in front wheels. These types of suspension usually offer better ride quality and handling due to less unsprang weight. The main advantage of independent suspension is that they require less space, they provide easier steer ability, low weight etc. Examples of Independent suspension are, Double Wishbones
MacPherson Strut
Dependent Suspension System
[image:1.595.317.549.505.626.2]In Dependent Suspension there is a rigid linkage between the two wheels of the same axle. Force acting on one wheel will affect the opposite wheel. For each motion of the wheel caused by road irregularities affects the coupled wheel as well. It is mostly employed in heavy vehicles. It can bear shocks with a great capacity than independent suspension.
Fig. 1 Types of suspension system
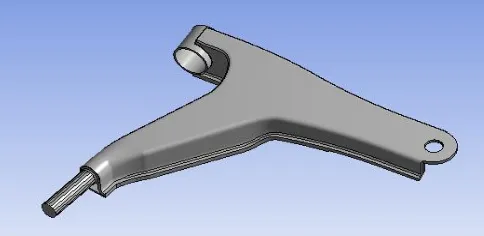
Lower Control Arm
© 2019, IRJET | Impact Factor value: 7.211 | ISO 9001:2008 Certified Journal | Page 7606 reduce friction and restrain the auto parts from going
every which way.
As a result, you are able to go on joy rides without feeling sick and dizzy, as there is control and smoothness in the movement of the car. The two bottom points of the control arms that form the letter A are attached to the frame of the vehicle while the top point is attached to the spindle. Three or four control arms are placed between the rear axle housing and the frame if you have coil springs in both the front and rear suspensions.
[image:2.595.313.555.617.735.2]Like other body parts, the control arms should also be lubricated at every oil inspection. Handling and steering could become erratic if the control arms are malfunctioning and the unsteady movements of your car could take away your riding comfort.
Fig. 2 Lower Control Arm
2. OBJECTIVES
1. To determine the problem associated due to vibration on lower control.
2. Modelling and analysis of lower control arm for static and modal analysis.
3. To perform topology optimization for weight reduction.
4. To perform static and modal analysis of optimized lower control arm.
5. To compare the relation between modal analysis results of existing and optimized lower control arm. 6. The FEA results obtained are validated with experimental results.0
3. PROBLEM STATEMENT
During running condition lower control arm subjected to loads due to variation in gross weight and impact loads due to fluctuation of road surface and due to vibration. Because of this complex nature of loads, the chances of bending and hence failing of lower control arm takes place, hence it is necessary to carry out static and modal analysis of lower control arm.
Design and development of lower control arm is done using FEA and experimental modal analysis.
4. METHODOLOGY
1. A solid model of lower control arm is done as per the dimensions provided by company.
2. The CAD model of lower control is imported in ANSYS Workbench software. Analysis will be done for static. The total deformation and stress
distribution on lower control arm will be evaluated in the analysis.
3. Modal analysis of base model is carried out using ANSYS software.
4. Topology optimization technique is used for weight reduction. This optimization is done using ANSYS.
5. Static analysis of optimized lower control arm is done to check whether it is under the designed criteria.
6. Modal analysis is done to determine the natural frequencies and mode shapes of optimized part. Modal analysis is done using ANSYS.
7. Experimental analysis of optimized lower control arm is done. Modal analysis of optimized lower control arm is done using FFT analyzer. 8. The experimental results are compared with analysis results.
5. ANALYSIS
It is a numerical technique for finding approximate solutions to boundary value problems for partial differential equations. It is also referred to as finite element analysis (FEA). FEM subdivides a large problem into smaller, simpler, parts, called finite elements. The simple equations that model these finite elements are then assembled into a larger system of equations that models the entire problem. FEM then uses variational methods from the calculus of variations to approximate a solution by minimizing an associated error function.
© 2019, IRJET | Impact Factor value: 7.211 | ISO 9001:2008 Certified Journal | Page 7607 The meshing method used is patch conforming second
order tetra element. Tetra elements are solid elements which have been extracted from 2D tri elements. This type of meshing is used as it consists of additional mid nodes due to which the deformation can be captured more accurately. The node population count is 154821 and element population count is 80483
Fig. 4 Meshing of Lower Control Arm
Difference between the element formations of two meshes is shown in the Fig.5. As can be seen, second order element consists of additional mid nodes due to which the deformation can be captured more accurately. Therefore, using them most of the time will lead to better results with even a smaller number of nodes compared to first order mesh. Easy and accurate deformation of second order elements also proves there less stiff nature.
(a)First order tetrahedral mesh (b)Second order tetrahedral mesh Fig.5 Mesh Models with Circular Cutout
Boundary Condition
After carrying out meshing of lower control arms the boundary conditions are applied to it. The same boundary condition is applied as that is experienced by the physical lower arm. The force that is calculated is applied on the part which is connected to spring. In actual structure the ball joint is connected to the
steering knuckle. The steering knuckle is connected to wheel/tire envelop. The handling bushing and ride bushing is the connected to sub frame of the chassis.
The ball joint, handling bushing and ride bush are given fixed constraints. The fixed constraints are shown in the figure are blue in colour. The force applied is 3000N which is shown in red colour.
Fig.6 Boundary Condition
Total Deformation
The deformation goes on increasing as the stress in the model increases. The maximum deformation is 0.22545 mm observed at the maximum stress in Fig 7. The deformation is maximum at the point that is connected to unsprung mass through spring. As the force applied on the lower control arm is maximum at point which is connected to the spring maximum deformation is obtained at that point.
Fig.7. Deformation in Lower Control Arm
© 2019, IRJET | Impact Factor value: 7.211 | ISO 9001:2008 Certified Journal | Page 7608 stress and gives a good indication of margins over
[image:4.595.312.558.173.316.2]potential response. Apart from these stresses are high at the region which is connected to chassis of car. These locations are the critical locations and can cause mechanical failure of lower control arm. The maximum stress obtained is 223.57 MPa. This is the part where the maximum load acts. As this part is connected to the spring more stresses are obtained at that point
Fig.8 Von-Mises Stress Distribution in Lower Control Arm
Optimization
Now a day’s weight reduction by is one of the main concerns. Weight reduction can be achieved by using optimization. It can be performed manually or through automated.
It fulfils one of the basic needs of the designer i.e. to quickly improve the design. A variety of optimization tools have been available in finite element analysis software. Optimization is finding the best. The process of determining the best design is called optimization. Optimization refers to the process of generating improved designs. An optimizer is really nothing more than a formal plan, or algorithm, that is used to search for a “best” design. A basic goal of optimization is to automate the design process by using a rational, mathematical approach to yield improved designs.
Topology Optimization is different from shape optimization because shape optimization methods work in a range of allowable shapes which have fixed topological properties. Topology optimization generates the optimal shape of a mechanical structure. Given a predefined domain in the 2D/3D space with boundary conditions and external loads, the intention is to distribute a percentage of the initial mass on the
[image:4.595.40.283.244.376.2]given domain such that a global measure takes a minimum. So, the optimization constraint is the volume of the material. Integration of the selection field over the volume can be done to obtain the total utilized material volume.
Fig. 9 CATIA model of optimized lower control arm
The original mass of the lower control arm was 2.604 Kg. As mass was the main constraint of optimization, it was necessary to reduce the weight. Topology optimization was carried out with which the weight reduced to 2.203 Kg. Thus almost 400 gm. of weight of lower control arm was removed.
Meshing of optimized lower control arm
The second order tetra element type is used for meshing as it consists of additional mid nodes due to which the deformation can be captured more
accurately. The node and element count is 51288 and count 6965 respectively. Easy and accurate
deformation of second order elements also proves there less stiff nature. The meshed model of lower control arm is shown in Fig. below.
[image:4.595.312.555.624.733.2]© 2019, IRJET | Impact Factor value: 7.211 | ISO 9001:2008 Certified Journal | Page 7609
Deformation of optimized lower control arm:
The static analysis of optimized lower control arm is done. The plot of total deformation shows that the total deformation is 0.20941 mm. The deformation is maximum at the point that is connected to spring to chassis frame.
Fig.11Deformation in optimized lower control arm
Von-Mises Stress in Optimized Lower Control Arm
Below fig. shows the von Mises stress distribution in the optimized lower control arm component. We see that there are two regions of high stress. The maximum stress obtained is 240.59 MPa. The maximum von-Mises stress is found at the part which is connected to the spring to chassis frame.
Fig.12 Von mises stress of lower control arm
The plots of stress and deformation of existing and lower control arm are obtained. The plots of optimized arm show that due to removal of material the stress is induced in it. These stresses are more than the stresses induced in existing lower control due to optimization.
From above the analysis, the comparison of stress, deformation and weight for existing and optimized lower control arm. From the table the variation in stresses induced in existing lower control arm 7.61 % greater than existing lower control arm. After topology optimization the weight of existing lower control arm reduced by 15.40%.
6. CONCLUSION
The 240.59 MPa is generated in optimized lower control arm from static structural analysis which is less than the yield strength of the base material.
The weight of lower control arm is reduced by 15.39% using topology optimization technique. Thus, topology optimization technique is easy for weight reduction.
The results obtained from modal analysis of existing lower control arm and optimized lower control arm show that the frequency increases as the mass of arm decreases. Hence it is concluded that the change in mass affects the natural frequency of component.
REFERENCES
1.Prof. Amol B. Gaikwad, “Design Optimization of a Lower Control Arm of Suspension System in a LCV by using Topological Approach” International Journal of Innovative Research in Science, Engineering and Technology, Vol. 6, Issue 6, June 2017, PP 2347-6710. 2. Gururaj Dhanu, “COMPARISION STUDY OF LOWER CONTROL ARM WITH DIFFERENT MATERIAL” International Research Journal of Engineering and Technology, Volume: 03, Issue: 10, Oct -2016, PP 2395-0072.
3. S. Arjun Kumar, “ANALYSIS AND OPTIMIZATION OF LOWER CONTROL ARM IN FRONT SUSPENSION SYSTEM “,Int. J. Chem. Sci., Vol. 14, 2016, PP1092-1098. 4. S. C. Shilwant, “Finite Element Analysis and Topography Optimization of Lower Arm of Double Wishbone Suspension Using Abacus and Optistruct”, Journal of Engineering Research and Applications, Vol. 4, Issue 7, July 2014, pp.112-117.
5. Hardial Singh, “Finite Element Analysis of a Front Lower Control Arm of LCV Using Radioss Linear”, Research gate, April 2012, PP 121-125.