Please cite this paper as:
Schaer, O., Kourentzes, N. and Fildes, R. 2018. Demand forecasting with user-generated online
information. Lancaster University Management School, Management Science Working Paper
2018:2, 1-41.
Managmeent Science
Working Paper 2018:2
Online supplement: Demand forecasting
with user-generated online information
Oliver Schaer, Nikolaos Kourentzes and Robert Fildes
The Department of Management Science
Lancaster University Management School
Lancaster LA1 4YX
UK
© Oliver Schaer, Nikolaos Kourentzes and Robert Fildes
All rights reserved. Short sections of text, not to exceed
two paragraphs, may be quoted without explicit permission,
Online supplement: Demand forecasting with user-generated online
information
Oliver Schaer
a,∗, Nikolaos Kourentzes
a, Robert Fildes
aaDepartment of Management Science, Lancaster University Management School, UK
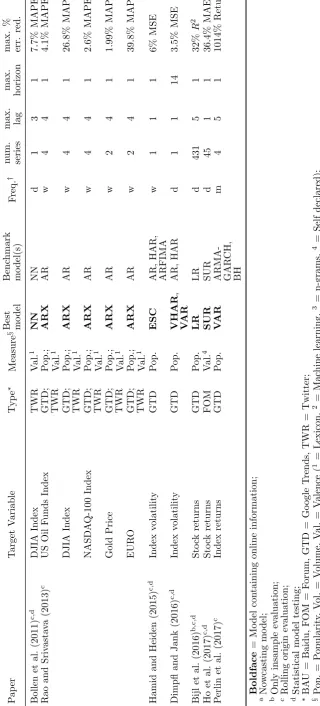
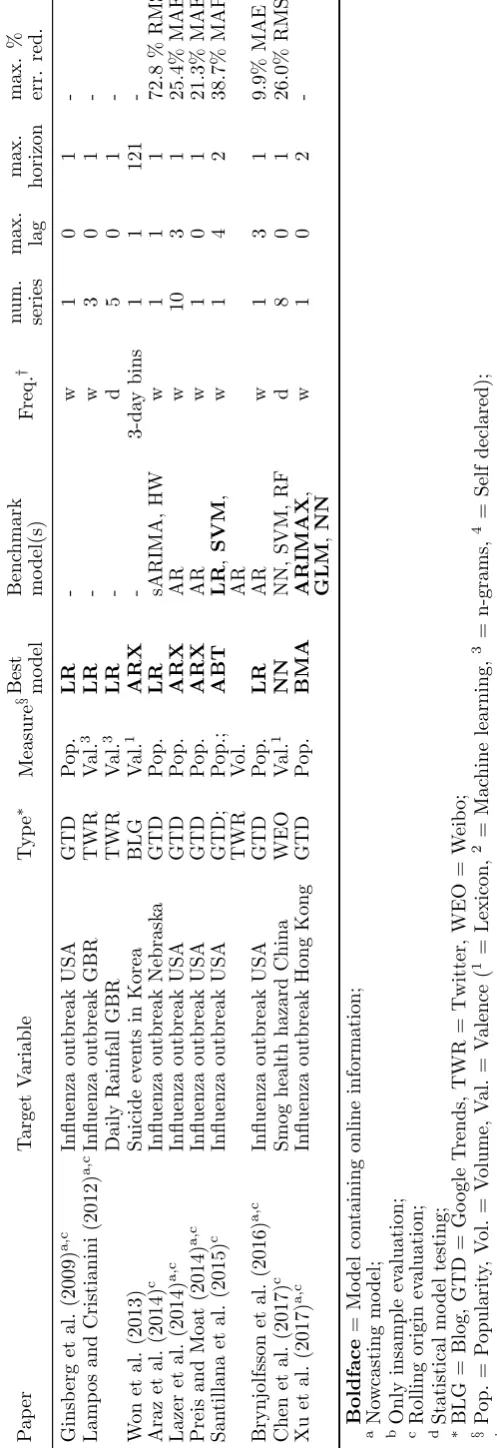
A. Supporting tables for the literature review
The following Tables A1 to A5 provide detailed insights on the literature surveyed for each of the
forecasting applications used in Section 2. For each reviewed study we list the
target variable
, data
source
, identified
best model
and
benchmarks
used. Studies with distinct datasets have been split
into multiple lines. The column
type
names the internet platform and the column
measure
indicates
the nature of the data, e.g. volume or sentiment information. We also report the data
frequency
,
number of
series
,
maximum lag
the user generated information variable is incorporated and
forecast
horizon
. The last column reports the relative
maximum error reduction
achieved, compared to the
best performing benchmark without any. All forecasting model abbreviations are listed in Table A6.
∗Correspondance: O Schaer, Department of Management Science, Lancaster University Management School,
Lan-caster, Lancashire, LA1 4YX, UK. Tel.: +44 1524 592911
Email addresses: [email protected] (Oliver Schaer),[email protected](Nikolaos
T able A1: F orecasting e conomic indicators P ap er T arget V ariable T yp e ∗ Measure § Best Benc hmark F req. † n um. max. max. max. % mo del mo del(s) series lag horizon err. red. Choi and V arian (2009) a,c Home sal e s USA GTD P op. ARX AR m 1 0 1 12% MAE Retail sales USA GTD P op. sARX sAR m 1 0 1 18% MAE V osen and Sc h m idt (2011) c,d Priv ate consumption USA GTD P op. ARX AR, ARX m 1 3 1 76% RMSE Choi and V arian (2012) a,c Motor v ehicles and parts US A GTD P op. sARX sAR m 1 0 1 10.5% MAE Unemplo ymen t b enefits claims USA GTD P op. AR ARX w 1 0 1 AR b etter Consumer confidence Index A US GTD P op. ARX AR m 1 0 1 9.3% MAE Barreira et al. (2013) a Unemplo ymen t rate (v ar. coun tries) GTD P op. ARX AR m 4 2 36 13.4% RMSE Scott and V arian (2015) a,b,c,d Consumer se n timen t USA GTD P op . BSTS AR, LR m 1 0 1 13.5% MAPE Gun sales USA GTD P op. BSTS BSTS m 1 0 1 55.9% MAE W u and Brynjolfsson (2015) a,c,d Home sales USA GT D P op. ARX ARX q 1 1 1 2.9% MAE Home price index USA GTD P op. ARX ARX q 1 1 1 7.1% MAE Brynjolfsson et al. (2016) a,c Unemplo ymen t b e n e fi ts claims USA GTD P op. ARX AR w 1 0 1 3.9% MAE Li (2016) a,c Unemplo ymen t b e n e fi ts claims USA GTD P op. DFM AR, DFM, R W w 1 2 2 0.04% RMSE Limnios and Y ou (2016) c Home prices USA GTD P op. D W ARX , ARX, D W m 1 6 1 D W b etter Price-ren t ratio USA GTD P op. IA C ARX , ARX, IA C m 1 6 1 IA C b etter Smith (2016) a,c,d Unemplo ymen t rate GBR GTD P op. AR- MID AS R W w. drift, Surv ey m/w 1 1 1 11% RMSE D’Am uri and Marcucci (2017) c,d Unemplo ymen t rate USA G TD P op. ARX AR, ARX, SET AR, LST AR, AAR m 1 4 12 39% RMSE Bulut (2017) a,c,d Exc hange rate mo v emen ts GTD P op. R W LRX , LRX m 11 0 1 R W b etter Elshendy et al. (2017) c Crude oil pr ic e
GTD; TWR; GDEL
[image:3.595.78.509.63.776.2]T
able
A2:
F
orecasting
financial
mark
ets
P
ap
er
T
arget
V
ariable
T
yp
e
∗
Measure
§
Best
Benc
hmark
F
req.
†
n
um.
max.
max.
max.
%
mo
del
m
o
del(s)
series
lag
horizon
err.
red.
Bollen
et
al.
(2011)
c,d
DJIA
Index
TWR
V
al.
1
NN
NN
d
1
3
1
7.7%
MAPE
Rao
and
Sriv
asta
v
a
(2013)
c
US
Oil
F
unds
Index
GTD; TWR
P
op.;
V
al.
1
ARX
AR
w
4
4
1
4.1%
MAPE
DJIA
Index
GTD; TWR
P
op.;
V
al.
1
ARX
AR
w
4
4
1
26.8%
MAPE
NASD
A
Q-100
Index
GTD; TWR
P
op.;
V
al.
1
ARX
AR
w
4
4
1
2.6%
MAPE
Gold
Price
GTD; TWR
P
op.;
V
al.
1
ARX
AR
w
2
4
1
1.99%
MAPE
EUR
O
GTD; TWR
P
op.;
V
al.
1
ARX
AR
w
2
4
1
39.8%
MAPE
Hamid
and
Heiden
(2015)
c,d
Index
v
o
latilit
y
GTD
P
op.
ESC
AR,
HAR,
ARFIMA
w
1
1
1
6%
MSE
Dimpfl
and
Jank
(2016)
c,d
Index
v
o
latilit
y
GTD
P
op.
VHAR
,
V
AR
AR,
HAR
d
1
1
14
3.5%
MSE
Bijl
et
al.
(2016)
b,c,d
Sto
ck
returns
GTD
P
op.
LR
LR
d
431
5
1
32%
R
2
Ho
et
al.
(2017)
c,d
Sto
ck
returns
F
OM
V
al.
4
SUR
SUR
d
45
1
1
36.4%
MAE
P
erlin
e
t
al.
(2017)
c
Index
returns
GTD
P
op.
V
AR
ARMA- GAR
CH,
BH
m
4
5
1
1014%
Return
Boldface
=
Mo
del
con
tainin
g
online
information;
a No
w
c
astin
g
mo
del;
b Only
insample
ev
aluation;
c Rolling
origin
e
v
aluation;
d Statistical
mo
del
tes
ti
ng;
∗ BA
U
=
Baidu,
F
OM
=
F
orum,
GTD
=
Go
ogle
T
rends,
TWR
=
Twitter;
§ P
op.
=
P
opularit
y
,
V
ol.
=
V
olume,
V
al.
=
V
alence
(
1
=
Lexicon,
2
=
Mac
h
ine
learning,
3
=
n-grams,
4
=
Self
declared);
† d
=
daily,
w
=
w
eekly,
m
=
mon
thly,
q
=
[image:4.595.146.467.66.774.2]T
able
A3:
F
orecasting
public
health
and
en
vironmen
t
P
ap
er
T
arget
V
ariable
T
yp
e
∗
Measure
§
Best
Benc
hmark
F
req.
†
n
um.
max.
max.
max.
%
mo
del
m
o
del(s)
series
lag
horizon
err.
red.
Ginsb
erg
et
al
.
(2009)
a,c
Influenza
outbreak
US
A
GTD
P
op.
LR
-w
1
0
1
-Lamp
os
and
Cristianini
(2012)
a,c
Influenza
outbreak
GBR
TWR
V
al.
3
LR
-w
3
0
1
-Daily
Rainfall
G
BR
TWR
V
al.
3
LR
-d
5
0
1
-W
on
et
al.
(2013)
Suicide
ev
en
ts
in
Korea
BLG
V
al.
1
ARX
-3-da
y
bins
1
1
121
-Araz
et
al.
(2014)
c
Influenza
outbreak
Nebrask
a
GTD
P
op.
LR
sARIMA,
HW
w
1
1
1
72.8
%
RMSE
Lazer
et
al.
(2014)
a,c
Influenza
outbreak
US
A
GTD
P
op.
ARX
AR
w
10
3
1
25.4%
MAE
Preis
and
Moat
(2014)
a,c
Influenza
outbreak
US
A
GTD
P
op.
ARX
AR
w
1
0
1
21.3%
MAE
San
tillana
et
al.
(2015)
c
Influenza
outbreak
US
A
GTD; TWR
P
op.;
V
ol.
ABT
LR
,
SVM
,
AR
w
1
4
2
38.7%
MAPE
Brynjolfsson
et
al.
(2016)
a,c
Influenza
outbreak
US
A
GTD
P
op.
LR
AR
w
1
3
1
9.9%
MAE
Chen
et
al.
(2017)
c
Smog
health
hazard
China
WEO
V
al.
1
NN
NN,
SVM,
RF
d
8
0
1
26.0%
RMSE
Xu
et
al.
(2017)
a,c
Influenza
outbreak
Hong
Kong
GTD
P
op.
BMA
ARIMAX
,
GLM
,
NN
w
1
0
2
-Boldface
=
Mo
del
con
tainin
g
online
information;
a
No
w
ca
stin
g
mo
del;
b
Only
insample
ev
aluation;
c
Rolling
origin
e
v
aluation;
d
Statistical
mo
del
tes
ting;
∗ BLG
=
Blog,
GTD
=
Go
ogle
T
rends,
TWR
=
Twitter,
WEO
=
W
eib
o;
§ P
op.
=
P
opularit
y
,
V
ol.
=
V
olume,
V
al.
=
V
alence
(
1
=
Lexicon,
2
=
Mac
h
ine
learning,
3
=
n-grams,
4
=
Self
declared);
† d
=
daily,
w
=
w
eekly.
[image:5.595.184.433.57.782.2]T able A5: F orecasting consume r go o ds P ap er T arget V ariable T yp e ∗ Measure § Best Benc hmark F req. † n um. max. max. max. % mo del mo del(s) series lag horizon err. red. Brand or compan y lev el Choi and V arian (2009) a,c Car sales USA GTD P op. sARX sAR m 27 0 1 12.5% MAE Seebac h et al. (2011) c Car sales DEU GT D P op. ARX AR, R W m 2 6 3 50.3% MAE Barreira et al. (2013) a,c,d Car sales v ar. coun tries GTD P op. ARX AR m 4 0 36 8.2% RMSE Carri `ere-Sw allo w and Labb ´e (2013) a,c,d Car sales CHL GTD P o p . ARX AR, ARMA m 9 18d 1 -Sk o dda and Be n thaus (2015) c Car sales DEU GT D; TWR P op.; V al.tnote1 LR LR m 2 6 1 -F an tazzini and T oktam yso v a (2015) c,d Car sales DEU GT D P op. VECM , V AR , BV AR R W w. drift, AR, V ARX, VECMX, BV ARX, LST AR, EST AR, AAR m 22 12 24 66% MSE Cui et al. (2017) c,d Online apparel sales FBK V ol.; V al. 2 RF RF, LR, SVM, GB, Compan y F orecast d 1 7 7 20.5% MAPE Jun et al. (2017) Netb o ok sales GTD; NAR P op.; P op. HW Analogy , sR W, MA q 1 0 1 HW b etter Gev a et al. (2017) c,d Car sales USA
GTD; FOM
P op.; V ol.; V al. 1 NN sARX, NN m 23 2 1 5.6% MAPE Pro duct lev el Bo one et al . (2015) a,b Sp ecialit y-fo o d SKUs sales GT D P op. ARX ARX w 2 0 -5.3% RMSE Sc hneider and Gupta (2016) c T ablet sales OR W
Rat.; Val.
2 LR SVM , LR w 231 0 1 77.2% MAPE See-T o and Ngai (2016) a,c F ashion sales OR W V al. 1 ARX MA
1 d2
2527 0 1 44.2% RMSE Gev a et al. (2017) c,d Car sales USA
GTD; FOM
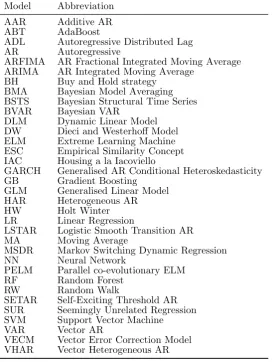
Table A6: Abbreviations of forecasting models
Model Abbreviation
AAR Additive AR
ABT AdaBoost
ADL Autoregressive Distributed Lag
AR Autoregressive
ARFIMA AR Fractional Integrated Moving Average
ARIMA AR Integrated Moving Average
BH Buy and Hold strategy
BMA Bayesian Model Averaging
BSTS Bayesian Structural Time Series
BVAR Bayesian VAR
DLM Dynamic Linear Model
DW Dieci and Westerhoff Model
ELM Extreme Learning Machine
ESC Empirical Similarity Concept
IAC Housing a la Iacoviello
GARCH Generalised AR Conditional Heteroskedasticity
GB Gradient Boosting
GLM Generalised Linear Model
HAR Heterogeneous AR
HW Holt Winter
LR Linear Regression
LSTAR Logistic Smooth Transition AR
MA Moving Average
MSDR Markov Switching Dynamic Regression
NN Neural Network
PELM Parallel co-evolutionary ELM
RF Random Forest
RW Random Walk
SETAR Self-Exciting Threshold AR
SUR Seemingly Unrelated Regression
SVM Support Vector Machine
VAR Vector AR
VECM Vector Error Correction Model