Notch signaling suppresses glucose
metabolism in mesenchymal progenitors to
restrict osteoblast differentiation
Seung-Yon Lee, Fanxin Long
J Clin Invest.
2018;
128(12)
:5573-5586.
https://doi.org/10.1172/JCI96221
.
Graphical abstract
Research Article
Bone biology
Find the latest version:
The Journal of Clinical Investigation
R E S E A R C H A R T I C L EIntroduction
Notch signaling between neighboring cells critically controls cell fate decisions in all metazoans (1, 2). In mammalian cells, engage-ment of the Notch receptors (Notch1–4) by the ligands (Jagged1 and -2 and Delta-like 1, -3, and -4) triggers sequential proteolysis of the receptors, which culminates in intramembranous cleavages by the γ-secretase complex and results in release of the Notch intracellular domain (NICD) (3–5). In the best-studied “canon-ical” mechanism, NICD released from the plasma membrane translocates to the nucleus, where it interacts with the transcrip-tion factor RBPjk and a mastermind-like transcriptranscrip-tional coacti-vator (Maml1–3) to activate the transcription of target genes (6). Among the best known targets of Notch signaling are the Hes/ Hey family of basic helix-loop-helix (bHLH) transcription repres-sors (7). However, the regulation of individual Hes/Hey proteins by Notch and their role in mediating Notch function are highly dependent on cell context.
Mouse genetic studies have uncovered important functions for Notch signaling in bone. Genetic deletion of either the γ -secre-tase catalytic subunits presenilin 1 and -2, or Notch1 and -2 in the embryonic limb mesenchyme results in excessive osteoblast dif-ferentiation at the expense of bone marrow mesenchymal progen-itors (8). More recently, specific deletion of Notch2 in early-stage osteoblast lineage cells with Runx2-Cre increased trabecular bone
mass in a site-specific manner (9). In addition, Jagged1 appears to be a major ligand in the maintenance of the osteoprogenitor pool (10). Consistent with the negative role of Notch in osteoblast dif-ferentiation, forced expression of NICD in osteoblastic precursors reduced osteoblast numbers and caused osteopenia (11). Intrigu-ingly, forced expression of NICD at a later stage of the osteoblast lineage led to sclerosis owing to excessive proliferation of the immature osteoblasts, highlighting stage-specific functions of constitutive Notch activation in the osteoblast lineage (12). Abnor-mal Notch activation in mesenchyAbnor-mal progenitors has also been implicated in decreased osteoblast differentiation associated with rheumatoid arthritis (13). In keeping with the mouse studies, Notch1 haploinsufficiency in humans causes ectopic osteoblast differentiation and calcification in the aortic valves (14, 15), where-as Notch2 stabilizing mutations are responsible for Hadju-Cheney syndrome (HCS), a disorder of severe and progressive bone loss (16, 17). Mice carrying an HCS mutation knockin allele through the germ line developed severe osteopenia due to increased bone resorption (18). More recently, a mouse strain expressing a condi-tional Notch2-knockin allele lacking the PEST degradation signal was created, and activation of the allele specifically in osteoblasts resulted in osteopenia due to increased Rankl expression, which promotes osteoclastogenesis (19). In all cases, however, the mech-anisms through which Notch signaling inhibits osteoblast differ-entiation from the progenitors have not been fully elucidated.
Recent studies have implicated the rewiring of cellular metabolism in osteoblast differentiation. In particular, Wnt/ Lrp5 signaling, which promotes bone formation in both mice and humans, has been shown to stimulate aerobic glycolysis and glutamine catabolism as well as fatty acid oxidation during
Notch signaling critically controls cell fate decisions in mammals, both during embryogenesis and in adults. In the skeleton, Notch suppresses osteoblast differentiation and sustains bone marrow mesenchymal progenitors during postnatal life. Stabilizing mutations of Notch2 cause Hajdu-Cheney syndrome, which is characterized by early-onset osteoporosis in humans, but the mechanism whereby Notch inhibits bone accretion is not fully understood. Here, we report that activation of Notch signaling by either Jagged1 or the Notch2 intracellular domain suppresses glucose metabolism and osteoblast differentiation in primary cultures of bone marrow mesenchymal progenitors. Importantly, deletion of Notch2 in the limb mesenchyme increases both glycolysis and bone formation in the long bones of postnatal mice, whereas pharmacological reduction of glycolysis abrogates excessive bone formation. Mechanistically, Notch reduces the expression of glycolytic and mitochondrial complex I genes, resulting in a decrease in mitochondrial respiration, superoxide production, and AMPK activity. Forced activation of AMPK restores glycolysis in the face of Notch signaling. Thus, suppression of glucose metabolism contributes to the mechanism, whereby Notch restricts osteoblastogenesis from bone marrow mesenchymal progenitors.
Notch signaling suppresses glucose metabolism
in mesenchymal progenitors to restrict
osteoblast differentiation
Seung-Yon Lee1 and Fanxin Long1,2
1Department of Orthopaedic Surgery, and 2Department of Developmental Biology, Washington University School of Medicine, St. Louis, Missouri, USA.
Conflict of interest: The authors have declared that no conflict of interest exists.
License: Copyright 2018, American Society for Clinical Investigation.
Submitted: July 11, 2017; Accepted: October 2, 2018.
Reference information: J Clin Invest. 2018;128(12):5573–5586.
pressing metabolism through the TCA cycle (27). However, in the mouse, Notch signaling has been shown to suppress glycolysis in endothelial cells (28). Notch activation was also linked with the increase in both glycolysis and mitochondrial oxidative phos-phorylation in murine proinflammatory macrophages (29). Thus, it is likely that Notch controls cellular metabolism in a context- dependent manner. A potential role for the metabolic regulation of Notch in bone has yet to be explored.
Here, we report that Notch signaling diminished glycolysis along with suppression of osteoblast differentiation in bone mar-row mesenchymal progenitors. Deletion of Notch2 concurrently increased glycolysis and osteoblast numbers in the mouse. Pharma-cological reduction of the glycolytic flux abrogated excessive bone formation in Notch2-deficient mice. Thus, Notch signaling impedes bone formation in part through suppression of glucose metabolism. osteoblastogenesis (20–22). In addition, teriparatide, a fragment
(amino acids 1–34) of human parathyroid hormone (PTH) and an FDA-approved bone anabolic drug, enhances aerobic glycolysis via the induction of insulin-like factor (Igf) signaling (23). Runx2, a critical transcription factor for osteoblast differentiation, appears to engage Glut1, the major glucose transporter in osteo-genic cells, in a feed-forward regulation to control osteoblast dif-ferentiation and bone formation in the mouse (24). Interestingly, Notch signaling has been shown to affect cellular metabolism in other systems. Both hyper- and hypoactivation of Notch induced a glycolytic phenotype in breast cancer cells through distinct mechanisms (25). Forced expression of NICD1 in a cell culture model altered the mitochondrial proteome involved in oxidative phosphorylation, glutamine catabolism, and fatty acid oxidation (26). In Drosophila cells, Notch stimulated glycolysis while
[image:3.585.59.524.57.422.2]The Journal of Clinical Investigation
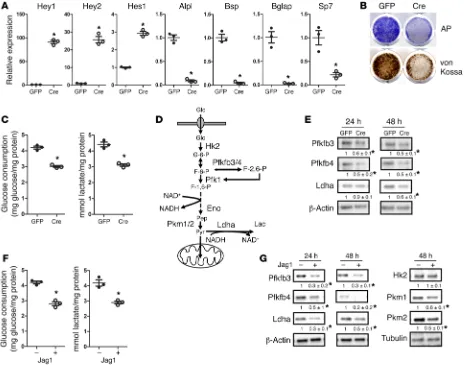
R E S E A R C H A R T I C L EHey1, Hey2, and Hes1, but markedly suppressed expression of the osteoblast markers Alpl, Bsp, Bglap, and Sp7 in BMSCs (Figure 1A). After 4 days or 2 weeks of differentiation, the Ad-Cre–infected cells showed less alkaline phosphatase (AP) or von Kossa staining, respectively, than did the control cells (Figure 1B). Thus, sustained Notch2 signaling suppresses osteoblast differentiation from bone marrow mesenchymal progenitors.
In light of recent evidence implicating glucose metabo-lism in osteoblast differentiation, we investigated the effect of Notch2 activation on glycolysis. When BMSCs from R26-NICD2 mice were infected with Ad-Cre or Ad-GFP, those infected with Ad-Cre consumed less glucose and secreted less lactate after 48 hours (Figure 1C). To assess the biochemical basis for the glyco-lytic suppression, we examined the abundance of several enzymes controlling key steps of glycolysis (Figure 1D). Among those, Pfk-fb3 and Pfkfb4 increase the amount of fructose-2,6-bisphosphate (F-2,6-P) that stimulates the activity of phosphofructokinase Pfk1,
Results
[image:4.585.52.535.57.439.2]Notch signaling suppresses glycolysis in bone marrow mesenchymal progenitors. HCS is caused by abnormal stabilization of the Notch2 ICD (NICD2) following activation of the Notch2 receptor. The increased half-life of NICD2 probably leads to elevated NICD2 lev-els and a prolonged Notch response in the cell. To model this aspect of HCS, we overexpressed NICD2 in primary cultures of bone mar-row stromal cells (BMSCs). Specifically, we used the R26-NICD2 mouse, which was genetically engineered to express NICD2 from the ubiquitously active Rosa26 locus upon Cre recombination (30). Briefly, BMSCs were cultured from young adult mice harboring the R26-NICD2 allele and infected with adenovirus expressing either Cre (Ad-Cre) or GFP as a control (Ad-GFP). As BMSCs contain mesenchymal progenitors with the potential to become blasts, we assessed the effect of NICD2 overexpression on osteo-blastogenesis in response to ascorbic acid and β-glycerophosphate. After 48 hours of treatment, NICD2 induced the Notch target genes
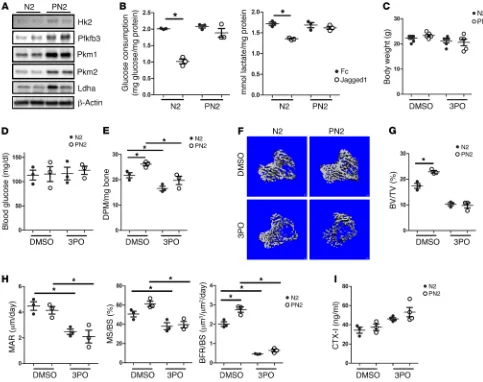
Figure 2. Suppression of glycolysis abolishes excessive bone formation caused by Notch2 deletion. (A) Western blots of long bones from 8-week-old Prx1-Cre Notch2fl/fl (PN2) mice and Notch2fl/fl (N2) littermates. Each lane is for a separate mouse. (B) Glucose consumption and lactate production in N2
and PN2 BMSCs with or without Jagged1 treatment for 48 hours. n = 3. (C–I) Analyses of 7-week-old N2 or PN2 mice that received 3PO or DMSO for 4 weeks starting at 3 weeks of age, including body weight (C), blood glucose (D), 14C-2DG uptake in bone (E), μCT images (F), μCT quantification (G), and dynamic
lated in the bones of PN2 mice, consistent with reduced Notch signaling (31) (Supplemental Figure 1). Western blotting revealed a notable increase in Pfkfb3, Pkm1, Pkm2, and Ldha in the bone protein extracts of PN2 versus their N2 littermates (Figure 2A). To confirm that Notch2 was a major receptor in suppressing glycolysis, we evaluated the effect of Jagged1 on glycolysis in BMSCs from N2 versus those from PN2 mice. While the N2 BMSCs showed an obvious decrease in glucose consumption and lactate secretion in response to Jagged1, the PN2 BMSCs showed no such response (Figure 2B). Thus, Notch2 is a major receptor for mediating the suppression of both bone formation and glycolysis in bone cells.
We next assessed whether increased glycolysis contributes to the excessive bone formation caused by Notch2 deletion. The small molecule 3PO is a cell-permeable inhibitor of Pfkfb3, which normally produces 2,6-bisphosphofructose, a potent activator of glycolysis (32). We found that treatment of mice with 3PO for 1 month did not significantly change their body weights or cause any obvious distress to the mice (Figure 2C). Treatment with 3PO also did not impair glucose homeostasis, as indicated by the normal fasting blood glucose levels in the mice (Figure 2D). To monitor the potential effect of Notch2 deletion or 3PO on glucose metabolism in bone, we performed glucose uptake assays in vivo by injecting
14C-labeled 2-deoxyglucose (2-DG). The results showed a clear
increase in 2-DG uptake in the bones of PN2 mice compared with uptake in N2 mice under the control conditions (DMSO injection). Moreover, the month-long 3PO treatment significantly reduced 2-DG uptake in the bones of both PN2 and N2 mice (Figure 2E). Importantly, 3PO significantly reduced the cancellous bone mass in both N2 and PN2 mice (Figure 2F). As a result, 3PO completely abolished the high-bone-mass phenotype in PN2 mice and ren-dered the cancellous bone mass indistinguishable between the 2 genotypes (Figure 2G and Table 1). 3PO also reduced cortical bone volume without affecting tissue volume in both N2 and PN2 mice (Table 2). Dynamic histomorphometry revealed that 3PO reduced both the mineral apposite rate (MAR) and the mineralizing surface over bone surface (MS/BS) percentage, regardless of genotype, thereby completely eliminating the significant increase in bone for-mation rate over bone surface (BFR/BS) caused by Notch2 deletion whereas Ldha helps to sustain glycolysis by regenerating NAD+,
while converting pyruvate to lactate. Infection of the BMSCs with Ad-Cre notably reduced Pfkfb3 and Pfkfb4 after 24 or 48 hours and also decreased Ldha levels after 48 hours (Figure 1E). Thus, Notch2 activation concurrently suppresses glycolysis and osteo-blast differentiation in bone marrow mesenchymal progenitors.
To corroborate the metabolic regulation by Notch signaling, we activated the pathway in WT BMSCs with recombinant Jag-ged1 immobilized on the culture dish. After 48 hours of culture, we found that Jagged1 suppressed glucose consumption and lac-tate secretion when compared with the control Fc (Figure 1F). Biochemically, Jagged1 reduced the abundance of Pfkfb3, Pfkfb4, and Ldha after 24 or 48 hours of culture (Figure 1G). In addition, after 48 hours, Jagged1 suppressed the pyruvate kinases Pkm1 and Pkm2 that control the last step of glycolysis, without affecting the hexokinase Hk2 (Figure 1G). Thus, as with Notch2 overexpression, Notch activation by Jagged1 suppresses glycolysis in bone marrow mesenchymal progenitors.
Suppression of glycolysis abolishes the excessive bone forma-tion caused by Notch2 deleforma-tion. We next tested the contribuforma-tion of glycolysis to the effect of Notch signaling on bone formation. We have previously demonstrated that deletion of Notch2 with Prx1-Cre enhances bone formation in the long bones (31). Here, we recreated Prx1-Cre Notch2fl/fl (PN2) mutant mice by
breed-ing Prx1-Cre Notch2fl/+ males with Notch2fl/fl females. Reverse
transcription quantitative PCR (RT-qPCR) analyses with total RNA extracted from cortical bone confirmed that Notch2 mRNA expression was reduced by 50% in the PN2 mice compared with expression in the Notch2fl/fl (N2) mice (Supplemental Figure 1;
supplemental material available online with this article; https:// doi.org/10.1172/JCI96221DS1). On the other hand, Nfatc1, a known target of the Hey transcriptional repressors, was upregu-Table 1. μCT analyses of trabecular bone in proximal tibiae
Genotype BV/TV (%) Tb.N (1/mm) Tb.Th (mm) Tb.Sp (mm) Notch2fl/fl/DMSO 18.1 ± 1.108 4.16 ± 0.335 0.0679 ± 0.002 0.240 ± 0.025 Notch2fl/fl/3PO 12.1 ± 2.661A 2.81 ± 0.537A 0.0613 ± 0.006A 0.365 ± 0.079A Prx1-Cre Notch2fl/fl/DMSO 22.9 ± 0.694B 4.74 ± 0.279B 0.0716±0.005B 0.198 ± 0.016 B Prx1-Cre Notch2fl/fl/3PO 12.5 ± 3.055C 3.31 ± 0.312C 0.0629 ± 0.005 C 0.303 ± 0.034C
Values represent the mean ± SD. Tb.N, number of trabeculae; Tb.Th, trabecular thickness; Tb.Sp, trabecular spacing.
n ≥ 6 for each group. A,B,CP < 0.05, for statistically significant effects for A3PO, BCre, and C3PO-Cre interaction, as
determined by 2-way ANOVA.
Table 2. μCT analyses of cortical bone in proximal tibiae
Genotype BV/TV (%) Tt.Ar (mm2) Ct.Ar (mm2) Ct.Ar/Tt.Ar (%) Cortical ThA (mm)
Notch2fl/fl/DMSO 62.6 ± 2.2 0.94 ± 0.09 0.59 ± 0.04 62.6 ± 2.2 0.20 ± 0.007 Notch2fl/fl/3PO 58.6 ± 2.6A 0.76 ± 0.10 0.45 ± 0.07A 58.6 ± 2.6A 0.17±0.018A Prx1-Cre Notch2fl/fl/DMSO 64.8 ± 2.1 0.90 ± 0.07 0.58 ± 0.04 64.8 ± 2.2 0.21 ± 0.010 Prx1-Cre Notch2fl/fl/3PO 58.9 ± 3.1B 0.75 ± 0.11 0.44 ± 0.08B 58.9 ± 3.1B 0.17 ± 0.021B
Values represent the mean ± SD. Tt.Ar, total area; Ct.Ar, cortical area; Cortical Th, cortical thickness. n ≥ 6 for each group. A,BP < 0.05, for statistically
[image:5.585.37.411.84.144.2]The Journal of Clinical Investigation
R E S E A R C H A R T I C L Emal progenitor cell line derived from adult mice. The choice of the cell line allowed us to establish stable clones expressing either NICD2 or GFP (termed NICD2-ST2 or GFP-ST2 cells, respective-ly) in response to doxycycline (Dox). Expression of NICD2, but not GFP, reduced both glucose consumption and lactate secretion by ST2 cells after 48 hours of Dox induction (Figure 3A). Seahorse analyses confirmed that induction of NICD2 for 48 hours sup-pressed the extracellular acidification rate (ECAR), with or with-out the mitochondria stressors (Figure 3B). NICD2 also reduced the oxygen consumption rate (OCR) in both basal conditions and in response to the uncoupling reagent FCCP (Figure 3C). Quan-tification of the OCR data revealed a decrease in both ATP pro-duction from mitochondrial respiration and the spare respiratory capacity upon NICD2 expression (Figure 3D). Biochemical mea-surements revealed a notable reduction in steady-state intracel-lular ATP levels in response to 48 hours of Dox treatment (Figure 3E). In keeping with reduced glucose consumption, incubation of the cells with the fluorescent glucose analog 2-NBDG revealed that NICD2 began to suppress glucose uptake after 12 hours of Dox treatment (Figure 3F). Western blot analyses showed that (Figure 2H). On the other hand, 3PO did not significantly increase
the levels of the C-terminal telopeptide of type I collagen (CTX-I) in the serum of either N2 or PN2 mice, indicating a relatively small effect on bone resorption (Figure 2I). To confirm the direct effect of 3PO on osteoblast differentiation, we cultured primary BMSCs from PN2 and N2 mice on Jagged1-treated plates in osteogenic media with or without 3PO. Jagged1 suppressed the expression of the osteoblast markers Alpl, Ibsp, Runx2, and Bglap in N2 BMSCs but did not have a similar effect on PN2 BMSCs (Supplemental Figure 2). In fact, Jagged1 resulted in a slight increase in Alpl and Ibsp mRNA expression in the PN2 BMSCs for reasons unknown at present. Importantly, 3PO suppressed the expression of all markers in both N2 and PN2 BMSCs cultured with Jagged1, indicating that Pfkfb3 functionally interacts with Notch in regulating osteoblast differentiation in vitro (Supplemental Figure 2). Thus, both in vivo and in vitro evidence identifies Pfkfb3 as a key mediator for the suppression of osteoblast differentiation by Notch.
Canonical Notch signaling suppresses glycolysis. To gain further insights into the regulation of glucose metabolism, we chose to activate Notch signaling in ST2 cells, a bone marrow
[image:6.585.49.546.53.405.2]NICD2 reduced both Pfkfb3 and Ldha after 12 hours of induction (Figure 3G). Thus, as with Notch activation in the primary bone marrow mesenchymal cells, sustained Notch2 signaling in ST2 cells suppressed glycolysis.
We next assessed the potential role of canonical Notch sig-naling in the regulation of metabolism. Specifically, we tested the effect of dominant-negative Maml1 (dnMaml1), which has been well established as an inhibitor of the canonical Notch sig-naling pathway (33). Retroviral expression of dnMaml1, but not GFP, completely eliminated the suppression of glucose consump-tion by NICD2 and partially restored the producconsump-tion of lactate (Figure 4, A and B). Consistent with metabolic rescue, dnMaml1 restored Pfkfb3 and Ldha expression to normal levels in response
to NICD2 (Figure 4C). It is worth noting that dnMaml1 alone did not affect glucose consumption, lactate production, or the meta-bolic enzymes, confirming the specific antagonism of dnMaml1 on Notch2 signaling. Thus, Notch2 signaling suppresses glucose metabolism through a Maml1-dependent mechanism.
[image:7.585.39.538.56.436.2]The Journal of Clinical Investigation
R E S E A R C H A R T I C L Eeven though it suppressed the mRNA levels of NFATc1, which was previously identified as a Hey1 target gene (Figure 4, D and E) (31). To further test the potential relevance of Hey1, we knocked down its expression in NICD2-ST2 cells with shRNA expressed from a lentiviral vector. Whereas Dox markedly induced Hey1 in cells expressing the control shRNA targeting the luciferase gene (shLuc), 2 independent Hey1 shRNA constructs (Hey1_1 and Hey1_2) diminished the induction of Hey1 by more than 80% (Figure 4F). However, neither construct showed any effect on the suppression of glucose consumption or lactate secretion by Dox in NICD2-ST2 cells (Figure 4G). Therefore, induction of the Hes/ Hey proteins does not appear to be the main mechanism mediat-ing metabolic regulation by Notch.
To gain further insights into the mechanism underlying glyco-lytic suppression by Notch, we performed RNA-Seq experiments using NICD2-ST2 cells with or without Dox treatment for 24 hours. Among the genes with mRNA levels changed by a minimum of 20%, the prototypical Notch target genes, including Hes1, Hes6, Hey1 and Hey2, were induced by NICD2. However, like that of
Hey1, effective knockdown of Hey2, Hes1, or Hes6 did not alleviate the suppression of glucose consumption caused by NICD2 overex-pression (Figure 4, H and I). Importantly, several suppressed genes encode glycolytic enzymes including Pfkfb2, Pfkfb3, Pfkfb4, Eno2, Eno3, and Ldha, while several others, such as Ndufaf2, Ndufc1, Ndufs5, and Ndufaf4 of complex I, and Ndufa4 of complex IV, code for components of the mitochondrial electron transport chain (ETC). RT-qPCR experiments confirmed the suppression of those genes by NICD2 (Supplemental Figure 3). Furthermore, dnMaml1, which was shown earlier to negate the metabolic effect of Notch, either abolished or alleviated the suppression of glycolytic or ETC genes by NICD2 (Figure 5, A and B). Thus, transcriptional suppres-sion of both glycolytic and mitochondrial ETC genes may contrib-ute to the restriction of glycolysis by Notch.
[image:8.585.49.533.54.431.2]To explore the mechanism whereby canonical Notch signal-ing suppresses metabolic gene expression, we investigated the potential role of transcriptional repressors beyond the Hes/Hey family. RNA-Seq experiments identified 14 additional known repressors that were induced by at least 2-fold and that had an Figure 5. Canonical Notch signaling suppresses gene expression of glycolytic enzymes and components of the mitochondrial ETC. (A and B) Relative mRNA levels of glycolytic enzymes (A) and components of the mitochondrial ETC (B) in NICD2-ST2 cells with retroviral expression of GFP or dnMaml1 and treatment with vehicle or Dox for 24 hours. (C) Relative glucose consumption in NICD2-ST2 cells infected with lentivirus expressing different shRNAs, as indicated, with or without Dox for 48 hours. Glucose consumption was normalized to the protein amount and then to the no-Dox control designated as 1.
phosphorylation at Thr172 was reduced in ST2 cells upon NICD2 expression for 12 or 48 hours and observed the same kinetics as that for the suppression of glucose uptake (Figure 6C, compare with Figure 3F). Importantly, dnMaml1, shown above to abolish the metabolic effect of NICD2, also restored the phosphorylation of AMPK and acetyl-coA carboxylase (ACC), a prototypical sub-strate of AMPK (Figure 6, D and E). The suppression of AMPK by Notch was confirmed in WT BMSCs, as Jagged1 reduced the levels of phosphorylated AMPKα (p-AMPKα) and p-ACC (Figure 6F). To test the functional relevance of AMPK suppression to Notch func-tion, we force-activated the enzyme with the AMP analog AICAR. At either 50 or 100 μM, AICAR did not affect basal glucose con-sumption or lactate secretion by BMSCs but abolished the suppres-sion by Jagged1 (Figure 6G). Likewise, 100 μM AICAR overcame the suppression of glucose consumption and lactate secretion by Dox-induced NICD2 expression in the NICD2-ST2 cells (Figure 7A). However, AICAR had little to no effect on mRNA levels of the glycolytic genes that were suppressed by NICD2 (Figure 7B). Thus, we found that force-activation of AMPK was sufficient to counter-act the glycolytic suppression by Notch, without affecting glyco-lytic gene expression. This observation is consistent with previous reports that AMPK phosphorylates Pfkfb3 to increase its enzymat-ic activity and hence glycolysis. Finally, to test whether the sup-pression of complex I genes was sufficient to reduce AMPK activ-ity, we knocked down Ndufaf2, which was suppressed by Notch, and assayed for AMPK phosphorylation. We found that 2 indepen-dent shRNAs effectively reduced Ndufaf2 mRNA expression and decreased p-AMPKα levels relative to total AMPK levels (Figure 7C). Taken together, the results support a model in which canoni-cal Notch signaling induces multiple transcriptional repressors to suppress both glycolytic and mitochondrial ETC genes. Whereas the former reduces the abundance of glycolytic enzymes, the lat-ter results in decreased AMPK activity that probably restricts the activity of the enzymes (Figure 8).
Discussion
We have provided evidence that Notch signaling suppresses glu-cose metabolism in mesenchymal progenitors to inhibit osteo-blast differentiation. The mechanism of the metabolic regulation by Notch involves the transcriptional downregulation of multiple metabolic genes integral to glycolysis or the mitochondrial ETC. The decrease in mitochondrial respiration in turn reduces ROS production and AMPK activity, resulting in further suppression of glycolysis. We believe that these results shed new light on the mechanism through which Notch regulates bone physiology.
Exactly how Notch signaling suppresses metabolic genes is not clear at present. The data clearly indicate the importance of the Maml proteins, thus implicating canonical Notch signaling in metabolic regulation. However, since the NICD-Maml-Rbpjk complex is known to activate gene expression, the gene suppres-sion we observed must be indirect. Although Hes/Hey transcrip-tion suppressors are prototypical mediators for Notch, they are unlikely to be the main driver for metabolic suppression, as over-expression of Hey1 did not impair glycolysis, and knockdown of the relevant Hes/Hey genes did not blunt the Notch effect. On the other hand, 5 transcriptional repressors induced by NICD2 con-tributed to the glycolytic suppression, but future experiments are induced level of more than 10 reads per kb per million mapped
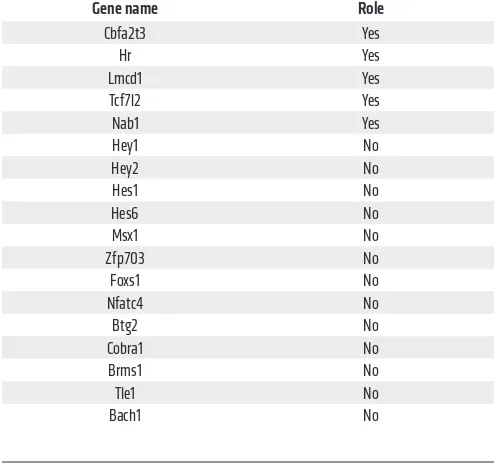
reads (RPKM) upon NICD2 expression over a 24-hour period in ST2 cells. RT-qPCR experiments confirmed the induction of the repressors by NICD2 after 24 hours and, further, that their induc-tion was abolished by the viral expression of dnMaml1. We then systematically knocked down each repressor with 2 independent shRNAs in NICD2-ST2 cells and measured glucose consumption with or without Dox induction over a 48-hour period. The results showed that knockdown of Cbfa2t3, Hr, Lmcd1, Tcf7l2, or Nab1 essentially eliminated glycolytic suppression by NICD2, whereas the other repressors did not have the same effect (Figure 5C and Supplemental Figure 4) (Table 3). Thus, it is likely that canonical Notch signaling induces the expression of multiple transcriptional repressors to suppress glycolysis.
Notch suppresses glycolysis through downregulation of AMPK activity. The suppression of complex I genes by Notch2 prompted us to examine the potential role of complex I in metabolic regula-tion. NICD2 expression in response to Dox for 24 hours reduced the activity of complex I in NICD2-ST2 cells (Figure 6A). Con-sistent with complex I being a major producer of mitochondrial superoxide, we found that NICD2 decreased the level of mito-chondrial superoxide after 12 or 24 hours of Dox induction (Figure 6B). These results are consistent with our earlier observation that NICD2 expression reduced overall oxygen consumption (Figure 3C). Overall, Notch2 signaling suppresses mitochondrial respira-tion and the producrespira-tion of ROS.
[image:9.585.35.286.97.330.2]Recent studies have demonstrated that mitochondrial super-oxide activates adenosine 5′-monophosphate–activated protein kinase (AMPK) through H2O2 (34). Because of the essential role of AMPK in cellular metabolism, we examined its potential relevance to glycolytic suppression by Notch. As a heterotrimeric kinase composed of α, β, and γ subunits, AMPK activation correlates with phosphorylation at Thr172 on the α subunit (35). We found that Table 3. Role of transcriptional suppressors in glycolytic
suppression by Notch
Gene name Role
The Journal of Clinical Investigation
R E S E A R C H A R T I C L Ecose metabolism is not known, they likely reflect the specific epi-genetic landscape and signaling network in each cell type.
The current study further strengthens the link between bone formation and cellular metabolism. Previous studies have demon-strated that Wnt, PTH, and Igf signaling stimulates glycolysis and glutamine catabolism while increasing bone accrual (36). Here, Notch suppressed osteoblast differentiation, at least in part through the restriction of glucose metabolism. Together, these findings indi-cate that metabolic rewiring plays an integral role in the regulation of bone formation and, further, that targeting metabolic pathways may be a promising avenue for the development of novel bone therapies.
Methods
Mouse strains. Notch2fl/fl, R26-NICD2, and Prx1-Cre mouse strains
were generated as previously described (30, 37, 38). We thank Ryuichi Nishinakamura (Kumamoto University, Japan) for providing the R26-NICD2 mouse strain. All mice were housed in a specific pathogen–free (SPF) barrier facility managed by the Department of Comparative Medicine of Washington University. The animals were group housed under a 12-hour light cycle (6 am–6 pm) and fed standard chow (Pico-Lab Mouse Diet 20, product 5058).
necessary to establish the potential direct suppression of glycolytic or ETC genes by any of the repressors implicated here.
The current study highlights the fact that metabolic regula-tion by Notch is highly dependent on cellular context. A previous study has shown that Notch induces the transcription of Glut1, hexokinase A (Hex-A), and Impl3 (Ldha homolog) in Drosophila cells, resulting in a Warburg-like effect (27). However, RNA-Seq detected no change in Glut1, Hk1, or Hk2 upon expression of NICD2 in ST2 cells. On the contrary, we observed a downregula-tion of Ldha and other key glycolytic enzymes and, consequently, a suppression of glycolysis by Notch. Another study using mouse macrophages indicated that Notch stimulates mitochondrial oxi-dative phosphorylation in part through the transcriptional induc-tion of pyruvate dehydrogenase phosphatase catalytic subunit 1 (Ppd1) to promote the M1 phenotype (29). However, we observed a notable decrease in both Pdp1 (–1.7-fold) and Pdp2 (–2.6-fold) in ST2 cells after 24 hours of NICD2 expression. On the other hand, our finding about the suppressive role of Notch in glucose metabo-lism is reminiscent of that previously reported in endothelial cells, in which Notch reduced Pfkfb3 and glycolytic flux (28). Overall, although the exact reason for the different effects of Notch on
[image:10.585.51.542.53.363.2]NEC495A001MC) at 10 μCi per 20 g body weight and then sacrificed after 2 hours for collection of tibiae and femurs. The growth plates were surgically removed with a scalpel under the microscope before the bone marrow was cleared through centrifugation. The remaining trabecular and cortical bone was weighed, chopped with surgical scis-sors, and then lysed in RIPA buffer for 30 minutes on ice. After centrif-ugation, the supernatant was collected for scintillation counting.
Serum biochemical assays. For serum CTX-I or P1NP assays, serum
was collected through retro-orbital bleeding from mice starved for 6 hours, and the serum was analyzed with the RatLaps ELISA Kit (Immunodiagnostic Systems Ltd., AC-06F1) or the Rat/Mouse PINP EIA Kit (Immunodiagnostic Systems Ltd., AC-33F1) according to the manufacturers’ instructions.
Western blot analysis. ST2 cells or mouse primary BMSCs were
har-vested in lysis buffer (50 mM TrisCl, 150 mM NaCl, 1% NP-40, 5 mM EDTA, 5% glycerol) containing proteinase inhibitors and phosphatase inhibitors (Thermo Fisher Scientific, catalog 78442). To extract bone proteins, femurs and tibiae were pulverized in liquid nitrogen after surgical removal of the epiphysis and flushing of the marrow. The bone powders were harvested in the lysis buffer and centrifuged to collect the soluble proteins that were later quantified with the Micro
BCA Protein Assay Kit (Thermo Fisher Scientific). Total protein (10 μg)
Analyses of bone. For 3PO treatment, mice were injected i.p. with
the chemical (MilliporeSigma, 525330) dissolved in DMSO at 50 mg/ kg body weight or an equal volume of DMSO as a control daily
begin-ning on P24 for 4 weeks. Micro-CT (μCT 40, Scanco Medical AG)
was performed on tibiae. Quantification of the cancellous bone was
assessed by measuring 100 μCT slices (1.6 mm) immediately below
the growth plate, with a threshold of 200. For cortical bone
parame-ters, 50 μCT slices (0.8 mm) from the mid-shaft of the tibia were
ana-lyzed, with a threshold of 260.
For dynamic histomorphometry, calcein (MilliporeSigma) dis-solved in water (pH 7.2–7.4, adjusted with NaOH) was injected i.p. at 7.5 mg/kg body weight on days 7 and 2, respectively, prior to sacrifice. Bones were fixed in 70% ethanol, embedded in methyl-methacrylate,
and sectioned at 10-μm thickness. Histomorphometric parameters
were acquired with a BIOQUANT Osteo II from 3 sections per mouse and 3 mice for each genotype.
In vivo glucose uptake assay. Mice injected with 3PO or DMSO
vehicle for 4 weeks were first examined for serum glucose levels. For this, blood samples were collected through the tail vein after the mice were starved for 3 hours, and blood glucose levels were measured with a glucose meter (Ascensia Contour; Bayer). The mice were rested
[image:11.585.46.525.57.389.2]for 30 minutes before being injected i.p. with 14C-2DG (PerkinElmer,
The Journal of Clinical Investigation
R E S E A R C H A R T I C L Eplasmid 20342), FlagNICD2-IRES-EGFP or TetO-FUW-FlagHey1-IRES-EGFP, together with psPAX2 and pMD2.G. After over-night incubation, the cells we placed into fresh media that was then harvested for viruses after 2 days.
To produce the stable cell lines, ST2 cells were coinfected with the FUW-M2rtTA virus, together with either the TetO-FUW-FlagNICD2-IRES-EGFP or the TetO-FUW-FlagHey1-TetO-FUW-FlagNICD2-IRES-EGFP virus. The cells were then plated at single-cell density in 96-well plates for colony selection. The positive clones were identified on the basis of green fluorescence expression and Western blotting in the presence of Dox.
Cell culture. ST2 cells and BMSCs were grown in αMEM (Gib-co, Thermo Fisher Scientific), and 293T cells were grown in DMEM was resolved by electrophoresis on Mini-PROTEAN TGX Precast
Gel (Bio-Rad), transferred onto a 0.45-μm pore PVDF Immobilon-P
membrane (MilliporeSigma), and detected with a specific antibody
against Ldha (product no. 2012), AMPKα (product no. 2531), p-AMPKα
(product no. 2532), β-actin (product no. 4970), Pkm2 (product no.
4053), p-ACC (product no. 3661), or ACC (product no. 3676) (all pur-chased from Cell Signaling Technology); or an antibody against Pfkfb4 (product no. PAB4031) from Novus Biologicals; or Pkm1 (product no. SAB4200094) from MilliporeSigma. Membranes were blocked for 1 hour at room temperature in 5% BSA (Roche) or 5% milk (Bio-Rad) in TBS containing 0.1% Tween-20 (TBST), followed by overnight incu-bation at 4°C with the primary antibody. Then, the membranes were washed with TBST and further incubated at room temperature for 1.5 hours with an HRP-conjugated anti-rabbit (GE Healthcare, product no. NA934V) or anti-mouse (Cell Signaling Technology, product no. 7076S) secondary antibody. All blots were developed using the Clari-ty Substrate Kit (Bio-Rad). Gel images were captured with ChemiDoc (Bio-Rad). Each experiment was repeated with a minimum of 3 inde-pendently prepared protein samples.
Generation of Dox-inducible stable cell lines. To generate the
TetO-FUW-FlagNICD2-IRES-EGFP lentiviral construct, we first created the vector polylinker by replacing cMYC in the TetO-FUW-cMYC plasmid (Addgene plasmid 20324) with a polylinker containing EcoRI, AscI, AsisI, AfeI, PacI, SwaI, SbfI, and XbaI. We then released 3xFlag-NICD2 from p3xFlag-CMV-NICD2(Met1669-Ala2470) with EcoRI and SmaI and inserted it into the EcoRI and AfeI sites of TetO-FUW-polylinker (39). Subsequently, IRES-EGFP amplified by PCR from pCIG was inserted into the PacI and XbaI sites of the polylinker to produce the final construct TetO-FUW-FlagNICD2-IRES-EGFP (40).
To make the TetO-FUW-FlagHey1-IRES-EGFP plasmid, we first inserted Hey1 cDNA into the XbaI and BamHI sites of p3xFlag-CMV-7 (MilliporeSigma) to produce p3xFlag-CMV-Hey1. We then released 3xFlag-Hey1 from p3xFlag-CMV-Hey1 with EcoRI and SmaI and inserted it into the EcoRI and AfeI sites of TetO-FUW-polylinker. Finally, IRES-EGFP was inserted in the same way as described above.
[image:12.585.46.332.53.272.2]Lentiviruses were produced according to a standard protocol. Briefly, 293T cells were transfected with FUW-M2rtTA (Addgene
Figure 8. Working model for Notch signaling in the suppres-sion of glucose metabolism in mesenchymal progenitors.
Canonical Notch signaling induces multiple transcriptional repressors that suppress the transcription of genes encoding glycolytic enzymes or mitochondrial complex I components. The decrease in mitochondrial respiration lowers AMPK activ-ity and helps to reduce glycolysis.
Table 4. Primers used for RT-qPCR
Gene name Forward sequence(5′–3′) Reverse sequence (5′–3′) Alpl ACACCAATGTAGCCAAGAATGTCA GATTCGGGCAGCGGTTACT Bglap TGCTGGAGTGGTCTCTATGA ACCCTCTTCCCACACTGT BSP CCGGCCACGCTACTTTCTT GGACTGGAAACCGTTTC 18S CGGCTACCACATCCAAGGAA GCTGGAATTACCGCGGCT Eno2 CAGGACTTTGTCCGGAACTATC AGGTCATCGCCCACTATCT Eno3 GAACTCCGAGATGGAGACAAAG GGACCTAGAGTCTTGTTGATGTG Hey1 CACTGCAGGAGGGAAAGGTTAT CCCCAAACTCCGATAGTCCAT Hey2 CATGTCGCCTATCCACATCTT GGCATCCGAAGAGCAGAAT Hes6 CGGATCAACGAGAGTCTTCAG CACGGTCAGCTCCAGAAC Hes7 CATCAACCGCAGCCTAGAA GAACTCCAGTATCTCCGCTTTC Ldha TGGAAGACAAACTCAAGGGCGAGA TGACCAGCTTGGAGTTCGCAGTTA Ndufa4 CCCAGCTTGATTCCTCTCTTC GGCTCTGGGTTGTTCTTTCT Ndufaf2 ACTGGAGAGGGCAGACTATT GGTGGAGTCTTCCTTGTTCTTC Ndufc1 CATCTTCATTGTGTGTTTGGATGA TCAACACGGTCGAAGTTCTATG NFATc1 GAGACAGACATCGGGAGGAAGA GTGGGATGTGAACTCGGAAGA Pfkfb2 GACTGCAACAGCAGCTATAAAC GCTGGCAAGCCAATCATAAC Pfkfb3 CTACCTCAACTGGATAGGTGTTC AGGGCGGAAGAAGTTGTAAG Pfkfb4 CATCCAGAGTCGCATCGTTTA CTTGAGGTTTAGCTCGCTCTC Sp7 GGAAAGGAGGCACAAAGAAGC CCCCTTAGGCACTAGGAG
[image:12.585.301.549.495.722.2]D-9891). In some experiments, the cells were infected with dnMaml1- or GFP-expressing retroviruses for 8 hours and recovered in regular media overnight before being seeded overnight for Dox treatment. The retroviral plasmids MSCV-DNMAML1-GFP and MSCV-GFP were provided by Jon Aster (Brigham and Women’s Hospital, Boston, Massachusetts, USA) (41). To test the effect of Jagged1, the cell cul-ture plates were first coated overnight at room temperacul-ture with 50
μg/ml protein G (Thermo Fisher Scientific, 10-1201) in Dulbecco’s
phosphate-buffered saline (DPBS) (Life Technologies, Thermo Fish-er Scientific). The plates wFish-ere then washed 3 times with DPBS and blocked with 10 mg/ml BSA in DPBS for 2 hours at room temperature. The blocked plates were then washed with DPBS and incubated with
recombinant Jagged1-Fc (R&D Systems, 1277-JG) or CromPure IgG
(Gibco, Thermo Fisher Scientific), both supplemented with 10% heat- inactivated FBS and penicillin-streptomycin. BMSCs were isolated from tibiae and femurs of 2-month-old mice. Briefly, the bones were cleanly dissected and the epiphysis cleared off with scissors. Bone marrow cells were collected from the bones by centrifugation and then incubated with RBC lysis buffer (MilliporeSigma, R7757-100ML).
The remaining cells were then passed through a 70-μm cell strainer
before being seeded onto a tissue culture plate in α-MEM
[image:13.585.37.543.88.553.2]contain-ing 10% FBS. After daily changes of the medium for 3 days, the cells were allowed to grow until they reached confluence. The cells were then dissociated and seeded onto 24-well plates for experiments. For the Dox-inducible experiments in ST2 cells, the cells were incubated overnight before treatment with 500 ng/ml Dox (MilliporeSigma,
Table 5. shRNA targeting sequences
Gene name TRC number shRNA ID code Sequence (5′–3′)
Cbfa2t3 TRCN0000096429 1 CCGGGCAAACAAGCTACTTAGAAATCTCGAGATTTCTAAGTAGCTTGTTTGCTTTTTG TRCN0000096430 2 CCGGCGACAAGAAGAAGTGATTGATCTCGAGATCAATCACTTCTTCTTGTCGTTTTTG Hr TRCN0000085998 1 CCGGCCGTTCTACAAATATCTCTTTCTCGAGAAAGAGATATTTGTAGAACGGTTTTTG TRCN0000086000 2 CCGGGCAGGTAGTAGAACGGAAGATCTCGAGATCTTCCGTTCTACTACCTGCTTTTTG Msx1 TRCN0000070623 1 CCGGCCATGTAGGCTACAGCATGTACTCGAGTACATGCTGTAGCCTACATGGTTTTTG TRCN0000070627 2 CCGGGCCTCACTCTACAGTGCCTCTCTCGAGAGAGGCACTGTAGAGTGAGGCTTTTTG Zfp703 TRCN0000256674 1 CCGGGACCTGACACATCCAATTAAACTCGAGTTTAATTGGATGTGTCAGGTCTTTTTG TRCN0000256675 2 CCGGCTCCAGTGTCACCCTACAAACCTCGAGGTTTGTAGGGTGACACTGGAGTTTTTG Foxs1 TRCN0000433258 1 CCGGGTAGGGCTCCTGTCAACTGTTCTCGAGAACAGTTGACAGGAGCCCTACTTTTTTG TRCN0000084998 2 CCGGCAAAGAGATGTGCTCGGCAAACTCGAGTTTGCCGAGCACATCTCTTTGTTTTTG Lmcd1 TRCN0000098786 1 CCGGCCTGCAGTACATGGAACTCATCTCGAGATGAGTTCCATGTACTGCAGGTTTTTG TRCN0000098789 2 CCGGCCGTGCGTACATCGTCACCAACTCGAGTTGGTGACGATGTACGCACGGTTTTTG Nfatc4 TRCN0000075340 1 CCGGGCCAGACTCTAAAGTGGTGTTCTCGAGAACACCACTTTAGAGTCTGGCTTTTTG TRCN0000075341 2 CCGGCGAGGTGGAGTCTGAACTTAACTCGAGTTAAGTTCAGACTCCACCTCGTTTTTG Btg2 TRCN0000231223 1 CCGGATGGCCGTCTCCAGCTAGATACTCGAGTATCTAGCTGGAGACGGCCATTTTTTG TRCN0000231220 2 CCGGGCGAGCAGAGACTCAAGGTTTCTCGAGAAACCTTGAGTCTCTGCTCGCTTTTTG Cobra1 TRCN0000126520 1 CCGGCCTGAGAGTTTCACCAAGTTTCTCGAGAAACTTGGTGAAACTCTCAGGTTTTTG TRCN0000126519 2 CCGGCCTGATATTCAATCTGCACAACTCGAGTTGTGCAGATTGAATATCAGGTTTTTG Brms1 TRCN0000039282 1 CCGGACGACAAACTACATAGCAGAACTCGAGTTCTGCTATGTAGTTTGTCGTTTTTTG TRCN0000039281 2 CCGGGCTCGTTTCTGGTCCATACATCTCGAGATGTATGGACCAGAAACGAGCTTTTTG Tle1 TRCN0000236783 1 CCGGGGCACAGATAAGCGCAGAAATCTCGAGATTTCTGCGCTTATCTGTGCCTTTTTG TRCN0000236782 2 CCGGGATCTTCTCTTTGGGATATTGCTCGAGCAATATCCCAAAGAGAAGATCTTTTTG Bach1 TRCN0000084279 1 CCGGGCGTACACAATATCGAGGAATCTCGAGATTCCTCGATATTGTGTACGCTTTTTG TRCN0000288208 2 CCGGGCTCGACTGTATCCATGACATCTCGAGATGTCATGGATACAGTCGAGCTTTTTG Tcf7l2 TRCN0000012180 1 CCGGGCTGACAGTCAACGCATCTATCTCGAGATAGATGCGTTGACTGTCAGCTTTTT TRCN0000012178 2 CCGGCCTTAGCGTAAGCATCTTATACTCGAGTATAAGATGCTTACGCTAAGGTTTTT Nab1 TRCN0000096136 1 CCGGGTGGTGAAAGAGATGAATTATCTCGAGATAATTCATCTCTTTCACCACTTTTTG TRCN0000351197 2 CCGGGTGGTGAAAGAGATGAATTATCTCGAGATAATTCATCTCTTTCACCACTTTTTG Ndufaf2 TRCN0000265502 1 CCGGACTACTACGTCGCCGAGTACACTCGAGTGTACTCGGCGACGTAGTAGTTTTTTG TRCN0000254242 2 CCGGCCTACTGCAACTCAAGTTAAACTCGAGTTTAACTTGAGTTGCAGTAGGTTTTTG
Hey1 1 GCCCGTTATCTGAGCATCATT
2 AGACCGAATCAATAACAGTTT
Hey2 1 GCCAGAAAGATGAAGGGAAAT
2 CCACCTCTCTTCTGTCTCTTT
Hes1 1 TGAAAGTCTAAGCCAACTGAA
2 CCAGCCAGTGTCAACACGACA
Hes6 1 CCTGAAAGGAAGTTCAGATTT
2 TGGTGTCTACATCCTTAGGCA
shLuc CAGAATCGTCGTATGCAGTGA
The Journal of Clinical Investigation
R E S E A R C H A R T I C L E103015-100) were prepared in XF assay medium at final concentra-tions of 5 mM for oligomycin and 1 mM for the rest. At the end of the assays, protein concentrations were measured for normalization of the OCR and ECAR.
Measurement of mitochondrial superoxide and mitochondrial com-plex I activity. For mitochondrial superoxide measurements,
NICD2-ST2 cells were seeded in 96-well black wall tissue culture plates (Corn-ing, 3904) and treated with vehicle or Dox for 6, 12, or 24 hours. The cells were then treated with the MitoSOX Red mitochondrial superox-ide indicator (Molecular Probes, Thermo Fisher Scientific, M36008)
at 5 μM for 10 minutes at 37°C, washed 3 times with DPBS, and
mea-sured at 510/580 nm with a plate reader (BioTek). The fluorescence intensity was normalized to the DNA content. Mitochondrial complex I activity was measured with the Complex I Enzyme Activity Micro-plate Assay Kit (Colorimetric) (Abcam, ab109721).
shRNA knockdown. Lentiviruses expressing shRNA were
pro-duced by transfecting HEK293T cells with pLKO.1 shRNA plasmids (Genome Center at Washington University) and the packaging plas-mids pMD2.G and psPAX2 using Fugen6 transfection reagent (Prome-ga). The viral media were added to the cells for 8 hours before being replaced with fresh growth media for an additional 48 hours. After treatment with Dox for 24 hours, the cells were harvested for RNA iso-lation and RT-qPCR. For glucose consumption and lactate production assays, the cells were harvested 48 hours after Dox treatment. shRNA targeting sequences are listed in Table 5.
Statistics. Statistical significance was calculated with either a
2-tailed Student’s t test or a 2-way ANOVA. A P value of less than 0.05 was considered significant.
Study approval. The studies in mice were reviewed and approved
by the IACUC of Washington University.
Author contributions
SL conducted all experiments, prepared the figures, and wrote the Methods section. FL conceived the project and wrote the manuscript.
Acknowledgments
The work was partially supported by NIH grant R01AR055923 (to FL).
Address correspondence to: Fanxin Long, Children’s Hospital of Philadelphia, 3651 Civic Center Blvd, ARC 902A, Philadelphia, Pennsylvania 19104, USA. Phone: 267.425.2071; Email: longf1@ email.chop.edu.
FL’s present address is: The Children’s Hospital of Philadelphia Research Institute, University of Pennsylvania, Philadelphia, Pennsylvania, USA.
Fc (Jackson ImmunoResearch, 009-000-008) at a concentration of
2 μg/ml in 0.1% BSA and PBS for 4 hours at room temperature. After
washing 3 times with DPBS, the cells were immediately seeded onto the coated plates in the appropriate medium, as described above for each cell type.
RNA isolation, RT-qPCR, and RNA-Seq. Total RNA was isolated
from NICD2-ST2 cells or BMSCs with the RNeasy Mini Kit (QIAGEN, 74104). Reverse transcription was performed with 400 ng total RNA and iScript Reverse Transcription Supermix (Bio-Rad, 1708891). qPCR was performed with an ABI StepOne Plus machine in a 96-well format using SsoAdvanced Universal CYBR Green Supermix (Bio-Rad, 1725274). Primer sequences are listed in Table 4. 18S rRNA was used as an internal control, and relative expression was calculated by the 2–ΔΔCt method.
For RNA-Seq experiments, NICD2-ST2 cells were treated with vehicle or 500 ng/ml Dox for 24 hours before isolation of total RNA.
Poly-A RNA was isolated from 20 μg total RNA using Oligo-dT beads
[Dynabeads Oligo(dT)25, Thermo Fisher Scientific] and used to
gener-ate the PCR-amplified cDNA library, which was then sequenced with the Illumina HiSeq 2000 as single reads extending 42 bases (Genome Technology Access Center [GTAC], Washington University School of Medicine). The raw data were demultiplexed and aligned to the refer-ence genome (mm9) using TopHat. The Partek Genomic Suite was used to assemble transcripts and analyze their expression. The RNA-Seq data were deposited in the NCBI’s BioProject database (ID PRJNA488100).
Metabolite measurements. Subconfluent NICD2-ST2 cells
grow-ing in αMEM containing 10% FBS were treated with vehicle or 500
ng/ml Dox for 12, 24, or 48 hours. Glucose consumption and lactate production were measured with the Glucose (HK) Assay Kit (Milli-poreSigma, GAHK20) and the L-lactate Assay Kit (Eton biosciences, 1200011002). ATP was measured in cell lysates with the Cell Titer-Glo Luminescent Cell Viability Assay Kit (Promega, G7573 ). For
glu-cose uptake assays, the cells were incubated with 100 μM 2-NBDG
for 1 hour, and fluorescence intensity was measured according to the manufacturer’s instructions (Glucose Uptake Cell-Based Assay Kit, Cayman Chemical, 600470).
Seahorse extracellular flux assays. NICD2-ST2 cells were plated at
5,000 cells/well in XF96 plates coated with Cell-Tak (BD Bioscienc-es). On the next day, the cells were treated with 500 ng/ml Dox for 48 hours with or without inhibitors for the indicated durations before switching to the assay medium (Seahorse Bioscience, 101022-100,
or MilliporeSigma, D5030-1L) and further incubation in a CO2-free
incubator for 1 hour. Oligomycin (ATP synthase inhibitor), carbonyl cyanide p-trifluoromethoxyphenylhydrazone (FCCP; proton iono-phore), antimycin A (complex III inhibitor), and rotenone (complex I inhibitor) (Seahorse XF Cell Mito Stress Test Kit, Seahorse Bioscience,
1. Artavanis-Tsakonas S, Rand MD, Lake RJ. Notch signaling: cell fate control and signal integration in development. Science. 1999;284(5415):770–776. 2. Chiba S. Notch signaling in stem cell systems.
Stem Cells. 2006;24(11):2437–2447.
3. Schroeter EH, Kisslinger JA, Kopan R. Notch-1 signalling requires ligand-induced proteo-lytic release of intracellular domain. Nature. 1998;393(6683):382–386.
4. Kopan R, Goate A. A common enzyme connects notch signaling and Alzheimer’s disease. Genes
Dev. 2000;14(22):2799–2806.
5. Kopan R, Ilagan MX. The canonical Notch sig-naling pathway: unfolding the activation mecha-nism. Cell. 2009;137(2):216–233.
6. Kitagawa M. Notch signalling in the nucleus: roles of Mastermind-like (MAML) transcriptional coactivators. J Biochem. 2016;159(3):287–294. 7. Iso T, Kedes L, Hamamori Y. HES and HERP
families: multiple effectors of the Notch signaling pathway. J Cell Physiol. 2003;194(3):237–255. 8. Hilton MJ, et al. Notch signaling maintains
bone marrow mesenchymal progenitors by suppressing osteoblast differentiation. Nat Med. 2008;14(3):306–314.
9. Yorgan T, et al. Osteoblast-specific Notch2 inacti-vation causes increased trabecular bone mass at specific sites of the appendicular skeleton. Bone. 2016;87:136–146.
11. Zanotti S, Smerdel-Ramoya A, Stadmeyer L, Durant D, Radtke F, Canalis E. Notch inhibits osteoblast differentiation and causes osteopenia. Endocrinology. 2008;149(8):3890–3899. 12. Engin F, et al. Dimorphic effects of Notch
signaling in bone homeostasis. Nat Med. 2008;14(3):299–305.
13. Zhang H, et al. NOTCH inhibits osteoblast for-mation in inflammatory arthritis via noncanoni-cal NF-κB. J Clin Invest. 2014;124(7):3200–3214. 14. Garg V, et al. Mutations in NOTCH1 cause aortic valve disease. Nature. 2005;437(7056):270–274. 15. Mohamed SA, et al. Novel missense mutations
(p.T596M and p.P1797H) in NOTCH1 in patients with bicuspid aortic valve. Biochem Biophys Res Commun. 2006;345(4):1460–1465.
16. Simpson MA, et al. Mutations in NOTCH2 cause Hajdu-Cheney syndrome, a disorder of severe and progressive bone loss. Nat Genet. 2011;43(4):303–305.
17. Isidor B, et al. Truncating mutations in the last exon of NOTCH2 cause a rare skeletal disorder with osteoporosis. Nat Genet. 2011;43(4):306–308. 18. Canalis E, Schilling L, Yee SP, Lee SK, Zanotti
S. Hajdu Cheney mouse mutants exhibit osteo-penia, oncreased osteoclastogenesis, and bone resorption. J Biol Chem. 2016;291(4):1538–1551. 19. Zanotti S, et al. Sustained Notch2 signaling in
osteo-blasts, but not in osteoclasts, is linked to osteopenia in a mouse model of Hajdu-Cheney syndrome. J Biol Chem. 2017;292(29):12232–12244. 20. Esen E, Chen J, Karner CM, Okunade AL,
Patter-son BW, Long F. WNT-LRP5 signaling induces Warburg effect through mTORC2 activation during osteoblast differentiation. Cell Metab. 2013;17(5):745–755.
21. Karner CM, Esen E, Okunade AL, Patterson BW,
Long F. Increased glutamine catabolism medi-ates bone anabolism in response to WNT signal-ing. J Clin Invest. 2015;125(2):551–562. 22. Frey JL, et al. Wnt-Lrp5 signaling regulates fatty
acid metabolism in the osteoblast. Mol Cell Biol. 2015;35(11):1979–1991.
23. Esen E, Lee SY, Wice BM, Long F. PTH pro-motes bone anabolism by stimulating aerobic glycolysis via IGF signaling. J Bone Miner Res. 2015;30(11):1959–1968.
24. Wei J, et al. Glucose uptake and Runx2 synergize to orchestrate osteoblast differentiation and bone formation. Cell. 2015;161(7):1576–1591. 25. Landor SK, et al. Hypo- and hyperactivated
Notch signaling induce a glycolytic switch through distinct mechanisms. Proc Natl Acad Sci U S A. 2011;108(46):18814–18819.
26. Basak NP, Roy A, Banerjee S. Alteration of mitochondrial proteome due to activation of Notch1 signaling pathway. J Biol Chem. 2014;289(11):7320–7334.
27. Slaninova V, et al. Notch stimulates growth by direct regulation of genes involved in the control of glycolysis and the tricarboxylic acid cycle. Open Biol. 2016;6(2):150155.
28. De Bock K, et al. Role of PFKFB3-driven glycoly-sis in vessel sprouting. Cell. 2013;154(3):651–663. 29. Xu J, et al. NOTCH reprograms mitochondrial
metabolism for proinflammatory macrophage activation. J Clin Invest. 2015;125(4):1579–1590. 30. Fujimura S, Jiang Q, Kobayashi C, Nishinakamu-ra R. Notch2 activation in the embryonic kidney depletes nephron progenitors. J Am Soc Nephrol. 2010;21(5):803–810.
31. Tu X, et al. Physiological notch signaling maintains bone homeostasis via RBPjk and Hey upstream of NFATc1. PLoS Genet.
2012;8(3):e1002577.
32. Clem B, et al. Small-molecule inhibition of 6-phosphofructo-2-kinase activity suppresses glycolytic flux and tumor growth. Mol Cancer Ther. 2008;7(1):110–120.
33. Maillard I, et al. Mastermind critically regulates Notch-mediated lymphoid cell fate decisions. Blood. 2004;104(6):1696–1702.
34. Hart PC, et al. MnSOD upregulation sustains the Warburg effect via mitochondrial ROS and AMPK-dependent signalling in cancer. Nat Com-mun. 2015;6:6053.
35. Ismaili N. Treatment trends and outcomes of small-cell carcinoma of the bladder: in regard to Koay et al. (Int J Radiat Oncol Biol Phys 2011 Oct 20). Int J Radiat Oncol Biol Phys. 2012;82(4):1319–1320. 36. Lee WC, Guntur AR, Long F, Rosen CJ. Energy
metabolism of the osteoblast: implications for osteoporosis. Endocr Rev. 2017;38(3):255–266. 37. McCright B, Lozier J, Gridley T.
Genera-tion of new Notch2 mutant alleles. Genesis. 2006;44(1):29–33.
38. Logan M, Martin JF, Nagy A, Lobe C, Olson EN, Tabin CJ. Expression of Cre Recombinase in the developing mouse limb bud driven by a Prxl enhancer. Genesis. 2002;33(2):77–80. 39. Ong CT, et al. Target selectivity of vertebrate
notch proteins. Collaboration between discrete domains and CSL-binding site architecture determines activation probability. J Biol Chem. 2006;281(8):5106–5119.
40. Megason SG, McMahon AP. A mitogen gradient of dorsal midline Wnts organizes growth in the CNS. Development. 2002;129(9):2087–2098. 41. Weng AP, et al. Growth suppression of pre-T acute