ISSN Print: 2163-0429
DOI: 10.4236/ojf.2018.84028 Aug. 21, 2018 439 Open Journal of Forestry
The Diversity and Composition of Woody Plants
in Chebera Churcura National Park (CCNP),
Southern Ethiopia
Mezmir Girma
1, Melesse Maryo
21Shashemene Botanical Garden, Ethiopian Biodiversity Institute (EBI), Shashemene, Ethiopia 2Dilla University, Department of Biology (DU), Dilla, Ethiopia
Abstract
National parks harbor the most valuable biological diversities of national and global significance. The study of these diversities assists for the proper re-source management. This study was carried out to determine woody species diversity and composition in CCNP. Systematic sampling was used to collect vegetation data from 67 plots (400 m2 each), which were laid following
altitu-dinal gradient. From each plot presence/absence of woody species, abundance and structural data were recorded. R Program, Sorensen’s similarity, Shannon diversity index were used for vegetation analysis. Our result indicated that a total of 106 plant specimens belonging to 42 families and 90 genera were iden-tified, of which 57.6% were trees, followed by 18.8% shrubs, 7.6% liana and 16% tree/shrub. The three most dominant families were Fabaceae, Rubiaceae and Combretaceae. Five vegetation community types were identified. Millettia ferugenia—Vepris danelii, and, Combrutum molle—Terminalia browni are among others. The tree density and basal area were 426.5 trees/hectare and 30.92 m2/hectare, respectively. The diversity and evenness indices were 3.88
and 0.46 for the study area, respectively. CCNP has more similarity with Bon-ga and Yayu afromontane forests of Ethiopia. Disturbances caused by the human activities and wild animals such as elephant were major threats to plant biodiversity in CCNP. We recommend floristic as well as ethnobotanical investigations to realize fully the existing plant diversity and their importance. Moreover, national attention should be given to ensure sustainable use of CCNP with its incredible biological resources.
Keywords
Diversity, National Park, Population Structure, Plant Community
How to cite this paper: Girma, M., & Maryo, M. (2018). The Diversity and Com-position of Woody Plants in Chebera Chur-cura National Park (CCNP), Southern Ethi-opia. Open Journal of Forestry, 8, 439-458.
https://doi.org/10.4236/ojf.2018.84028
Received: January 2, 2018 Accepted: August 18, 2018 Published: August 21, 2018
Copyright © 2018 by authors and Scientific Research Publishing Inc. This work is licensed under the Creative Commons Attribution International License (CC BY 4.0).
DOI: 10.4236/ojf.2018.84028 440 Open Journal of Forestry
1. Introduction
Ethiopia is endowed with diverse vegetation types due to its extraordinary num-ber of ecological zones, which range from high altitude Afro-alpine vegetation in the central high lands to arid low-lands in the east, and rain forests in the west
(Friis et al., 2010) that in turn host rare and endangered species and high rates of endemism both in floral and faunal diversities. According to (Gebre-Egziabher, 1991), the number of species of higher plants ranges between 6500 - 7000, of which 10% - 12% are endemic to Ethiopia. High concentrations of endemic spe-cies and great human land-use pressure therefore, make internationally recog-nized as the Eastern montane Biodiversity Hotspot (Schmitt et al., 2010). Forests have immense economic importance, which can provide variety of products es-pecially for rural people, in the form of food, fodder, fuel, medicine, timber, re-sins, and oil, etc. (Naveed et al., 2012).
Forests are also ecologically important in providing habitat for wildlife, in-fluencing climate and maintaining global balances of carbon and atmospheric pollutants. They regulate Climatic factors of a given area. They also protect the soil and landscape from wind and rain erosion. However, due to intricate factors such as anthropogenic, climatic and natural factors, forest plant diversity is fac-ing threats, which may include deforestation, forest fire, land degradation, over-exploitation, overgrazing, shifting cultivation, habitat loss and invasive species
(Environmental Protection Authority of Ethiopia, 2011). Sixty seven houses holds at “Yilga-buba” and 11 households in “Adabacho” kebeles settled and clearing forest for agriculture. Expansion of agriculture towards the park in bor-dering kebeles such as in “Keribela” and “Chawda” is a threat to the National park as well as to the nearby state forest reserves.
The study area is located in the south west part of the country where most of the remaining moist montane forest is found (Yeshitla & Bekele, 2002). Even though, the study area is home for diverse plant and animal communities. It is currently threatened by human activities for the expansion of agriculture. Therefore the park management should take appropriate measures to protect the forest resources. CCNP have become regionally gazetted at the status of National Park with the main objectives of Protection and conservation of the biological resources together with the development of tourism in the area (Appendix).
DOI: 10.4236/ojf.2018.84028 441 Open Journal of Forestry
structure of forest resources is very important to protect threatened and eco-nomic species (Ssegawa & Nkuutu, 2006). The absence of any previous botanical studies in CCNP is a bottleneck to prepare management plan for the national park currently. Without scientific information on the floral communities in the park, and their relation to the wild animals, the management of the park will be severely handicapped. Therefore, ecological study of the park’s plant biodiversity is the basis for meaningful planning to rationalize the use of resources in side CCNP. Thus the purpose of this study is mainly to make assessment on the woody species diversity so that determine the plant community of the park, and the associated management challenges of the CCNP.
2. Materials and Methods
2.1. The Study Area
CCNP is found with in western side of the central Omo Gibe basin in between Dawro zone and Konta special wereda-of SNNPRS in Ethiopia. The park is lo-cated in the south western natural forest belt of the country. The forest in the south west part of the country is characterized by secondary forest types of moist evergreen montane forests within altitudinal range of 1100 - 2700 m.a.s.l. The annual rainfall varies between 1200 mm and over 2000 mm (Mengistu, 2002). Bench Maji, Sheka zones, Konta special woreda, and partly Dawuro zone are areas where patches of forests are found. The study area is reached after a drive of 420 km & 460 kms to the south west of Hawassa and Addis Ababa, respec-tively. It is also reached after a drive of 120 km from Jima town to the east. It covers an area of 1190 km2. Its geographical range lies between an altitude from
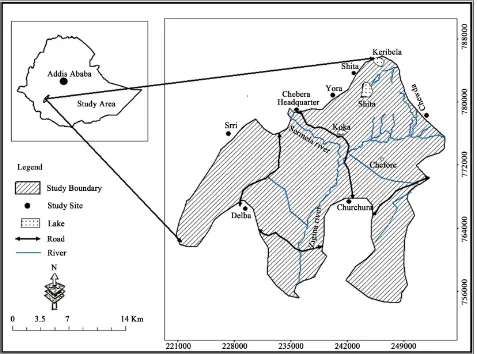
900 m.a.s.l at Churchura and to 2450 m.a.s.l. at Gudumu in Dawro zone. Geo-graphically it is located between 35˚55'00'' and 36˚57'17''E latitude and 6˚56'05'' and 70˚8'02''N longitude (Figure 1) Three woredas and 14kebeles are bordering CCNP, (CCNP report, 2010).
The human population in Dawro Zone was estimated to be 102,621 and in
Konta special woreda was 90,513. Totally 16 kebeles are bordering CCNP. Out of this the population in bordering “kebeles” to CCNP from Isera and Tocha wo-redas of Dawro Zone and Konta special woreda was estimated to be 22,532 and 16,948, respectively.
The average size of land per household is 2 - 3 hectares, which includes living compounds. The major livelihood occupation around the study area is mixed agriculture, growing mainly enset around home-steads and crops like maize,
wheat, Teff, and sorghum. Non timber forest products (NTFP) such as wild cof-fee, honey, medicinal herbs, and spices are collected from the forest. The local people are also involved in game hunting and fishing in the rivers for subsistence use (Ademasu, 2006).
DOI: 10.4236/ojf.2018.84028 442 Open Journal of Forestry
Figure 1. Location of Chebera Churchra national park. Source: (Datiko & Bekele, 2013).
Weynadega (Mid-altitude) climatic zone with temperature ranging between 11˚C and 16˚C. The rainfall is unimodal type that rains from March through September with the peak in July. December, January and February are the dry season of the year. The hottest months are January and February while, the coldest months are July and August with the mean minimum and maximum temperature of 12˚C and 28˚C, respectively.
According to (Friis, 1992), there are three forest types characterize Southwes-tern Ethiopia, namely: Low land dry peripheral semi evergreen Guineo-Congolean forest that extends from 450 to 600 m; Afromontane rainforest that extends from 1500 to 2600 m a.s.l, and Transitional afromontane rainforest type that extends from 500 to 1500 m a.s.l.
DOI: 10.4236/ojf.2018.84028 443 Open Journal of Forestry
destinations to domestic and international tourists, which can generate consi-derable amount of income to the country. Tourism can be effective tool in con-servation and sustainable use of biological diversities.
2.2. Sampling Procedure and Design
Reconnaissance survey had been conducted for one week prior to the actual field work. Short training was given to park experts and scouts by the researcher to familiarize the data collection work and to develop their skill. Systematic sam-pling design was used to collect data on vegetation and environmental variables. Vegetation data was collected from sample plots placed on systematically laid transect lines. The co-ordinates were determined using Garmin GPS 45XL. Plots of 20 m × 20 m (400 m2) were laid at every 150 meters on mountain slopes
where vegetation change is assumed to be more liable. A total of 67 plots were laid along 18 transect lines. The first sample plot was chosen randomly and started 50 meters inward from the edge of the forest to avoid “edge effect”. Transect plots method was employed in the studies of floristic composition by different researchers (Christine et al., 2010). Tree height and diameter inside the plot area were measured by sun to hypsometer and tape meter. The basal area (BA) was calculated for each tree/species from DBH (Diameter at Breast Height) using a formula BA = π(d/2)2.
2.3. Data Collection
Every woody stem including lianas with DBH ≥ 2.5 cm, and height ≥ 5 m in the sample quadrant were measured. Abundance and frequency of all trees, shrubs and lianas in the sample plots were calculated. The co-ordinates of each sample plot were determined using Garmin GPS. The DBH measurement was done with Meter tape. All the woody plants were recorded in the sample plots to be used in the analysis of structural features (density, diameter, and basal area) and the presence-absence data was taken.
Species were identified in the field level using field guide and personal exper-tise experience, the vernacular names mainly Konta and Dawro languages were considered for the recorded trees and shrubs. But those which are not identified at field level Voucher specimens were collected, pressed and taken to national Herbarium of Addis Ababa University for identification.
2.4. Structural Data Collection
DOI: 10.4236/ojf.2018.84028 444 Open Journal of Forestry
study area. In some parts especially in the high lands of the study area agricul-ture activities and tree cutting were scored 2 - 3 (rate). Firing was common in savanna wood land areas. The level of firing disturbance was considered to nor-mal level, because no indication of forest damage except for burnt grass. The state of human interference at each plot was estimated following (Yeshitla & Be-kele, 2002) and with modifications. A 0 - 3 subjective scale was taken into con-sideration to record presence or absence of stumps, logs and signs of fuel wood collection. Therefore, the magnitude of the impact was quantified as follows 0 = nil; 1 = low; 2 = moderate; and 3 = heavy.
Community Perception
Heads-of-households were randomly selected for interview. 50 household heads from 5 rural kebeles were interviewed i.e., 8 to 10 households from each of the five kebeles. The survey included both closed and open-ended questions across three broad categories: 1) views towards wildlife and wildlife conservation 2) views towards protected area management and staff; and 3) a series of house-hold demographic questions, including information about each househouse-hold’s source of Income and lively hood occupation. Furthermore, the perception of the local people on the National park/the protected area, were collected using both structured and semi-structured questionnaire.
2.5. Data Analysis
Species diversity is determined by means of species richness and species even-ness. Species richness (S) is the oldest and most intuitive measure of biological diversity Magurran, (2004), which in the current study represents the total number of woody species of the park in this study. The Shannon-Wiener diver-sity index combines two quantifiable measures; the species richness and species equitability. H' is calculated using the formula,
ln
i i
H
′ = −
∑
p p
where pi is the proportion of individuals of species “i” in the community. An
ad-ditional measure of diversity is the measure of Evenness (E) that is a measure of how similar the abundance of different species is. It is calculated as the ratio of observed diversity (H') to maximum diversity (Hmax) using the formula,
max ln
E H H= ′ =H′ S
where S = number of species, and ln is a natural log. E. Using Menhinick’s index, known as,
D s N
=
where s = richness, N = the total number of individualstems.
DOI: 10.4236/ojf.2018.84028 445 Open Journal of Forestry
number of species unique to Quadrate 1; and c = number of species unique to quadrate 2.
Important value index (IVI)
Moreover, from the structural data, frequency, density, basal area, and IVI were calculated. IVI = Relative density + Relative frequency + Relative Domin-ance (Kent & Coker, 1992).
Multiple linear regressions were computed among all environmental variables using Minitab version 16 computer program. The difference in species composi-tion and diversity among the communities was considered as a funccomposi-tion of the environmental variables these environmental factors were used to associate the relationship between environment and vegetation distribution. The rate of hu-man interference has been considered by assessing stumps. Floral Community and denedrogram were determined using R.2.4.1 computer soft ware (The R Core Team, 2012).
3. Results and Discussions
3.1. Plant Species Diversity
A total of 106 species of woody plants (shrubs, trees, and lianas) belonging to 90 genera and 42 families were identified from the CCNP forest. Trees occupied the highest floristic composition, which together with shrubs contributed to 75% of the floristic composition in CCNP forest. Of the total species examined six were endemic to Ethiopia. Millitia ferugenia (Hochst.) Bak. Vepris daneli (Pi-chi.-Serm.), Kokwaro, Solanecio gigas (Vatke) C. Jeffrey, Cussonia ostinii Chiov.
Erythrina brucei Schweinf. and Rhus glutinosa. Millettia ferruginea is the most abundant species recorded 84 followed by Maesa lanceolata 80, Syzygium gui-neense 73 and Vepris danelii 62 during this study in CCNP.
The families with the highest species richness were Fabaceae represented by 29 species, followed by Rubiaceae (8 species), and Combrataceae (7 species). The three families contributed 29% of the total species. The studies made by (Alemu, 2011) and (Alelign et al., 2007) recorded 87 and 113 species from central and northern parts of Ethiopia. However, both indicated that Fabaceae had the high-est number of taxa in the studies, which is consistence with our finding. This could show that the abundance, and the wide spread distribution of these fami-lies to different agroecological zones in the country.
The high species richness could be due to a wide range of ecological segments, including moist afromontane forest, riverine forest, and savanna wood land and shrub land. Moreover, the droppings of wild animals facilitate dispersion and germination of seeds through their gastrointestinal systems. Also as the study area is under the protected area system, it contributes significantly to its rich-ness.
3.2. Plant Community Types
lev-DOI: 10.4236/ojf.2018.84028 446 Open Journal of Forestry
el from hierarchical cluster analysis/dendrogrmme/ (Figure 2). The abundance data of a species were used for the analysis. Plant community types were given names after two indicator species of high synoptic values calculated using Rpro-gram.
1) Millettia ferruginea—Vepris danelii type community.
[image:8.595.215.536.212.498.2] [image:8.595.211.538.547.726.2]This community is the largest of all in the number of species where there were 28 plots (41.8%) (Table 1) and contains 61 species (57.5%). It was found be-tween the altitudinal ranges of 1950 - 2255 m a.s.l, and the slope gradient varied
Figure 2. Dendrogramme for the forest of CCNP.
Table 1. Plant community types, sample plot number and their altitudinal location.
Comm. Community name of plots Numer of species Plots in the community Numer range (m) Altitude
I Millettia ferruginea— Vepris danelii 28 61 24, 25, 26, 27, 28, 29, 31 1950 - 2255 1, 2, 3, 5, 6, 12, 14, 17,
II Clerodenderum myriciodes— Macranga capensis 9 13 4, 13, 15, 18, 9, 20, 21, 22, 23 2000 - 2367
III Croton macrostchyus— Maesa lanceolata 13 46 48, 49, 50, 52, 56, 57, 59 1643 - 2300 16, 39, 42, 43, 45, 46,
IV Ficus vasta—Cordia africana 4 10 32, 33, 35, 36 1188 - 1207
DOI: 10.4236/ojf.2018.84028 447 Open Journal of Forestry
from 15% - 55%. This community is a part of the main high land forest charac-terized by afromontane forest type. The most important species to this commu-nity are Syzygium guineense, Macaranga capensis, Vepris dainellii, Ilex mitis, Galinieria saxifrage among the tree species and Oxyanthus speciosus, Clausena anisata, and Vernonia ampla are among the shrub species. Olea welwitschii is an emergent tree species with 45 m in this community. The common climb-ers/lianas of this community were Hippocratea goetzei and Landolphia bucha-nanii. A tree fern called Cyathea manniana (Figure 3) was found abundantly in the community at an altitude of 2430 m.a.s.l.
Generally, this community is characterized by relatively high level of anthro-pogenic disturbance, mainly tree felling (deforestation). This is because the op-timal climate in the mid altitude, plant diversity, density and richness are ob-served to be higher in this community and also the area is assumed to be more suitable for human settlement. From the slope data the physiography of the area is characterized by rolling to hilly topography.
2) Clerodenderum Myriciodes—Macranga—Capensis Type Community It consists of nine plots (11.9%) and 13 species (12.3%) (Table 1). Some of the trees recorded in this community are Macaranga capensis, Syzigium guanines, Clerodenderum myriciodes, Dombeya schimperi, Rytigynia neglecta, Schefflera abysinica, Ilex mitis, prunus africanum, Vepris danelii, Galineria saxifraga, and
[image:9.595.210.538.459.705.2]Coffea arabica is the shrub species while Afromomum kororima and Piper ca-pense are some of the economically important spice herbs recorded in this community. This community is located between the altitude ranges of 2000 and 2367 m a.s.l. where the slope gradient ranges from 20% - 45%. Moreover, the “Nerpi hill” which is used as a vantage point and floristically an important site is
DOI: 10.4236/ojf.2018.84028 448 Open Journal of Forestry
found in this community. Where half part of the hill is dominated by only two tree species 30% by Macaranga capensis and 70% by Syzygium guineense. The other half is covered by different types of species. The S. guineense trees record-ed on the hill are young trees with DBH ranging from 15 - 19 cm. Thus, no saplings of M.capensis and/or S. guanines were observed instead Polyscias fulva
and Maesa lanceolata saplings dominate the community. This is may be due to either the wild animals such as Baboons and Colubus monkey which were ob-served in the area feeding on the fruits, have removed the germinating seeds, or blown away by wind or by some other factors. The saplings observed in the area and the next generation that invades the hill may be M. lanciolata and P. fulva.
(Figure 4).
This community is characterized by highest altitude, steep slope, and moun-tainous topography. Because of the high settlements in the high land areas hu-man induced disturbance in the form of deforestation is found to be the highest, leaching of soil minerals at the steep slopes and as a result, the woody plant richness and density became minimal.
3) Croton Macrostachyus—Maesa Lanceolata Community Type
This community consisted of 13 plots (19.4%) and 46 plant species (43.4%) (Table 1), and was found between the altitudinal range of 1643 - 2300 m a.s.l. The slope gradient varied between 20% - 60%. The most important species of this community include Millettia ferruginea, Croton macrostachus, Maesa lanci-olata, Macaranga capensis, Polyscias fulva, Rothmania urcelliformis, and Galine-ria saxifraga. While Verononia ampla, Maytenus arbutifolia, Brucea an-ti-dysentrica and Schrebera alata are the main shrub species identified in this community. The steep slopy landscape of this community made it less accessi-bile to human induced disturbance such as deforestation. However, due to high-er run off and minhigh-erals leaching, both density and richness seems to decrease at higher slopes greater than 30% when compared to others. Figure 5 shows that species richness and slope are highly correlated. In general because of optimum environmental factors the species richness is high at the intermediate slope (Figure 5). A study showed that the slope influences the distribution of individ-ual plants and communities by indirectly regulating the distribution of moisture, nutrients and through the influence of micro-climatic conditions in the site
(Parker & Bendix, 1996).
This community hosted some rare tree species such as Warburgia ugandensis,
which has not been reported in other places except Harena forest in Ethiopia.
Rhus ruspoli, which is normally a shrub in most areas, is now grown up to the size of 35 cm in DBH. And also 50 ha shrub land was found in this community which had not been reported by the park until this study. Hippocratea africana,
Rhamnus prinoides and Embalaa scimperiana are some of the recorded climber species in this community. Spices such as Aframomum corrorima, Zingiber offi-cinale and Piper capense were well populated in this community.
4) Ficus Vasta—Cordia africana Community Type
DOI: 10.4236/ojf.2018.84028 449 Open Journal of Forestry
Figure 4. Nerpihill. dominated by only M. lanciolata and P. fulva saplings.
Figure 5. The species richness versus slope.
for this community is 1197 m. It is the smallest of all communities which con-sists of only 4 plot (6%) and 10 species (9.4%) (Table 1). The physiography of this community is characterized by gentle slope varies between 3% - 6%. The trees were found scattered. The important species of the community are Ficus vasta, Cordia africana, phoenix reclinata, Combretum paniculatum, Ficus exas-perate, Sapium ellepticum, Maytenus arbutifolia and Bridelia micrantha, among which Ficus vasta and Cordia africana were more abundant than others while
[image:11.595.210.533.341.489.2]DOI: 10.4236/ojf.2018.84028 450 Open Journal of Forestry
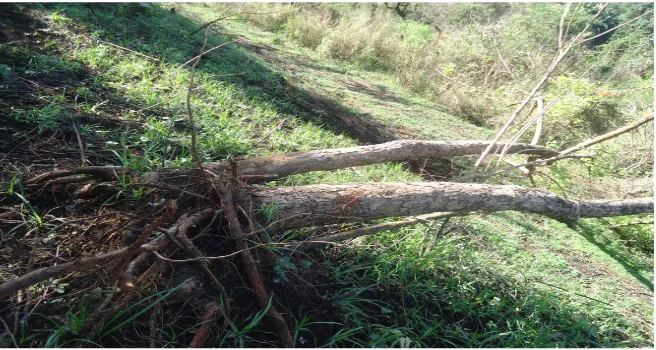
per plot is 5.5. This is due to the fact that the maximum disturbance caused by heavily browsing and trampling impact of the African Elephant/Loxodenta afri-cana/, which is known as robust and wasteful feeders that spends much of its time (about 66%) in this community. They browse items that include bark, fruits, leaves, stems, flowers and fruits (Biru & Bekele, 2012), and also uproot some trees (Figure 6) and feed on their roots of some species such as Gardenia lutia.This calls for strong commitment in the conservation of Gardenia lutia and should be addressed in the management plan of CCNP.
5) Combretum molle—Terminalia Browni TypeCommunity
It is a savanna woodland community characterized by gentle slope mainly 3% - 10% and the under growth is mainly grass. The mean density and richness per plot recorded in this community is 14.6 and 8.7, respectively. It is comprising13 plots (19.4%) but has 43 species (40.5%) (Table 1). It is found mainly in the lower altitude of the study area between 900 - 1207 m a.s.l. The most important species in the upper canopy of this community are Terminalia browni, Combru-tem molle, Stereospermum kunthinaum, Erythrina abyssinica, and Piliostigma thonningii while Gardenia lutia is the most abundant shrub. Tall savanna grass is the main ground level vegetation found in this community. Because Gardenia lutia is heavily browsed by elephants it is not found in community 4where ele-phants reside. But in community 5 where eleele-phants rarely range the plant is found with high population (11.5%).
Because of water scarcity and “malariya” suseptability this community is less favorable to human settlement. Due to this fact anthropogenic impacts are less and hence, plant diversity and species richness is getting high.
3.3. Species Diversity, Richness and Evenness
[image:12.595.211.539.532.707.2]The calculated diversity index and evenness values were 3.89 and 0.46, respec-tively for the study area. Species richness is a measure of the number of species found in a study area. The overall diversity index and evenness of woody species reported from “Zegie” are 3.72 and 0.84, respectively (Alelign et al., 2007). The
DOI: 10.4236/ojf.2018.84028 451 Open Journal of Forestry
values usually fall between 1.5 and 3.5 only rarely surpass 4.5 (Biru & Bekele, 2012). This indicates that the study area has the highest species diversity simi-larly to “Zegie” but unlike Zegie the species were unevenly distributed in the study area. Table 2 indicates that Community 1 had the highest species richness with the highest evenness values. Evenness is simply a measure of how similar species are in their abundances (Magurran, 2004). Regarding the species richness community 1, 3 and 5 are almost equal where community 3 (8.8) followed by community 1 and 5 (8.7 each). The Shannon-Weiner diversity index (H’) varied between 1.93 for Community 4, and 3.4 for community1. Community 1 is the most diversified with a diversity index of 3.4 and a species evenness index (J) of 0.84. All the communities have high eveness value though community 1, 4 and 5 have similar evenness with higher values. Community with high evenness index is characterized by large number of species which are distributed equally in most sample plots. Community with high evenness index is more stable than the less-er ones.
3.4. Environmental Factors versus Species Richness and Density
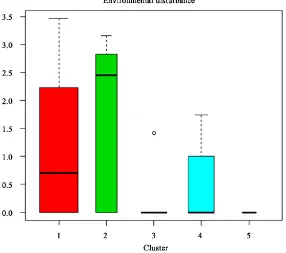
[image:13.595.233.519.451.704.2]The correlation out puts (Table 3) indicates significant relationship between al-titude and stump. Anthropogenic impacts were evaluated by rating counted stumps in each plot. High number of stumps (2.8 - 4 stumps/plot) was counted in community 1 and 2 (Figure 7), which were very close to villages. The box plot indicates that disturbance level is the highest in community 2 followed by com-munity 1. But the stump count was found to be (0 - 0.2/plot) at lower altitudes where human settlement is low in around community 4 and 5 (Table 3).
DOI: 10.4236/ojf.2018.84028 452 Open Journal of Forestry
Table 2. Species richness, evenness and Shannon Weiner diversity index of the plant community.
Community Richness index (H') Diversity H' Max Evenness (J) Abundance
1 61 3.419 4.0943 0.84 487
2 13 1.957 2.5649 0.76 62
3 46 3.013 3.8286 0.79 347
4 10 1.927 2.3026 0.84 26
5 43 3.151 3.7612 0.84 174
Table 3. Differences among the communities with respect to some environmental and structural parameters.
Community
Altitude
(masl) Aspect value Slope (%)
Disturbance (no of stumps/plot)
Richness (no. of spp/plot)
Density (no of stems/plot)
Mean SE Mean SE Mean SE Mean SE Mean SE Mean SE
1 1827.2b 61.06 2 0.2 25.2b 2.6 2.8b 0.72 8.7b 0.61 17.9bc 1.74
2 2252.2c 52.89 2 0.4 32.2b 3.7 4.7b 1.34 3.9a 0.7 11.9b 2.55
3 1978.5b 66.49 2.5 0.3 33.8b 3.8 0.6a 0.27 8.8b 0.82 25.2c 2.97
4 1197.2a 4.59 2.2 0.6 4.5a 0.7 0a 0 4a 0.91 5.5a 0.5
5 1075.7a 28.06 1.5 0.3 4.5a 1 0.2a 0.15 8.7b 0.61 14.6b 1.96
Forests are encroached for fuel wood and construction purpose by the nearby dwellers. In some kebeles such as “Keribela”, “Yilgabuba”and “Chawda” defore-station for the expansion of agriculture towards the study site was observed; which could be a potential threats to the protected area.thus it should be consi-dered in the management plan the park.
3.5. Phytogeographical Comparison
Phytogeographical analysis is one of the attractive aspects in the study of botany. The analysis gives information on the similarities of floral composition in dif-ferent areas. The afromontane areas also vary in floristic composition, physiog-nomy and ecology and shows varying relationships with other phytogeographic regions (Coetzee, 1978).
[image:14.595.210.539.272.434.2]DOI: 10.4236/ojf.2018.84028 453 Open Journal of Forestry
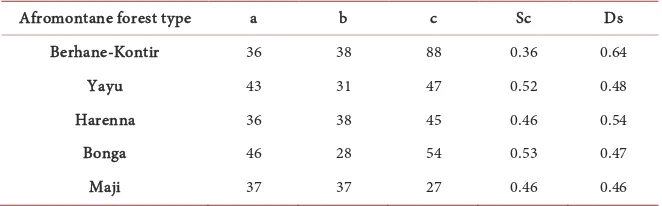
Table 4. Comparison of CCNP Forest with other five forests in Ethiopia based on their similarities (a = common to CCNP afromontane type to the forest in comparison, b = found only in CCNP Forest, c = found only in the forest in comparison with CCNP, Sc = Sorensen’s similarity coefficient, Ds = Dissimilarity).
Afromontane forest type a b c Sc Ds
Berhane-Kontir 36 38 88 0.36 0.64
Yayu 43 31 47 0.52 0.48
Harenna 36 38 45 0.46 0.54
Bonga 46 28 54 0.53 0.47
Maji 37 37 27 0.46 0.46
Source: W/Yohannes, 2006.
3.6. Community Perception
The residents located in and around CCNP areas are dependant almost exclu-sively on subsistence agriculture and livestock rearing. Informents from the so-ciety were asked wether park demarcation is important or not. All the the res-pondents agreed with the delineation of the park area. 72% of the resres-pondents do not know well where the park boundaryis. 65% percent of the respondents do not agree with the present boundary. Roughly all of the respondents cited the shortage of pasture as their main challenge especially during dry season. 90% of the respondents complained that they are negatively influenced from wild ani-mals either by crop riding or predation on the domestic aniani-mals and or threat-ening their lives. Human wildlife conflict is one of the main problems between the management of the park area and local communities (Datiko & Bekele, 2013).
Strengthening the protected area system is an appropriate management tool for better conservation and use of the biological diversity of the study area.
The local community agrees that, the national park would benefited the local people by providing job opportunity through hiring scouts, and they hope that the park management could expand the infrastructure in the area to attract tourists so that the local people would have an opportunity to enhance their in-come through tourism.
4. Conclusion and Recommendations
4.1. Conclusion
DOI: 10.4236/ojf.2018.84028 454 Open Journal of Forestry
spots as well as tourist destinations in the country.
Of all the environmental factors studied, disturbance and altitude determined the tree density and plant species richness in the study area. The main distur-bances were caused by larger wild animals such as elephant and human caused disturbances, such as felling trees (deforestation). Crop riding or predation on the domestic animals and in some cases threatening human lives, are the main causes for human wild animals’ conflict in the study area.
4.2. Recommendations
A practical strategy should be set in the management plan of the park to minim-ize the level of disturbances caused by wild animals and the surrounding people. HWC needs to be resolved wisely in such a way to benefit both the protected area management and the local community. Further ecological studies concern-ing the dynamics and composition of species in relation to environmental fac-tors, ethno-botanical studies, the study on contribution of the forest to the economy of the local people, studies on indigenous knowledge of the local people on the use and management of forest and, the NTFPs in side CCNP has vital importance in the exploration of CCNP as well as to design a strategy to benefit the local people without harming the forest.
Conflicts of Interest
The authors declare no conflicts of interest regarding the publication of this pa-per.
References
Ademasu, M. (2006). History and Status of African Elephant Loxodonta africana, and Human-Elephant Conflict in Chebera Churchura National Park. M.Sc. Thesis, Addis Ababa: Addis Ababa University.
Alelign, A., Teketay, D., Yemshaw, Y., & Edwards, S. (2007). Diversity and Status of Re-generation of Woody Plants on the Peninsula of Zegie, Northwestern Ethiopia. Tropi-cal Ecology, 48, 37-49.
Alemu, S. (2011). Woody Species Composition, Diversity and Structural Analysis of An-gada Forest in Merti Wereda, Arsi Zone of Oromia Region, Ethiopia (p. 102). Addis Ababa: Addis Ababa University.
Biru, Y., & Bekele, A. (2012). Food Habits of African Elephant (Loxodonta africana) in Babile Elephant Sanctuary, Ethiopia.
Bongers, F., Popma, J., Castillo, M. D., & Carabias, J. (1988). Structure and Floristic Composition of the Lowland Rain Forest of Los Tuxtlas, Mexico. Vegetatio, 74, 55-80.
https://doi.org/10.1007/BF00045614
CCNP (2010). Annual Report.
Christine, B. S., Denich, M., Demissew, S., Ib Friis, & Juergen, H. B. (2010). Floristic Di-versity in Fragmented Afromontane Rainforests: Altitudinal Variation and Conserva-tion Importance. Applied Vegetation Science, 13, 291-304.
DOI: 10.4236/ojf.2018.84028 455 Open Journal of Forestry
Datiko, D., & Bekele, A.(2013). Conservation Challenge: Human-Carnivore Conflict in Chebera Churchura National Park, Ethiopia. Pakistan Journal of Biological Sciences,
16, 1758-1764. https://doi.org/10.3923/pjbs.2013.1758.1764
Environmental Protection Authority of Ethiopia (2011). GEF Portfolio Identification Document. Addis Ababa.
Friis, I. (1992). Forests and Forest Trees of Northeast Tropical Africa: Their Natural Ha-bitats and Distribution Patterns in Ethiopia, Djibouti and Somalia.
Friis, I., Demissew, S., & van Breugel, P. (2010). Atlas of the Potential Vegetation of Ethi-opia. Denmark: Det Kongelige Danske Videnskabernes Selskab.
Gebre-Egziabher, T. B. (1991). Diversity of the Ethiopia Flora. In J. M. M. Engels, J. G. Hawkes, & M. Worede (Eds.), Plant Genetic Resources of Ethiopia (pp. 75-81). Cam-bridge: Cambridge University Press.
Kent, M., & Coker, P. (1992). Vegetation Description and Analysis: A Practical Approach
(p. 351). London: Belhaven Press.
Kumar, A., Marcot, B. G., & Saxena, A. (2006). Tree Species Diversity and Distribution Patterns in Tropical Forests of Garo Hills. Current Science, 91, 1370-1381.
Magurran, A. E. (2004). Measuring Biological Diversity. Hoboken, NJ: BlackWell. Mengistu, K. (2002). Tropical Secondary Forest Management in Africa: Reality and
Pers-pectives. Addis Ababa: FAO/EC.
Naveed, S., Hussain, F., Khattak, I., & Badsha, L. (2012). Floristic Composition and Eco-logical Characteristics of Olea-Acacia Forest of Shamshokii District Karak. Global Journal of Science Frontier Research Biological Sciences, 12, 31-36.
Parker, K. C., & Bendix, J. (1996). Landscape Scale Geomorphic Influences on Vegetation Patterns on Four Environments. Physical Geography, 17, 113-141.
Schmitt, C. B., Denich, M., Demissew, S., Friis, I. B., & Boehmer, H. J. (2010). Floristic Diversity in Fragmented Afromontane Rainforests: Altitudinal Variation and Conser-vation Importance. Applied Vegetation Sciences, 13, 291-304.
Senbeta, F. W. (2006). Biodiversity and Ecology of Afromontane Rain-Forests with Wild Coffee Arabica L. Populations in Ethiopia. Ecology and Development Series No. 38, Bonn: Center for Development Research, University of Bonn.
Ssegawa, P., & Nkuutu, D. N. (2006). Diversity of Vascular Plants on Ssese Island in Lake Victoria, Central Uganda. African Journey Ecology, 44, 22-29.
https://doi.org/10.1111/j.1365-2028.2006.00609.x
The R Core Team (2012). A Language and Environment for Statistical Computing. Ver-sion 2.15.2, R Foundation for Statistical Computing.
W/Yohannes, D. (2006). Diversity, Distribution and Relative Abundance of the Avian Fauna of Chebera Churchura National Park, Ethiopia. MSC Thesis, Addis Ababa: Ad-dis Ababa University.
Yeshitla, K., & Bekele, T. (2002). Plant Community Analysis and Ecology of Afro-Montane and Transitional Rainforest Vegetation of Southwestern Ethiopia.
SINET: Ethiopian Journal of Science, 25, 155-175.
DOI: 10.4236/ojf.2018.84028 456 Open Journal of Forestry
Appendix. The List of Identified Woody Plant Species of the
Study Area
1. Millettia ferruginea
2. Maesa lanceolata
3. Syzygium guineense
4. Vepris danelii
5. Croton macrostachyus
6. Macaranga capensis
7. Maytenus arbutifolia
8. Galiniera saxifrage (Diss) 9. Phoenix reclinata
10. Lepidotrichilia volkensi
11. Rothmannia urcelliformis (assefa AAU) 12. Terminalia brownie
13. Clerodenderum myriciodes
14. Vernonia ampla
15. Gardenia lutea
16. Combretum molle
17. Bersama abyssinica
18. Albizia gummifera
19. Polyscias fulva
20. Dracaena steudneri
21. Stereospermum kunthianum
22. Sapium ellipticum
23. Calpurina aurea
24. Albizia schimperiana
25. Cordia africana
26. Ficus vasta
27. Landolphia buchannaniin
28. Ficus sur
29. Vitex doniana
30. Terminalia laxiflora
31. Rytigynia neglecta
32. Celtis africana
33. Clausena anisata
34. Grewia molis
35. Coffee arabica
36. Ficus thoning
37. Sarcocephalus latifolius
38. Prunus africana
39. Brucea antidysentrica
40. Apodytes dimidiate
DOI: 10.4236/ojf.2018.84028 457 Open Journal of Forestry
42. Dombeya torrida
43. Olea welwitschii
44. Piliostigma thonningii
45. Ekebergia capensis
46. Flacourtia indica
47. Enthada abyssinica
48. Dombeya Schimperiana
49. Nuxia congusta
50. Trema orientalis
51. Vangueria apiculata
52. Pterocarpus leucens
53. Ehretia cymosa
54. Aningeriaadolfi-friderici
55. Allophylus abyssinicus
56. Balanites aegyptiaca
57. Bridelia micrantha
58. Buddleia polystachya
59. Combretum Collinum
60. Combretum paniculatum
61. Erythriana abyssinica
62. Maytenus obscura
63. Oxyanthus speciosus
64. Teclea noblis
65. Vernonia amygdalina
66. Warburgia ugandensis
67. Trichilia emetic 68. Solanecio giggas
69. Senna Petersiana
70. Dobera glabra
71. Ozoroa insignis
72. Paullinia pinnata
73. Oncoba spinosa
74. Ilex mitis
75. Grewia flavescens
76. Gouania longipicata
77. Gnidia lamprantha
78. Embela schimperi
79. Dombeya kirkii
80. Dalbergia lacteal
81. Cusinia ostini 82. Baphyia abyssinica
83. Anogeissusleiocartar./leiocarpus 84. Ficus glumosa
DOI: 10.4236/ojf.2018.84028 458 Open Journal of Forestry
86. Acokanthera schimperi
87. Albizia grandibracteata
88. Carissaa edulis
89. Combutum adengonium
90. Cussonia holistic
91. Cussonia arborea
92. Dichrostachys cinerea
93. Rhus ruspoli
94. Schrebera alata
95. Sclerocarya birrea
96. Ficus exasperate
97. Hagenia abyssinica
98. Hippocratea africana
99. Lannea schimperi
100. Mimusops laurifolia
10. Rhamnus primoides
102. Tamarindus indica
103. Trichilia dregeana
104. Vernonia thomsoniana
105. Woodfordia uniflora