doi:10.4236/jsip.2011.24040 Published Online November 2011 (http://www.SciRP.org/journal/jsip)
Simple Human Gesture Detection and Recognition
Using a Feature Vector and a Real-Time
Histogram Based Algorithm
Iván Gómez-Conde, David Olivieri, Xosé Antón Vila, Stella Orozco-Ochoa
Department of Computer Science, University of Vigo, Ourense, Spain. Email: {ivangconde, anton, moroo}@uvigo.es, [email protected]
Received August 11th, 2011; revised September 12th, 2011; accepted September 22nd, 2011.
ABSTRACT
Gesture and action recognition for video surveillance is an active field of computer vision. Nowadays, there are several techniques that attempt to address this problem by 3D mapping with a high computational cost. This paper describes software algorithms that can detect the persons in the scene and analyze different actions and gestures in real time. The motivation of this paper is to create a system for the tele-assistance of elderly, which could be used as early warning monitor for anomalous events like falls or excessively long periods of inactivity. We use a method for foreg- round-background segmentation and create a feature vector for discriminating and tracking several people in the scene. Finally, a simple real-time histogram based algorithm is described for discriminating gestures and body positions through a K-Means clustering.
Keywords: Computer Vision, Foreground Segmentation, Object Detection and Tracking, Gesture Recognition, Tele-Assistance, Telecare
1. Introduction
Computer vision has entered an exciting phase of develo- pment and use in recent years and has benefitted from innovations in related fields such as machine learning, improved Internet networks, computational power, and camera technology. Present applications go far beyond the simple security camera of a decade ago and now inc- lude such fields as assembly line monitoring, sports me- dicine, robotics, and medical tele-assistance. Indeed, dev- eloping a system that accomplishes these complex tasks requires coordinated techniques of image analysis, statis- tical classification, segmentation, inference algorithms, and state space estimation algorithms.
To understand the importance of this problem area, it is interesting to appreciate some recent statistics related to the growing elderly population. Life expectancy wo- rldwide has risen sharply in recent years. In 2050 the number of people aged 65 and over will exceed the number of youth under 15 years, according to recent demographic studies [1]. Combined with sociologic fac-tors, there is thus a growing number of elderly people that live alone or with their partners. While people may need constant care, there are two problems: there are not
enough people to care for elderly population and the government can not cope with this enormous social sp- ending. This is the motivation for this paper because Computer Vision (CV) can provide strong economic savings by eliminating the need for 24 hour in-house assistance by medical staff. A potential tele-assistance application could use video to detect anomalous behavior, such as falls or excessively long periods of inactivity [2]. Therefore, present systems are being developed that collect a wide array of relevant medical information of patients in their homes, and send this information to a central server over the Internet. Thus, these systems pro-vide clear economic cost reduction of primary care as well as early warning monitoring patients before they enter a critical phase, necessitating costly emergency care.
Simple Human Gesture Detection and Recognition Using a Feature Vector and a Real-Time Histogram Based Algorithm 280
The main problems of computer vision are: first, we must somehow detect what we consider to be the fore- ground objects, then, we must track these objects in time (over several video frames), and third, we must discern something about what these objects are doing.
Detecting moving objects in a video scene and sepa- rating them from the background is a challenging prob- lem due to complications from illumination, shadows, dynamic backgrounds etc [6]. Motion detection is con- cerned with being able to notice objects that move within a scene, thereby separating foreground objects from the background. There are several techniques that have been applied to motion detection [7] and can be grouped into three broad categories: environmental modeling [8], mo- tion segmentation [9], and object classification [10].
Once objects have been separated from the background, we are interested in tracking these objects individually. The goal is to track particular objects during subsequent frames in the video sequence based upon their unique characteristics and locations. An important research field is to track multiple people in cluttered environments. This is a challenging problem due to several factors: people have similar shape or color, complex events such as run- ning and walking may be within the same scene, or depth perspective of real world cameras. Another challenging problem that must be treated by the software is occlusions with objects or other people. We shall briefly consider four prominent strategies for implementing object track- ing: region based [11], active contour based [12], feature based [13] and model based [14].
Finally, we must distinguish body part positions for the purpose of action and gesture recognition. There is a large body of literature in the area of human action recognition. Recent comprehensive surveys of human action in videos are described by Poppe [3] and Forsyth [15]. As an exa- mple of early approaches to this complex problem, a tem- plate matching technique where body parts are repres- ented by a deformable skeleton model which is mapped to points on the body from frame to frame [16] and other models using head trajectories and fuzzy logic for action recognition [17]. Recently, some researchers are using kernel classifiers and Bayesian probabilistic models to construct tree models of foreground objects [18].
The problem of almost all these techniques is that they produce an overabundance of information at the cost of huge computation. This paper presents a more simplistic and computationally viable approach for tracking and gesture recognition.
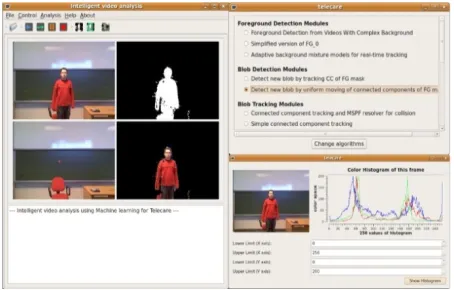
Our system, based upon the OpenCV computer vision library [19], captures real time video from a webcam, perf- orms foreground object segmentation, tracks these objects (humans), and subsequently determines a limited set of human body actions and gestures in real time. A screen-
shot of the application developed is given in Figure 1.
This paper describes a computer vision application that can be used in telecare for detecting anomalous events in. The three contributions are: 1) a comparison of different foreground-background algorithms, 2) a feature based model for tracking multiple objects, and 3) a real time method for detecting basic human body positions, that could eventually be used in a behavior detection algo- rithm.
The paper is organized as follows: first, we describe the details of motion detection, segmentation of objects, and the methods we have developed for detecting anomalous events. The Section 3 shows the experimental results and discussion and finally we present the conclusions of this work.
2. Theory and Algorithms
Our system is a research application where the graphical interface is designed to provide maximum information about different parameters as well as easy comparison of different segmentation algorithms. The system is not meant for end-users at the moment. Instead, the architect- ture of the system provides a plugin-framework for incl- uding new ideas. A high level schema of our software
[image:2.595.310.537.396.541.2]system is shown in Figure 2.
Figure 1. A screenshot of the main window of the applica-tion.
Motion Detection
Object Tracking
Identification
Foreground Extraction
Segmentation of individual
Objects
[image:2.595.309.535.576.703.2]Behavioral and Event Classification
It consists of the basic components described in the previous section, namely a foreground extraction, object segmentation, tracking of individual objects and finally event classification. First, we use a Gaussian Mixture Model with the optimal settings for the background-for- eground segmentation. Tracking of multiple objects is performed by first clustering individual objects, or “bl- obs”, from feature vectors formed by their dimensions, position in the image, color space, and velocity vectors. In order to experiment with different segmentation sch- emes for discriminating events, we have implemented histogram based algorithms.
2.1. Foreground Segmentation
The first phase of extracting information from videos consists of performing basic image processing. These include: loading the video, capturing individual frames, and applying various smoothing filters. Next, blobs are id- entified based upon movement between frames. For static cameras, this amounts to simply taking note of pixel loca-tions that change value from frame to frame within a specified threshold. There are several sophisticated back- ground subtraction methods for eliminating shadows and other artifacts that we shall describe in the next section, however the basic background subtraction is based upon two ideas: 1) finding an appropriate mask for subtracting moving objects in the foreground and 2) updating the background.
Two methods are typically employed: a Running aver- age and Gaussian mixture model, where each pixel is cl-
assified to belong to a particular class (Figure 3).
2.1.1. Running Average [19]
This technique is by far the easiest to comprehend. Each point of the background is calculated taking the mean of accumulated points over some pre-specified time interval,
. In order to control the influence of previous frames, a weighting parameter
t
is used as a multiplying
con-stant in the following way:
, 1
1
,
,t t t
A x y A x y I x y (1)
where the matrix A as the accumulated pixel matrix,
,
[image:3.595.57.284.607.693.2]I x y the image, and is the weighting parameter.
Figure 3. Execution of “running average (RA)” (second row) and “Gaussian mixture model (GMM)” (third row).
For a constant value of , the Running average is not
equivalent to the result of summing all of the values for each pixel across a large set of images, and then dividing by the total number of images to obtain the mean. This method is better than simple mean because the most re-cent contributions are given more weight than those far-
thest in the past. The parameter essentially sets the
amount of time necessary for the influence of a previous frame to fade out. In this paper we have tested with 8
values of between 0 and 0.8.
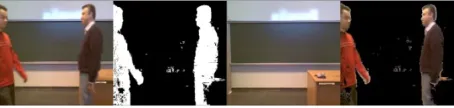
Thus, the background is subtracted by calculating the Running average of previous background images and the current frame with the mask applied. An example using
this algorithm is given in Figure 4. The left image is the
generated mask. The second image is the resulting back- ground image obtained from multiple calls to the Run- ning average routine. The third image is the result of ap- plying the mask to the current image. Finally, the fourth image is the original image with rectangular contours defining moving foreground objects, after applying im- age segmentation.
2.1.2. Gaussian Mixture Model [7]
This model is able to eliminate many of the artifacts that the Running average method is unable to treat. This
method models each background pixel as a mixture of K
Gaussian distributions (where K is typically a small
number from 3 to 5). Different Gaussians are assumed to represent different colors. The weight parameters of the mixture represent the time proportions that those colors stay in the scene. The background components are det- ermined by assuming that the background contains B highest probable colors. The probable background colors are the ones which stay longer. Static single-color objects tend to form tight clusters in the color space while those in movement form wider clusters due to different re- flecting surfaces during the movement. This measure is
called the fitness value. To allow the model to adapt to
changes in illumination and run in real-time, an update scheme is applied. It is based upon selective updating. Every new pixel value is checked against an existing
model component to check the value of its fitness. The
first matched model component will be updated. If it finds no match, a new Gaussian component will be added with the mean at that point, a large covariance matrix and a small value of weighting parameter.
[image:3.595.310.537.643.697.2]Simple Human Gesture Detection and Recognition Using a Feature Vector and a Real-Time Histogram Based Algorithm 282
We consider the values of a particular pixel over time
as a “pixel process”. At any time t, what is known about
a particular pixel, {px py0, 0}, is its history
x1, , xt
I px py i0, 0, :1
it (2)where I is the image sequence. We choose to model the
recent history of each pixel,
x1, , xt
, as a mixture of K Gaussian distributions. The probability that a certainpixel has a value of xt at time t can be written as:
t Kj1 j
t;p x
w x j
(3)where wj is the weight parameter of the th Gaussian
component, and
k
( , )t j
η x is the Normal distribution of
component, given by
th k
xN; j
xN; j,Cj
(4)
1
1 2 1 2 2
1
; e
2π
T
j j j
x C x
N j D
j
x
C
(5)
In the above equations, µj is the mean and
2
j j
C I is the covariance of the th component.
The prior weights of the K distributions at time t are
adjusted as follows:
k
1
1
j j
w w Mj (6)
where is the learning rate and Mj is 1 for the
model which matched and 0 for the remaining models. After this approximation, the weights are renormalized.
1 defines the time constant which determines change.
j
w is effectively a causal low-pass filtered average of
the (thresholded) posterior probability that pixel
value-shave matched model j given observations from time 1
through t.
The K distributions are ordered based on the fitness
value 2
j j
w and the first B distributions are used as a
model of the background of the scene where B is
esti-mated as:
1arg min bj j
B
w T
(7)The threshold T is the minimum prior probability that
the background is in the scene. In this paper we have tested with 8 values of variance between 1 and 5.
2.2. Finding and Tracking Individual Blobs Foreground objects are identified in each frame as rectan- gular blobs, which internally are separate images that can be manipulated and analyzed. Only those objects of a certain size are considered, thereby eliminating small artifacts that can be considered as foreground like lighting changes in the scene or small shadows. Therefore, the blobs with an area less than a threshold are eliminated. For each blob, the background mask is subtracted and a simple image erosion
operation is performed in order to be sure to eliminate any background color contributions. This erosion process helps in feature classification since common background pixels don’t contribute to the object color histograms.
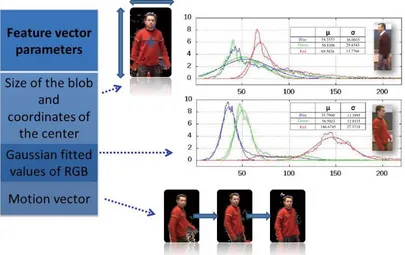
In order to classify each blob uniquely, we define the
following feature vector parameters (Figure 5): 1) the
size of the blob, 2) the Gaussian fitted values of RGB components (the channels red, green and blue are ap-proximated by three Gaussians), 3) the coordinates of the blob center, and 4) the motion vector. Because of random fluctuations in luminosity, smaller blobs appear, but we discard them. The size of blobs is simply the sum of the total number of pixels. We also normalize the feature vectors by the number of pixels.
In order to match blobs from frame to frame, we per- form a K-Means clustering [20] with: the size of the blob, the coordinate X and Y of the center, the velocity of the blob in the three previous frames and the mean, standard deviation and skewness of the Gaussians of RGB compo- nents. The number of clusters is the number of the blobs in the frame. Since this can be expensive to calculate for each frame, we only recalculate the full clustering algo-
rithm when blobs intersect. Figure 6 shows excellent
discrimination by using the norm histogram differences between blobs for each color space.
In the plot, the x-axis is the difference of the red color channel between blobs, while the y-axis is the norm of the difference of histograms in the green channel. For a
particular video sequence, the results shown in Figure 6
demonstrate that two separate blobs are easily classified with only the normalized color histograms.
The tracking algorithm used is similar to other systems described in the literature. Once segmented foreground objects have been separated, and for each object we have formed a rectangular blob region, we characterize the blob by its feature vector. Tracking is performed by matching
features of the rectangular regions. Thus, given N rectan-
gular blobs (N = number of blobs in current image), we
match all these rectangles with the previous frames. The frame to frame information allows us to extract a motion vector of the blob centroid, which we use to pre- dict the updated position of each blob. In case of ambi- guity, such as track merging due to crossing, we recalcu- late the clusters. Thus, the situations where we explicitly recalculate the entire feature vector are the following: 1) objects can move in and out of the view-port, 2) objects can be occluded by objects or by each other, and 3) com-plex depth information must be obtained.
Blue
Blue
Green
Green
Red
Red
54.3553 50.8306 69.5826
36.0035 29.6543 13.7766
35.7960 50.5023 146.6745
[image:5.595.96.501.91.346.2]11.3995 12.0335 27.3718
Figure 5. The feature vector parameters for classifying blobs.
Nor
m
di
ff
er
ence
of
cha
nne
l gr
ee
n
Norm difference of channel red
18 16 14 12 10 8 6 4 2 0
40
30
20
10
5
0
0 5 10 15 20 25 30 35 40 35
25
15
[image:5.595.58.287.376.516.2]0 2 4 6 8 10 12
Figure 6. Discrimination of the histograms of color space between blobs in taken from different frames. The x-axis is the norm difference of red, while the y-axis is the norm difference histogram for green.
positions upright or horizontal, to detect falls. These two cases are used to address anomalous behavior or simple help signals for elderly in their home environments. In order to test our histogram discriminatory technique,
video events were recorded, as shown in Figure 7.
The foreground object was subtracted from the back- ground by the methods previously described. The blob image is then eroded and we can obtain the histograms by summing all the pixels in the vertical direction. This is performed by dividing the image into equal-sized vertical stripes, and summing over all nonzero pixels within each
slice for each color channel. Figure 7 shows the detected
rectangular blobs after subtracting the background mask and the histograms of these figures.
Our analysis is based upon comparing histogram mo-ment distributions through the normalized difference of the moments of each histogram.
For each of the histograms obtained in Figure 8, and
for the histograms of Figure 9, statistical moments are
calculated and then normalized histograms (normalized both by bins and by total number of points) are obtained. Clustering can then be performed with these statistical moments.
0.16
0.14
0.12
0.08
0.06
0.04
0.02
0 0 5 10 15 20 25 30 0 5 10 15 20 25 30
0 5 10 15 20 25 30
0 5 10 15 20 25 30
0.1
0.16
0.14
0.12
0.08
0.06
0.04
0.02
0 0.1
0.16
0.14
0.12
0.08
0.06
0.04
0.02
0 0.1 0.16
0.14
0.12
0.08
0.06
0.04
0.02
0 0.1
[image:5.595.307.539.524.699.2]Simple Human Gesture Detection and Recognition Using a Feature Vector and a Real-Time Histogram Based Algorithm 284
0.1 0.2 0.3 0.4 0.5 0.6 0.7 0.8 0.9 1 0
0.06
0.05
0.04
0.03
0.02
0.01
0.06
0.05
0.04
0.03
0.02
0.01
0
10 20 30 40 50 60 70 80 90
N
or
m
aliz
ed
s
um
of
f
or
egr
ound pixe
ls
Total number of pixels
Figure 8. Basic histogram technique used for the discri- mination of the body position. The in set image demon- strates the color space normalized to unity.
2
1
-1 0 1.5
0.5
0.18 0.16
0.14 0.12
0.08
0.06 0.48 0.490.5
0.510.520.53 0.540.55
0.56
0.1 -0.5
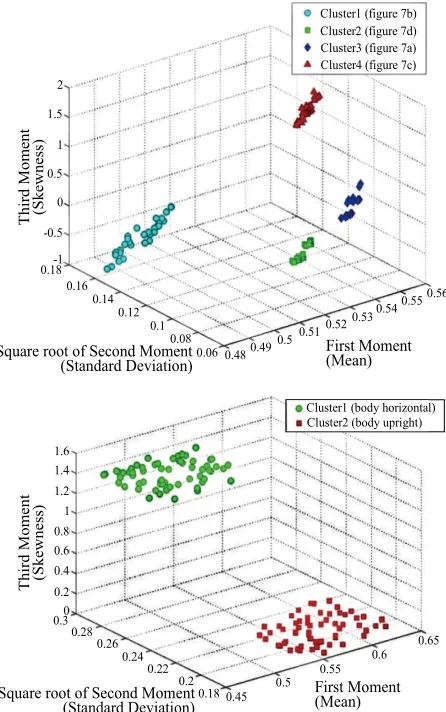
Cluster1 (figure 7b) Cluster2 (figure 7d) Cluster3 (figure 7a) Cluster4 (figure 7c)
Cluster1 (body horizontal) Cluster2 (body upright)
Thir
d Mom
ent
(Sk
ewnes
s)
Thir
d Mom
ent
(Sk
ewnes
s)
Square root of Second Moment (Standard Deviation)
Square root of Second Moment (Standard Deviation)
First Moment (Mean)
First Moment (Mean)
1.6 1.4 1.2
0.8 0.6 0.4 0.2
0.3 0.28
0.26 0.24
0.22
0.18 0.45 0.5
0.6 0.65 0.55
0.2 1
0
Figure 9. Clusters for identifying 4 groups of gestures of arms and 2 groups of body positions with a K-means clustering.
2.4. Event Discrimination
Video sequence was recorded with typical actions/events that we would like to detect, such as a person falling on the floor. From each frame in the sequence, we calcu- lated the histogram moments in the horizontal and verti-
cal direction, Hx and Hy, respectively, in order to
characterize body position. The results of comparing
y
H (the vertical histogram) for two body positions,
representing the beginning and the ending of the video
sequence, are shown in Figure 8. The inset of Figure 8
shows the histograms normalized along the x-axis to the total number of pixels.
In order to automatically discriminate the different body positions, we can compare the moments of the his-
tograms obtained (Figure 9). We use a K-Means clus-
tering [20] for the training.
We begin by identifying groups (4 clusters for the arm
gestures of Figures 2 and 7 clusters for the body posi-
tions of Figure 8) of data points in 3-dimensional space
(the 3 first statistical moments of the histograms). The
data set { , ,x1 xN} consists of N observations (N =
120 for gestures and N = 60 for body positions) with the
mean, standard deviation and skewness of the histograms. We formalize this notion introducing a set of
3-dimensional vectors k, where , for
ges-tures and
1, , 4
k 1, 2
k for body positions, in which k is
the center of the cluster k. The initial values of k are k
random values. For each data point xn, we introduce a
corresponding set of binary indicator variables
1,
n k , where k is the cluster assigned to the data
point
0,
r n
x , so that if data point xn is assigned to cluster
k then rn k, 1, and rnj 0 for . Then, we can
define the objective function for K clusters and N
obser-vations. We use a Euclidean distance given by:
i j
2 ,
1 1
N K
n k n k
n k
J
r x (8)which represents the sum of the squares of the distances
of each data point to its assigned vector k. Our goal
was to find values for the
rn k, and the
k so as tominimize J. We did this through an iterative procedure
in which each iteration involves two successive steps corresponding to successive optimizations with respect to
the rn k, and the k. Figure 9 shows the results of
dif-ferent clusters for the gestures of Figure 7 and the body
positions of Figure 8. In the test phase, we use a
k-nearest-neighbor to classify each new image (k = 3).
[image:6.595.59.286.86.271.2] [image:6.595.59.282.324.680.2]
graphical interface, the QT library is used since it pro- vides excellent cross-platform performance. Existing applications not only run on other desktop platforms, but can be extended for inclusion in web-enabled applica- tions as well as mobile and embedded operating systems without the need for rewriting source code.
All the experimental tests and development were per- formed on a standard PC, consisting of an Intel Pentium D CPU 2.80 GHz, with 2 G of RAM and using the Ub-untu 9.10 Linux operating system. Videos and images were obtained from webcam with 2 M Pixel resolution. For testing the system, many different video sequences were recorded using different lighting situations and ob-ject characteristics. A subset of them has been shown in our examples in the previous section.
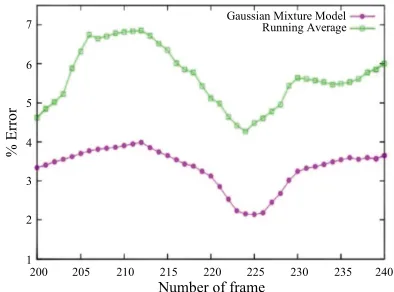
First, we performed a quantitative comparison between
two algorithms for foreground segmentation: Running
average and Gaussian mixture model. The data consisted of 1 video sequence of resolution 640 × 480 pixels, 22 seconds of duration and 25 frames per second. We se-lected the frames between 200 and 240. For each frame, it was necessary to manually segment foreground objects
in order to have a ground truth quantitative comparison.
We calculate the number of foreground pixels labelled as background (false negatives—FN), and the number of background pixels labeled as foreground (false posi-tives—FP), and the total percentage of wrongly
labelled-pixels
FN FP
640 480 . Comparisons arecom-plicated by the fact that sudden illumination changes produce shadows increasing the object size, and modern webcams constantly adapt to illumination changes.
Previously, we tested 16 configurations for modifying the Running average and the Gaussian mixture model. The Figure 10 shows the best results for the Running
average with small values for alpha (α = 0.05) and for the Gaussian mixture model with (σ = 2.5). Gaussian Mixture model always obtained the best results in all situations.
We do not perform blob clustering from frame to frame, since it would be costly, but instead we re-calculate clus- ters only when there are ambiguities (such as track cross- ings). Our histogram method for determining human body position is also costly and we are experimenting with the optimal multiple of frames (such as every 25 frames) so that we can still detect relevant body positions for real- time processing.
The Figure 11 shows the time results on a logarithmic
scale of the performance of the algorithms with a video of 30 fps and 12 seconds of duration. The results without processing are: the blue line that represents the normal video reproduction and the magenta line is the video playing with our system. The results with processing are: the red color that represents the foreground segmentation and the green line adds the time for processing blob clustering between each frame.
1 2 3 4 5 6 7
200 205 210 215 220 225 230 235 240
% Err
or
Number of frame
[image:7.595.324.521.89.235.2]Gaussian Mixture Model Running Average
Figure 10. % error of the best configuration with the running average model and the best configuration with the Gaussian mixture model.
1 10 100 1000 10000 100000 1e+06
400 100
10 1
lo
g (t
ime
in
mili
secon
ds)
log (number of frames)
“Background Foreground Segmentation”
[image:7.595.329.515.286.432.2]“Video with Qt” “Normal Video” “Blob Detection”
Figure 11. Time of the performance of the system with the different algorithms of foreground segmentation and blob detection with a clustering from frame to frame.
As shown in the previous section, the results of Figure
10 demonstrate that we can use statistical moment com-
parisons of histograms in order to discriminate between simple body positions. The testing was performed with 120 images for the gestures and 60 for the body positions, obtaining a success rate of 100% for these experiments. However, this method is not robust for discriminating between similar actions.
Thus, we have found that our simple histogram tech- niques for human body position has advantages such as: works well for some cases of interest, is easy to implement and works in real time, but it is not sufficiently robust.
4. Conclusions
Simple Human Gesture Detection and Recognition Using a Feature Vector and a Real-Time Histogram Based Algorithm 286
include additional information from sensors, providing a complete information about the patients in their homes. In this paper, however, we have restricted the study to video algorithms that shall allow us to identify body positions (standing, lying and bending), in order to ultimately trans- late this information from a low level signal to a higher semantic level.
The paper provides encouraging results and opens many possibilities for future study. In particular, in the field of foreground/background segmentation, the quan- titative comparison we described is an effective method-
ology which can be used to optimize parameters in each
model. While the feature based tracking that we used in this paper is rudimentary, a future study could combine this information with modern sequential Monte Carlo methods in order to obtain a more robust tracking.
Finally, while the histogram model developed in this paper provides detection for a limited set of actions and
events, it is a fast real-time method, similar to motion
detection systems presently employed commercially, that should have utility in real systems [19].
REFERENCES
[1] Department of Economic United Nations and Social Aff- airs Population Division, “World Population Ageing 2009,” Technical Report, 2010.
http://www.un.org/esa/population/publications/WPA2009 /WPA2009-report.pdf
[2] M. Luštrek and B. Kaluža, “Fall Detection and Activity Recognition with Machine Learning,” Informatica ( Slo-venia), Vol. 33, No. 2, 2009, pp. 197-204.
[3] H. Zhou, Y. Yuan and C. Shi, “Object Tracking Using SIFT Features and Mean Shift,” Computer Vision and Im-age Understanding, Vol. 113, No. 3, 2009, pp. 345-352. [4] W. Hu, T. Tan, L. Wang and S. Maybank, “A Survey on
Visual Surveillance of Object Motion and Behaviors,” IEEE Transactions on Systems, Man, and Cybernetics, Part C: Applications and Reviews, Vol. 34, No. 3, 2004, pp. 334-352. doi:10.1109/TSMCC.2004.829274
[5] R. Poppe, “A Survey on Vision-Based Human Action Recognition,” Image and Vision Computing, Vol. 28, No. 6, 2010, pp. 976-990.
doi:10.1016/j.imavis.2009.11.014
[6] C. Sandoval, A. Albiol, A. Albiol, V. Naranjo and J. M. Mossi, “Robust Motion Detector for Video Surveillance Applications,” Proceedings of International Conference on Image Processing, Vol. 2, 2003, pp. 379-382.
[7] P. Kaewtrakulpong and R. Bowden, “An Improved Adap-tive Background Mixture Model for Realtime Tracking with Shadow Detection,” Proceedings of 2nd European Workshop on Advanced Video Based Surveillance Sys-tems, Computer Vision and Distributed Processing, Klu-wer Academic Publishers, September 2001, pp. 1-5. [8] A. Elgammal, R. Duraiswami, D. Harwood and L. S.
Davis, “Background and Foreground Modeling Using Nonparametric Kernel Density Estimation for Visual Surveillance,” Proceedings of the IEEE, Vol. 90, No. 7, 2002, pp. 1151-1163. doi:10.1109/JPROC.2002.801448
[9] A. Mittal and N. Paragios, “Motion-Based Background Subtraction Using Adaptive Kernel Density Estimation,” Proceedings of the 2004 IEEE Computer Society Con- ference on Computer Vision and Pattern Recognition, Vol. 2, 2004, pp. 302-309.
[10] E. W. Meeds, D. A. Ross, R. S. Zemel and S. T. Roweis, “Learning Stick-Figure Models Using Nonparametric Bayesian Priors over Trees,” IEEE Conference on Com-puter Vision and Pattern Recognition, Anchorage, 23-28 June 2008, pp. 1-8.
[11] Z. Wei, D. Bi, S. Gao and J. Xu, “Contour Tracking Based on Online Feature Selection and Dynamic Neighbor Region Fast Level Set,” Fifth International Conference on Image and Graphics, Xi’an, 20-23 September 2009, pp. 238-243.
[12] D. Freedman and T. Zhang, “Active Contours for Track-ing Distributions,” IEEE Transactions on Image Proc-essing, Vol. 13, No. 4, 2004, pp. 518-526.
doi:10.1109/TIP.2003.821445
[13] R. T. Collins and Y. Liu, “On-Line Selection of Dis-criminative Tracking Features,” Ninth IEEE International Conference on Computer Vision, Vol. 1, October 2003, pp. 346-352.
[14] A. O. Balan, L. Sigal, and M. J. Black, “A Quantitative Evaluation of Video-Based 3D Person Tracking,” 2nd Joint IEEE International Workshop on Visual Surveil-lance and Performance Evaluation of Tracking and Sur-veillance, Beijing, October 2005, pp. 349-356.
doi:10.1109/VSPETS.2005.1570935
[15] D.A. Forsyth, O. Arikan, L. Ikemoto, J. O’Brien, and D. Ramanan, “Computational Studies of Human Motion: Part 1, Tracking and Motion Synthesis,” Foundations and Trends in Computer Graphics and Vision, Vol. 1, No. 2, 2005, pp. 77-254. doi:10.1561/0600000005
[16] P. F. Felzenszwalb and D. P. Huttenlocher, “Efficient Matching of Pictorial Structures,” IEEE Conference on Computer Vision and Pattern Recognition, Vol. 2, 2000, pp. 66-73.
[17] B. Kwolek, “Action Recognition in Meeting Videos Us-ing Head Trajectories and Fuzzy Color Histogram,” In-formatica (Slovenia), Vol. 29, No. 3, 2005, pp. 281-289. [18] P. F. Felzenszwalb, R. B. Girshick, D. McAllester and D.
Ramanan, “Object Detection with Discriminatively Trained Part-Based Models,” IEEE Transactions on Pattern An- alysis and Machine Intelligence,Vol.32, No. 9, 2010, pp. 1627-1645. doi:10.1109/TPAMI.2009.167
[19] G. Bradski and A. Kaehler, “Learning OpenCV: Com-puter Vision with the OpenCV Library,” O’Reilly, Cam-bridge, 2008.