ISSN Online: 2327-509X ISSN Print: 2327-5081
DOI: 10.4236/jbm.2018.611007 Nov. 19, 2018 59 Journal of Biosciences and Medicines
Age- and Gender-Specific Changes in Thyroid
Size and Thyroid Function Test Values of
Euthyroid Subjects
Tika Ram Lamichhane
1, Sandeep Prashad Pant
1, Binod Lamichhane
1, Chhabindra Gautam
1,
Sharma Paudel
2, Binod Kumar Yadav
3, Hari Prasad Lamichhane
1*1Central Department of Physics, Tribhuvan University, Kathmandu, Nepal
2Department of Radiology & Imaging, Tribhuvan University Teaching Hospital, Kathmandu, Nepal 3Department of Biochemistry, Tribhuvan University Teaching Hospital, Kathmandu, Nepal
Abstract
Background: The thyroid status is evaluated by two clinical diagnostic tests which are thyroid ultrasonography and thyroid function tests. The objective of this research is to critically analyze the age and gender based variations of thyroid volume and thyroid hormone levels in the hospital based euthyroid subjects. Methodology: A total of 221 euthyroid subjects aged 1 - 86 years were selected to observe the normal thyroid size by ultrasonography at De-partment of Radiology and the thyroid function test values (FT3, FT4 and TSH) of 2413 euthyroid subjects aged (<1)-93 years were observed at De-partment of Biochemistry, Tribhuvan University Teaching Hospital, Kath-mandu, Nepal during January 2017 to February 2018. The observed data were analyzed graphically and statistically to check the cross-correlations among the variables. Results: The best fitted equations with significant correlation coefficients and p < 0.05 provide the empirical relations between any two of the observed variables: age, thyroid lobe volumes, FT3, FT4 and TSH. The mean ± SD (p < 0.0001) of thyroid volume, FT3, FT4 and TSH are 4.74 ± 2.30 mL, 5.46 ± 0.82 pmol/L, 14.09 ± 2.71 pmol/L and 2.30 ± 0.98 mIU/L, respec-tively. Conclusion: The thyroid size first increases and then decreases whe-reas the thyroxin level first decwhe-reases and then incwhe-reases with aging. Left lobe volume is almost same for both genders and right lobe volume is higher in males. The thyroid size in menarche and menopause periods of females is larger than that of males. Such age- and gender-specific changes recommend the new reference ranges for the normal thyroid functions.
Keywords
Euthyroid Subject, Thyroid Function Test, Thyroid Hormone Levels, Thyroid How to cite this paper: Lamichhane, T.R.,
Pant, S.P., Lamichhane, B., Gautam, C., Paudel, S., Yadav, B.K. and Lamichhane, H.P. (2018) Age- and Gender-Specific Changes in Thyroid Size and Thyroid Function Test Values of Euthyroid Subjects. Journal of Biosciences and Medicines, 6, 59-73. https://doi.org/10.4236/jbm.2018.611007
DOI: 10.4236/jbm.2018.611007 60 Journal of Biosciences and Medicines Ultrasonography, Empirical Relation
1. Introduction
Thyroid hormones (TH) play the important role in the development and the maintenance of homeostasis through the interactions with autonomic nervous system and the regulations of cardiovascular and metabolic functions [1] [2]. The disorders seen in thyroid hormone regulations during embryonal and early postnatal stages can persist into adulthood also. Thyroid stimulating hormone (TSH) is an important marker to diagnose thyroid status clinically. Many studies related to the age and gender based variations of serum free thyroid hormones (TH: FT3 and FT4) and TSH have uncertainties [3] [4] [5]. As reported in [3] [5], TSH distributes in higher concentration with aging regardless the status of thyroid antibodies and the increased TSH makes impact on lipid profile influ-enced by age in both genders. There is log-linear relationship among FT3, FT4 and TSH based on age- and gender-specific responses [6].
The routine assessment of thyroid status basically relies on ultrasonographic (USG) examinations and thyroid function tests (TFT) determining the serum concentrations of FT3, FT4 and TSH. More precise and accurate parameters are to be prescribed in defining a patient’s thyroid status. There is a regional influence of iodine supply on establishing the reference ranges for the normal thyroid functioning [7]. Even a mild alteration in thyroid functioning causes psychiatric problem, weight gain or loss, atrial fibrillation and osteoporosis [8]. So, the thyroid clinical diagnosis seems to be historically sensitive. The bio-logically active life stages of females make differences in studying the working mechanism of their endocrine system. The thyroid function test report as well as thyroid size normally changes in menarche, pregnancy and menopause periods. More critically saying that the differential genetic mechanisms are potentially associated with the thyroid function regulation in both genders. In euthyroid subjects, the TFT values lie within a narrow range suggesting a unique hypotha-lamus-pituitary-thyroid (HPT) axis working under the controlled way by nega-tive feedback mechanism of thyroid cycle for each individual.
un-DOI: 10.4236/jbm.2018.611007 61 Journal of Biosciences and Medicines certainties.
There are seasonal and diurnal as well as nocturnal variations of TH-levels even in normal thyroid conditions. The serum free T3 decreases in winter season due to the accelerating disposal of thyroid hormones in cold described as the polar T3 syndrome [16]. Without any change observed in thyroid status, about 20% variation in TSH level is found [17]. The reference levels of TSH, FT3 and FT4 are slightly varying for the different constrained groups of healthy people as reported in [4] [18] [19] [20]. In a hospital based study performed at central Nepal, out of 5230 subjects ranging from early infant to elderly age, 71% of them have euthyroidism with serum FT3 = 2.3 ± 0.6 pg/mL, FT4 = 11.5 ± 2.0 pg/mL and TSH = 2.3 ± 1.1 mIU/L [20]. In another hospital based study performed in hilly region of Nepal, 76.7% of 3136 subjects have clinically diagnosed euroidism [21]. In the studies of age-based variations of serum FT4 in normal thy-roid subjects, its concentration trends to decrease slightly with aging having the smaller values for males than for females in younger age below 60 years [4] [22] [23] [24]. As the functioning of thyroid gland is influenced by secretion and reg-ulation of TSH, T3 and T4 hormones, our study is designed to analyze the cor-relation between thyroid gland volume and TFT values of euthyroid subjects along with age and gender based variations.
2. Materials and Methods
The thyroid USG of hospital based euthyroid subjects was performed at the De-partment of Radiology and the TFT values were observed at the DeDe-partment of Biochemistry, Tribhuvan University Teaching Hospital (TUTH), Kathmandu, Nepal during January 2017 to February 2018. This study was carried out by the informed consent under the guidelines of and taking authority from the Institu-tional Review Board (IRB), TUTH.
DOI: 10.4236/jbm.2018.611007 62 Journal of Biosciences and Medicines and feeding habits, and USG results: antero posterior length, craniocaudal length and width or transverse and mediolateral length, echogenicity, and disease re-lated findings of both thyroid lobes of all individuals were recorded in the pre-designed data collection sheet for further analysis.
The TFT values of 2413 clinically euthyroid subjects including 1748 females and 665 males of early infant age (<1 years) to elderly age (93 years) were ob-served to analyze the normal levels of serum free T3, T4 and TSH varying with age and sex. About 2 - 3 mL blood sample was taken from antecubital vein in a plain vial. The sample was allowed to clot and then it was centrifuged at 4000 rpm for 10 minutes to separate serum. The measurements of FT3, FT4 and TSH were done using the technique of enhanced chemiluminescence immunoassay (ECI) [28] [29] with Vitros 3600 machine. The normal reference ranges of TFT values used at the laboratory were 4.26 - 8.10 pmol/L for FT3, 10.20 - 28.20 pmol/L for FT4 and 0.46 - 4.68 mIU/L for TSH.
The statistical as well as graphical analysis was performed among the age and gender based variables such as thyroid lobe volumes, FT3, FT4 and TSH using the softwares: Origin-2017 and MS Excel-2007. The standard deviations and/or standard errors were calculated in each of the mean values. The possible linear and second order polynomials were fitted providing the related equations with standard errors in their coefficients. The degrees of correlation among the va-riables were evaluated with Pearson’s correlation test and the results with p < 0.05 were accepted as statistically significant.
3. Results and Discussion
The results from observed data and analysis are classified into three categories: ultrasonographic (USG) results, thyroid function test (TFT) results and USG & TFT cross-sectional analysis of the hospital based euthyroid subjects to explain the possible correlations among the variables such as age, thyroid lobe volumes, FT3, FT4 and TSH of males and females.
3.1. Thyroid Ultrasonographic Results
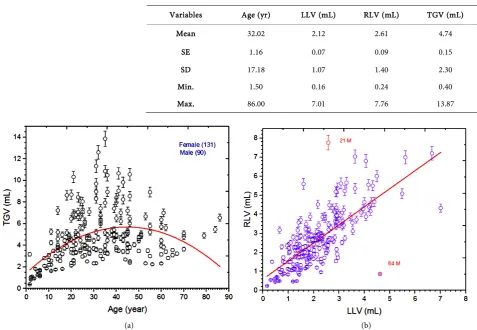
From the USG reports of euthyroid subjects having mean age 32 ± 17.18 years ranging 1 to 86 years, the mean ± SD of left lobe volume (LLV), right lobe vo-lume (RLV) and thyroid gland vovo-lume (TGV) are 2.12 ± 1.07 mL, 2.61 ± 1.40 mL and 4.74 ± 2.30 mL, respectively with p < 0.0001. Here, RLV has been found to be greater than LLV. The results with the range of normal thyroid size are listed in Table 1. The graph (Figure 1(a)) for y(TGV) vs. x(age) of the people satisfies the trendline of second order polynomial with R2 = 0.197 whose
equa-tion is
(
)
2(
) (
)
y
= −
0.002 0.0004 x
±
+
0.19 0.03 x 1.45 0.47
±
+
±
(1) where the included errors indicate the standard errors in the related coefficients.DOI: 10.4236/jbm.2018.611007 63 Journal of Biosciences and Medicines Table 1. Normal thyroid size (p < 0.0001) of the euthyroid subjects.
Variables Age (yr) LLV (mL) RLV (mL) TGV (mL)
Mean 32.02 2.12 2.61 4.74
SE 1.16 0.07 0.09 0.15
SD 17.18 1.07 1.40 2.30
Min. 1.50 0.16 0.24 0.40
Max. 86.00 7.01 7.76 13.87
(a) (b)
Figure 1. (a) Thyroid size with aging, and (b) positive correlation between right lobe and left lobe volumes. The error-bars indi-cate 5% of the measured value.
and elderly which is in agreement with the results in [13] [14] [30]. However, the mean thyroid volume excluding isthmus in our study is found to be smaller for both genders than that reported by [13] [14] [30]. Seker et al. (2010) reported the mean thyroid volume as 13.00 ± 6.27 mL for the age range of 15 - 78 years [30]. Our result for the normal thyroid size is still smaller than 6.63 ± 2.50 mL as stu-died by Kayastha et al. (2010) for the age range of 1-83 years [10].
There is a linear correlation between LLV and RLV as demonstrated in Figure 1(b). The equation of linear fit with Pearson’s r = 0.727 and p < 0.001 for y(LLV) vs. x(RLV) is
(
) (
)
y= 0.95 0.06 x± + 0.60 0.14± (2)
This means that RLV can be estimated by knowing LLV.
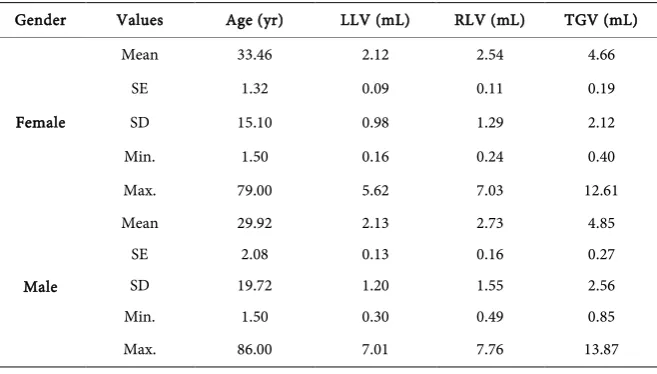
DOI: 10.4236/jbm.2018.611007 64 Journal of Biosciences and Medicines years and 5.62 ± 2.49 mL for females in the age group of 41 - 50 years as depicted in Table 2 and compared by the column plots in Figure 2(a). Here, the thyroid volume is greater for females than for males in the age groups of 11 - 20 and 41 - 50 years and otherwise, it is greater for males. It is to be noted that the age groups of 11 - 20 and 41 - 50 years for females include the periods of menarche and menopause respectively. The thyroid of healthy Nepalese people has smaller size in both genders than that reported in [30] [31]. Seker et al. (2010) reported the mean thyroid volume as 15.87 ± 7.18 mL for males and 10.94 ± 4.53 mL for females [30]. In the study of 500 healthy adults performed by Oberhofer et al. (1989), the mean TGV of males is 14.94 mL and that of females is 12.09 mL [31]. The main cause behind such variation of thyroid size is the demographic status of subjects under study.
[image:6.595.207.540.355.512.2]In this study, the mean ± SD (p < 0.0001) of LLV and RLV are 2.12 ± 0.98 mL and 2.54 ± 1.29 mL, respectively for females aged 33.46 ± 15.10 years. Similarly, for males of age 29.92 ± 19.72 years, LLV is 2.13 ± 1.20 mL and RLV is 2.73 ± 1.55 mL. The gender based minimum and maximum range of the thyroid lobe volumes with the standard errors are listed in Table 3. The variations of LLV
Table 2. Normal thyroid size (p < 0.05) averaged over different age groups.
Age (yr) Female Male
TGV (mL) SE N TGV (mL) SE N
01 - 10 1.53 0.22 8 1.86 0.25 12
11 - 20 4.27 0.43 17 3.88 0.35 21
21 - 30 4.41 0.23 32 5.54 0.52 20
31 - 40 5.31 0.40 31 7.84 0.85 14
41 - 50 5.62 0.48 27 4.74 0.19 7
51 - 60 4.40 0.73 9 4.91 0.41 9
61 - 90 4.09 0.42 7 4.93 0.56 7
Table 3. Normal ranges of thyroid lobe volumes (p < 0.0001) in males and females.
Gender Values Age (yr) LLV (mL) RLV (mL) TGV (mL)
Female
Mean 33.46 2.12 2.54 4.66
SE 1.32 0.09 0.11 0.19
SD 15.10 0.98 1.29 2.12
Min. 1.50 0.16 0.24 0.40
Max. 79.00 5.62 7.03 12.61
Male
Mean 29.92 2.13 2.73 4.85
SE 2.08 0.13 0.16 0.27
SD 19.72 1.20 1.55 2.56
Min. 1.50 0.30 0.49 0.85
[image:6.595.209.538.540.727.2]DOI: 10.4236/jbm.2018.611007 65 Journal of Biosciences and Medicines (a) (b)
Figure 2. (a) Normal thyroid size related to the gender based age groups including standard error bars, and (b) gender-specific changes in the normal thyroid size with the standard error bars.
and RLV are shown by the column plots in Figure 2(b). Here, LLV is almost same for both genders whereas RLV is higher for males than for females. In general, RLV is greater than LLV. The right handed subjects have significantly larger volume of right thyroid lobe as explained by Ying et al. (2009) [32]. Lewi-nisky et al. (1982) and Gerendai et al. (2001) suggest that there is unilateral dif-ferentiation of hypothalamus to enlarge the right lobe of thyroid gland [33] [34].
3.2. Thyroid Function Test Results
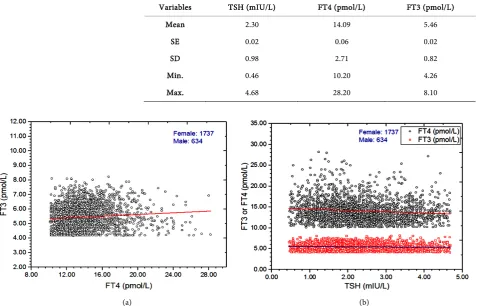
From the TFT reports of 1737 female and 634 male euthyroid subjects aged 1 - 93 years, the mean values with the standard deviations (p < 0.0001) of serum TSH, FT4 and FT3 are observed to be 2.30 ± 0.98 mIU/L, 14.09 ± 2.71 pmol/L and 5.46 ± 0.82 pmol/L respectively. The observed ranges of normal TFT values are listed in Table 4. These results are not much deviated from the TFT values of euthyroid subjects reported in Mahato et al. (2015) [20]. However, the mean value of FT4 in this study is less than that in Rohil et al. (2010) [35]. To analyze the correlations of FT3 with FT4 and that of FT3 or FT4 with TSH, the linear fits of the corresponding data are performed as shown in Figure 3. Here, the linear equation of the best fit between y1 (FT3) and x1 (FT4) with Pearson’s r = 0.095,
p-value < 0.001 and the standard errors in the slope and intercept (Figure 3(a)) is
(
)
(
)
1 1
y = 0.03 0.006 x± + 5.05 0.088± (3)
Also, the linear fit between y2 (FT3) and x2 (TSH) shown in Figure 3(b)
ob-tains the equation of a straight line (3) with the standard errors in slope and in-tercept, Pearson’s r = −0.061 and p-value < 0.001.
(
)
(
)
2 2
y = −0.05 0.017 x± + 5.58 0.04± (4)
Similarly, the equation of linear fit between y3 (FT4) and x3 (TSH) as in Figure
[image:7.595.62.538.75.255.2]DOI: 10.4236/jbm.2018.611007 66 Journal of Biosciences and Medicines Table 4. TFT values (p < 0.0001) of the clinically euthyroid subjects.
Variables TSH (mIU/L) FT4 (pmol/L) FT3 (pmol/L)
Mean 2.30 14.09 5.46
SE 0.02 0.06 0.02
SD 0.98 2.71 0.82
Min. 0.46 10.20 4.26
Max. 4.68 28.20 8.10
(a) (b) Figure 3. Linear correlations between (a) FT3 & FT4 and (b) FT3 or FT4 & TSH of the euthyroid subjects.
(
)
(
)
3 3
y = −0.31 0.056 x± + 14.81 0.14± (5)
There is a positive correlation between FT3 & FT4 whereas negative correla-tions between FT3 or FT4 & TSH. This signifies that T3 and T4 are feeded back to hypothalamus and pituitary through the blood stream and under the con-trolled mechanism on HPT-axis, T3 and T4 are produced by thyroid gland. Fi-nally, the thyroid cycle completes under with the regulation of thyroid hor-mones.
DOI: 10.4236/jbm.2018.611007 67 Journal of Biosciences and Medicines Figure 4. Age-specific changes in the normal TFT values with the standard error bars.
Table 5. TFT values averaged in the different age groups of 1748 female euthyroid subjects.
Age (yr) (<1) (1 - 10) (11 - 20) (21 - 30) (31 - 40) (41 - 50) (51 - 60) (61 - 70) (71 - 80) (81 - 100)
TSH (mIU/L) Mean 2.58 2.30 2.11 2.34 2.50 2.29 2.35 2.31 2.12 2.55
SD 0.91 0.89 1.00 0.94 0.92 0.95 1.07 1.21 0.88 1.32
FT4 (pmol/L) Mean 19.87 16.73 13.99 13.49 13.76 13.98 14.50 14.58 16.75 17.90
SD 5.63 2.82 2.74 2.13 2.49 2.42 2.65 2.49 3.84 4.15
FT3 (pmol/L) Mean 5.59 5.65* 5.62 5.46 5.32 5.33 5.40 5.04 5.19 5.64
SD 1.13 0.95 0.80 0.81 0.80 0.76 0.81 0.68 0.83 0.94
N 11 39 162 511 408 332 175 72 31 7
*The ANOVA-single factor p < 0.0001 for all of the TFT values averaged over the age groups except for FT3 = 5.67 ± 0.95 (p = 0.57) in the age group 1 - 10 years.
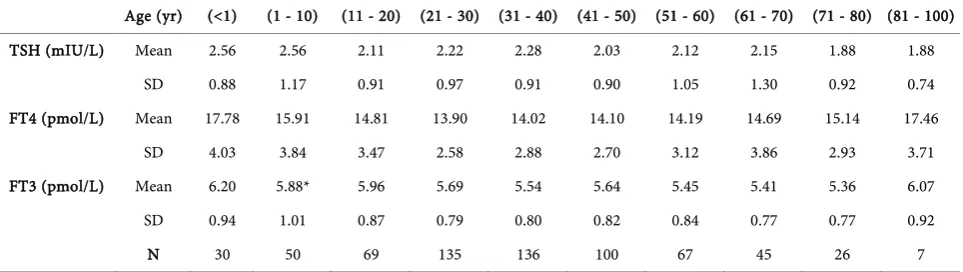
Table 6. TFT values averaged in the different age groups of 665 male euthyroid subjects.
Age (yr) (<1) (1 - 10) (11 - 20) (21 - 30) (31 - 40) (41 - 50) (51 - 60) (61 - 70) (71 - 80) (81 - 100)
TSH (mIU/L) Mean 2.56 2.56 2.11 2.22 2.28 2.03 2.12 2.15 1.88 1.88
SD 0.88 1.17 0.91 0.97 0.91 0.90 1.05 1.30 0.92 0.74
FT4 (pmol/L) Mean 17.78 15.91 14.81 13.90 14.02 14.10 14.19 14.69 15.14 17.46
SD 4.03 3.84 3.47 2.58 2.88 2.70 3.12 3.86 2.93 3.71
FT3 (pmol/L) Mean 6.20 5.88* 5.96 5.69 5.54 5.64 5.45 5.41 5.36 6.07
SD 0.94 1.01 0.87 0.79 0.80 0.82 0.84 0.77 0.77 0.92
N 30 50 69 135 136 100 67 45 26 7
*The ANOVA-single factor p < 0.0001 for all of the TFT values averaged over the age groups except for FT3 = 5.88 ± 1.01 (p = 0.86) in the age group 1 - 10 years.
[image:9.595.58.540.477.613.2]en-DOI: 10.4236/jbm.2018.611007 68 Journal of Biosciences and Medicines vironmental factors.
The age and gender based variations of TFT reports are depicted in Table 5 & Table 6 where the concentrations of the serum free TH remain almost same from 11 to 60 years in both male and female euthyroid subjects. If we draw the column plots of age dependent TH levels separately for the both genders, they follow almost same pattern as in the given Figure 4. The pattern of change in TSH is more distinct which is 2.34 ± 1.1 mIU/L for males and 1.88 ± 0.81 mIU/L for females in the age > 71 years than in other age groups. In the infant age group < 1 years, TSH as well as T3/T4 are higher in both genders. According to Franklyn et al. (1985), the age based changes in serum free TH are not much evident but FT3 is lower in females than in males aged 16 - 29 years [36]. In the study of Sujuky et al. (2012), FT3 or FT4 has negative correlation with aging of males, but no correlation in females, and TSH increases with aging in both genders [6].
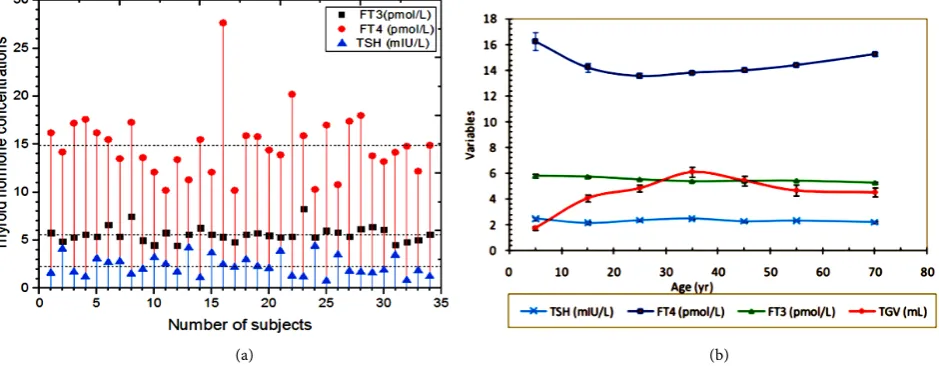
3.3. USG and TFT Cross-Sectional Analysis
In a cross-sectional study of USG and TFT values of 34 euthyroid adults (18 - 50 years), the mean ± SD (p < 0.0001) of age, thyroid volume, FT3, FT4 and TSH are 33.56 ± 11.13 years, 5.05 ± 2.06 mL, 5.62 ± 0.80 pmol/L, 14.89 ± 3.38 pmol/L and 2.31 ± 0.89 mIU/L, respectively. The cross-correlations among TSH, FT3 and FT4 have been demonstrated in Figure 5(a). Here, FT4 is exceptionally high near to the upper boundary of the given reference level without fall in TSH of 16th subject which may be related to the undiagnosed non-thyroid illness.
Oth-erwise, the serum free thyroxin (FT4) lies within the small range. In many sub-jects, the values of TSH lying below its average line are associated with the values of FT3 and/or FT4 lying above their average lines and vice versa. This is due to the negative feedback mechanism of TH to hypothalamus and pituitary to
(a) (b)
[image:10.595.67.537.496.679.2]DOI: 10.4236/jbm.2018.611007 69 Journal of Biosciences and Medicines trigger the production of thyrotropin (TSH) by means of which they are pro-duced in a controlled way from the thyroid gland.
The thyroid size and the TFT values varying with different age groups of eu-thyroid subjects are plotted in Figure 5(b). The results in this study show that FT3 and TSH remain almost constant, but FT4 decreases and then increases with aging. Conversely, the normal thyroid size increases and then decreases with aging.
Age, gender, thyroid size, FT3, FT4 and TSH are included as covariates. Lack of health awareness in rural areas, urbanization with increased environmental pollutants and reduced physical activity, socio-economic conditions, nutritional status, biologically activated life stages, mental and physical stress, and genetics play the crucial role in the thyroid malfunction and the development of meta-bolic syndrome. The alterations in thyroid functions and prevalence of thyroid diseases are higher in women than in men due to the change in lipid profile, hyperinsulinemia, android obesity, and hypertension [37]. The aging results the increased thyroid dysfunction and prevalence of metabolic syndrome. Along with the adverse changes in TFT values by estrogenic protective defects, women have higher inclination towards thyroid dysfunction than men. Moreover, the gender based changes in thyroid size can also be observed distinctly in menarche and menopause periods.
4. Conclusions
In this study, the thyroid gland of the euthyroid subjects has mean ± SD (p < 0.001) of LLV and RLV as 2.12 ± 1.07 mL, 2.61 ± 1.40 mL, respectively. RLV with higher value has significant positive linear correlation with LLV (r = 0.727, p < 0.001). TGV increases and then decreases with aging having larger value for adults than that for children and elderly. LLV of both genders is almost same, but RLV and TGV of males are larger than that of females. In the age groups in-cluding periods of menarche (11 - 20 years) and menopause (41 - 50 years) of females, the size of their thyroid gland is larger than that of males. TGV is maximum in the age group of 31 - 40 years for males and it is maximum in the age group of 41 - 50 years for females.
The TFT values of the hospital based euthyroid subjects have mean ± SD (p < 0.0001) of FT3, FT4 and TSH as 5.46 ± 0.82 pmol/L, 14.09 ± 2.71 pmol/L and 2.30 ± 0.98 mIU/L, respectively. FT3 has a weak positive linear correlation (r = 0.095, p < 0.001) with FT4. FT4 has a small degree of negative linear correlation (r = −0.113, p = 0.002) with TSH. The TFT values are higher for the early infant age group (< 1 years). FT3 and TSH are not significantly changed, but FT4 de-creases from children to adults and then inde-creases slightly to elderly in the simi-lar way for the both genders.
DOI: 10.4236/jbm.2018.611007 70 Journal of Biosciences and Medicines FT3 and FT4 have negative correlations with TSH supporting the principle of negative feedback mechanism in the thyroid cycle.
Ethical Consent and Approval
This research work has been performed under the ethical guidelines provided by and taking authority from Institutional Review Board (IRB), Institute of Medi-cine (IOM), Tribhuvan University Teaching Hospital (TUTH), Maharajgunj, Kathmandu, Nepal.
Acknowledgements
We are thankful to the head and members of Department of Radiology, De-partment of Biochemistry and Institutional Review Board-TU Teaching Hospital for their technical supports in this research work.
Authors’ Contributions
All authors were involved in the research and they read and approved the final manuscript.
Funding
This work was partially supported by Nepal Academy of Science and Technology (NAST) through a grant of PhD fellowship to the first author.
Conflicts of Interest
The authors declare that they have no conflict of interest.
References
[1] Warner, A. and Mittag, J. (2012) Thyroid Hormone and the Central Control of Ho-meostasis. Journal of Molecular Endocrinology, 49, R29-R35.
https://doi.org/10.1530/JME-12-0068
[2] Führer, D., Brix, K. and Biebermann, H. (2015) Understanding the Healthy Thyroid State in 2015. European Thyroid Journal, 4, 1-8. https://doi.org/10.1159/000431318
[3] Vadiveloo, T., Donnan, P.T., Murphy, M.J. and Leese, G.P. (2013) Age- and Gend-er-Specific TSH Reference Intervals in People with No Obvious Thyroid Disease in Tayside, Scotland: The Thyroid Epidemiology, Audit, and Research Study (TEARS). The Journal of Clinical Endocrinology & Metabolism, 98, 1147-1153.
https://doi.org/10.1210/jc.2012-3191
[4] Kratzsch, J., Fiedler, G.M., Leichtle, A., Brügel, M., Buchbinder, S., Otto, L., Sabri, O., Matthes, G. and Thiery, J. (2005) New Reference Intervals for Thyrotropin and Thyroid Hormones Based on National Academy of Clinical Biochemistry criteria and Regular Ultrasonography of the Thyroid. Clinical Chemistry, 51, 1480-1486.
https://doi.org/10.1373/clinchem.2004.047399
DOI: 10.4236/jbm.2018.611007 71 Journal of Biosciences and Medicines [6] Suzuki, S., Nishio, S.I., Takeda, T. and Komatsu, M. (2012) Gender-Specific
Regula-tion of Response to Thyroid Hormone in Aging. Thyroid Research, 5, 1-8.
https://doi.org/10.1186/1756-6614-5-1
[7] Völzke, H., Alte, D., Kohlmann, T., Lüdemann, J., Nauck, M., John, U. and Meng, W. (2005) Reference Intervals of Serum Thyroid Function Tests in a Previously Iodine-Deficient Area. Thyroid, 15, 279-285.
https://doi.org/10.1089/thy.2005.15.279
[8] Porcu, E., Medici, M., Pistis, G., Volpato, C.B., Wilson, S.G., Cappola, A.R., Bos, S.D., Deelen, J., den Heijer, M., Freathy, R.M. and Lahti, J. (2013) A Meta-Analysis of Thyroid-Related Traits Reveals Novel Loci and Gender-Specific Differences in the Regulation of Thyroid Function. PLoS Genetics, 9, e1003266.
https://doi.org/10.1371/journal.pgen.1003266
[9] Hansen, P.S., Brix, T.H., Bennedbæk, F.N., Bonnema, S.J., Kyvik, K.O. and Hegedüs, L. (2004) Genetic and Environmental Causes of Individual Differences in Thyroid Size: A Study of Healthy Danish Twins. The Journal of Clinical Endocrinology & Metabolism, 89, 2071-2077. https://doi.org/10.1210/jc.2003-031999
[10]Kayastha, P., Paudel, S., Shrestha, D.M., Ghimire, R.J. and Pradhan, S. (2010) Study of Thyroid Volume by Ultrasonography in Clinically Euthyroid Patients. Journal of Institute of Medicine, 32, 36-43.
[11]Turcios, S., Lence-Anta, J.J., Santana, J.L., Pereda, C.M., Velasco, M., Chappe, M., Infante, I., Bustillo, M., García, A., Clero, E. and Maillard, S. (2015) Thyroid Volume and Its Relation to Anthropometric Measures in a Healthy Cuban Population. Eu-ropean Thyroid Journal, 4, 55-61. https://doi.org/10.1159/000371346
[12]Ivanac, G., Rožman, B., Škreb, F., Brkljačić, B. and Pavić, L. (2004) Ultrasonographic Measurement of the Thyroid Volume. Collegium Antropologicum, 28, 287-291.
https://hrcak.srce.hr/4907
[13]Chanoine, J.P., Toppet, V., Lagasse, R., Spehl, M. and Delange, F. (1991) Determina-tion of Thyroid Volume by Ultrasound from the Neonatal Period to Late Adoles-cence. European Journal of Pediatrics, 150, 395-399.
https://doi.org/10.1007/BF02093716
[14]Hegedus, L., Perrild, H., Poulsen, L.R., Andersen, J.R., Holm, B., Schnohr, P., Jen-sen, G. and HanJen-sen, J.M. (1983) The Determination of Thyroid Volume by Ultra-sound and Its Relationship to Body Weight, Age, and Sex in Normal Subjects. The Journal of Clinical Endocrinology & Metabolism, 56, 260-263.
https://doi.org/10.1210/jcem-56-2-260
[15]Berghout, A., Wiersinga, W.M., Smits, N.J. and Touber, J.L. (1987) Determinants of Thyroid Volume as Measured by Ultrasonography in Healthy Adults in a Non-Iodine Deficient Area. Clinical Endocrinology, 26, 273-280.
https://doi.org/10.1111/j.1365-2265.1987.tb00784.x
[16]Leppäluoto, J., Sikkilä, K. and Hassi, J. (1998) Seasonal Variation of Serum TSH and Thyroid Hormones in Males Living in Subarctic Environmental Conditions. Inter-national Journal of Circumpolar Health, 57, 383-385.
[17]Raj, K.C.S. (2014) Thyroid Function Tests and Its Interpretation. Journal of Pathol-ogy of Nepal, 4, 584-590. https://doi.org/10.3126/jpn.v4i7.10318
[18]Biondi, B. (2013) The Normal TSH Reference Range: What Has Changed in the Last Decade? The Journal of Clinical Endocrinology & Metabolism, 98, 3584-3587.
https://doi.org/10.1210/jc.2013-2760
Phar-DOI: 10.4236/jbm.2018.611007 72 Journal of Biosciences and Medicines macological Sciences, 13, 341-349.
[20]Mahato, R.V., Jha, B., Singh, K.P., Yadav, B.K., Shah, S.K. and Lamsal, M. (2015) Status of Thyroid Disorders in Central Nepal: A Tertiary Care Hospital Based Study. International. Journal of Applied Science and Biotechnology, 3, 119-122.
https://doi.org/10.3126/ijasbt.v3i1.12218
[21]Dangol, R.K., Lanjekar, P. and Pulipati, C. (2017) Thyroid Function Abnormalities among Hospital Patients of Hilly Nepal. Journal of Lumbini Medical College, 5, 29-33. https://doi.org/10.22502/jlmc.v5i1.118
[22]Fontes, R., Coeli, C.R., Aguiar, F. and Vaisman, M. (2013) Reference Interval of Thyroid Stimulating Hormone and Free Thyroxine in a Reference Population over 60 Years Old and in Very Old Subjects (over 80 Years): Comparison to Young Sub-jects. Thyroid Research, 6, 13. https://doi.org/10.1186/1756-6614-6-13
[23]Chaurasia, P., Modi, B., Mangukiya, S., Jadav, P. and Shah, R. (2011) Variation in Thyroid Hormones Level among People of Different Age, Gender and Seasons, Pi-paria, Gujarat. National Journal of Medical Research, 1, 57-59.
[24]Lipson, A., Nickoloff, E.L., Hsu, T.H., Kasecamp, W.R., Drew, H.M., Shakir, R. and Wagner, J.H. (1979) A Study of Age-Dependent Changes in Thyroid Function Tests in Adults. Journal of Nuclear Medicine: Official Publication, Society of Nuclear Medicine, 20, 1124-1130.
[25]Chaudhary, V. and Shahina, B. (2013) Thyroid Ultrasound. Indian Journal of Endo-crinology and Metabolism, 17, 219. https://doi.org/10.4103/2230-8210.109667
[26]Hendee, W.R. and Ritenour, E.R. (2011) Medical Imaging Physics. 4th Edition, John Wiley & Sons, US.
[27]Abu-Zidan, F.M., Hefny, A.F. and Corr, P. (2011) Clinical Ultrasound Physics. Journal of Emergencies, Trauma and Shock, 4, 501.
[28]Fereja, T.H., Hymete, A. and Gunasekaran, T. (2013) A Recent Review on Chemi-luminescence Reaction, Principle and Application on Pharmaceutical Analysis. ISRN Spectroscopy, 2013, Article ID: 230858.
[29]Weeks, I., Sturgess, M.L. and Woodhead, J.S. (1986) Chemiluminescence Immu-noassay: An Overview. Clinical Science, 70, 403-408.
https://doi.org/10.1042/cs0700403
[30]Şeker, S. and Taş, İ. (2010) Determination of Tthyroid Volume and Its Relation with Isthmus Thickness. European Journal of General Medicine, 7, 125-129.
https://doi.org/10.29333/ejgm/82838
[31]Oberhofer, R., Ober, A., Oberkofler, F. and Amor, H. (1989) Thyroid Gland Vo-lumes of Healthy Adults in an Area with Endemic Goiter. Acta Medica Austriaca, 16, 38-41.
[32]Ying, M. and Yung, D. (2009) Asymmetry of Thyroid Lobe Volume in Normal Chi-nese Subjects: Association with Handedness and Position of Esophagus. The Ana-tomical Record, 292, 169-174. https://doi.org/10.1002/ar.20803
[33]Lewiński, A., Gerendai, I., Pawlikowski, M. and Halász, B. (1982) Unilateral Post-erior Deafferentation of Hypothalamus and Mitotic Activity of Thyroid Follicular Cells under Normal Conditions and after Hemithyroidectomy. Endocrinologia Ex-perimentalis, 16, 75-80.
[34]Gerendai, I. and Halász, B. (2001) Asymmetry of the Neuroendocrine System. Phy-siology, 16, 92-95. https://doi.org/10.1152/physiologyonline.2001.16.2.92
DOI: 10.4236/jbm.2018.611007 73 Journal of Biosciences and Medicines Study. Kathmandu University Medical Journal, 8, 231-237.
https://doi.org/10.3126/kumj.v8i2.3565
[36]Franklyn, J.A., Ramsden, D.B. and Sheppard, M.C. (1985) The Influence of Age and Sex on Tests of Thyroid Function. Annals of Clinical Biochemistry, 22, 502-505.
https://doi.org/10.1177/000456328502200506
[37]Meng, Z., Liu, M., Zhang, Q., Liu, L., Song, K., Tan, J., Jia, Q., Zhang, G., Wang, R., He, Y. and Ren, X. (2015) Gender and Age Impacts on the Association between Thyroid Function and Metabolic Syndrome in Chinese. Medicine, 94, 1-9.
Abbreviations
USG: Ultrasonography TFT: Thyroid Function Test LLV: Left Lobe Volume RLV: Right Lobe Volume TGV: Thyroid Gland Volume TH: Thyroid Hormones FT3: Free Triiodothyronine FT4: Free Thyroxine