RELATIONSHIP OF EDUCATION, UNEMPLOYMENT, AND ECONOMIC GROWTH WITH
THE POVERTY OF POPULATION
University of Timor (Unimor) Kefamenanu, Timor Tengah Utara (TTU) Regency,
Nusa Tenggara Timur (NTT) Province, Indonesia
ARTICLE INFO ABSTRACT
This research uses quantitative approach, intended to know : 1) a direct relationship between education and unemployment with the poverty of
education and unemployment wit
data were obtained from the Central Bureau of Statistics (time series) year 2000 data. By using a path analysis tool, it is proved that
as shown by the path coefficient value of
unemployment and poverty population is at 0,559, meaning that the higher the unemployment, the poorer the population is. The relationship between
is shown by
directly reduces the poverty of population as indicated by the path coefficient value of forms of r
Copyright©2017, Sirilius Seran. This is an open access article distributed under the Creative Commons Att distribution, and reproduction in any medium, provided the original work is properly cited.
INTRODUCTION
Education (formal) is a great way to improve the quality of human resources. The higher the education the higher the quality of the workforce. If all qualified workforce is actively involved in the economy, will increase the output of goods and services, which in turn drive economic growth. Economic growth, will create new investment, create jobs, absorb the labor force, which in turn will reduce the po
population.A highly qualified person who masters technology can generate added value and encourage economic growth (Backer, 1964), Adam Smith and Alfred Marshall in Kort, et al (2002:539). In his study in the United States, Denison (1967) found that 23% of US economic growth in the period of1909 1929, contributed by the increasingof the average education level of the workforce. The contribution was then increased to 42% in the period of 1929-1957. A similar study conducted by Schultz, (in his book: Capital Formation by Education He comparedturnover rate between human capital and physical capitaltowards economic growth. From this comparison, Schultz (1960) found that a fairly high proportion of output growth in the USA caused by education
investment in the development of human resources.
*Corresponding author:Sirilius Seran
University of Timor (Unimor) Kefamenanu, Timor Tengah Utara (TTU) Regency, Nusa Tenggara Timur (NTT) Province, Indonesia
ISSN: 0975-833X
Article History:
Received 22nd April, 2017
Received in revised form 14th May, 2017
Accepted 25th June, 2017
Published online 31st July, 2017
Citation: Sirilius Seran, 2017. “Relationship of Education, unemployment, and Economic Growth with the Poverty of Population
Current Research, 9, (07), 55186-55193.
Available online at http://www.journal
Key words:
Education, Unemployment, Growth, Poverty.
RESEARCH ARTICLE
RELATIONSHIP OF EDUCATION, UNEMPLOYMENT, AND ECONOMIC GROWTH WITH
THE POVERTY OF POPULATION
*Sirilius Seran
University of Timor (Unimor) Kefamenanu, Timor Tengah Utara (TTU) Regency,
Tenggara Timur (NTT) Province, Indonesia
ABSTRACT
This research uses quantitative approach, intended to know : 1) a direct relationship between education and unemployment with the poverty of population, and 2) an indirect relationship between education and unemployment with the poverty through the economic growth of the population. The data were obtained from the Central Bureau of Statistics (time series) year 2000
data. By using a path analysis tool, it is proved that education decreases
as shown by the path coefficient value of -0.238. The value of the path coefficient between unemployment and poverty population is at 0,559, meaning that the higher the unemployment, the poorer the population is. The relationship between education and unemployment to economic growth is shown by path coefficient value respectively at 0,631 and -0,270. Meanwhile
directly reduces the poverty of population as indicated by the path coefficient value of forms of relationships, either directly or indirectly are significant at the alpha level of 0,05.
is an open access article distributed under the Creative Commons Attribution License, which distribution, and reproduction in any medium, provided the original work is properly cited.
Education (formal) is a great way to improve the quality of human resources. The higher the education the higher the qualified workforce is actively involved in the economy, will increase the output of goods and services, which in turn drive economic growth. Economic growth, will create new investment, create jobs, absorb the labor force, which in turn will reduce the poverty of the population.A highly qualified person who masters technology can generate added value and encourage economic growth (Backer, 1964), Adam Smith and Alfred Marshall in Kort, et al (2002:539). In his study in the United States, Denison (1967) d that 23% of US economic growth in the period of1909-1929, contributed by the increasingof the average education level of the workforce. The contribution was then increased to A similar study conducted by ook: Capital Formation by Education-1960). He comparedturnover rate between human capital and physical capitaltowards economic growth. From this comparison, Schultz (1960) found that a fairly high proportion of output growth in the USA caused by education as a form of investment in the development of human resources.
University of Timor (Unimor) Kefamenanu, Timor Tengah Utara (TTU) Regency, Nusa Tenggara Timur (NTT) Province, Indonesia.
Neoclassicism found that economic growth is more caused by the role/contribution of labor production’s factor (labor = L) and capital (capital = C). What included in the definition of C are: finance and capital goods (machinery). Addition (combination) between L and C (assuming fi
will increase the total product (TP). At a certain level, after reaching a maximum TP; TP will decline again in line with the increase of labor input (assuming constant C). At this point when the input L continually added, it will be ulti
helpful. Output will continue to decrease, eventually will be negative as the increasing of labor input (Figure 1). Neoclassicism does not consider changes in technology (T) and the quality of labor. L and C are static (exogenous), but since the 1950s and 1960s, more research has proved the importance of technology and quality for economic growth. Nafziger (1997) in Tambunan (2003) in his research found that the contribution of L and C to economic growth for the group of new industrial countries such as Taiwan, South Korea, Hong Kong and Singapore ranges from 50% to 90%, which is reflected by the value of 'residual' i.e the value of T in the Cobb Douglas’ production function of the following:
=
Description: Yt = output level in year t;a,b= individual productivity of C and L. Residual value is considered as effectof the elements of the technology (T).
International Journal of Current Research
Vol. 9, Issue, 07, pp.55186-55193, July, 2017
Relationship of Education, unemployment, and Economic Growth with the Poverty of Population Available online at http://www.journalcra.com
z
RELATIONSHIP OF EDUCATION, UNEMPLOYMENT, AND ECONOMIC GROWTH WITH
University of Timor (Unimor) Kefamenanu, Timor Tengah Utara (TTU) Regency,
This research uses quantitative approach, intended to know : 1) a direct relationship between population, and 2) an indirect relationship between the economic growth of the population. The data were obtained from the Central Bureau of Statistics (time series) year 2000-2015 as the source of education decreases the poverty of the population, 0.238. The value of the path coefficient between unemployment and poverty population is at 0,559, meaning that the higher the unemployment, the education and unemployment to economic growth 0,270. Meanwhile the economic growth directly reduces the poverty of population as indicated by the path coefficient value of -0,590. All
elationships, either directly or indirectly are significant at the alpha level of 0,05.
ribution License, which permits unrestricted use,
economic growth is more caused by the role/contribution of labor production’s factor (labor = L) and capital (capital = C). What included in the definition of C are: finance and capital goods (machinery). Addition (combination) between L and C (assuming fixed productivity) will increase the total product (TP). At a certain level, after reaching a maximum TP; TP will decline again in line with the increase of labor input (assuming constant C). At this point when the input L continually added, it will be ultimately not helpful. Output will continue to decrease, eventually will be negative as the increasing of labor input (Figure 1). Neoclassicism does not consider changes in technology (T) and the quality of labor. L and C are static (exogenous), but 1950s and 1960s, more research has proved the importance of technology and quality for economic growth. Nafziger (1997) in Tambunan (2003) in his research found that the contribution of L and C to economic growth for the group such as Taiwan, South Korea, Hong Kong and Singapore ranges from 50% to 90%, which is reflected by the value of 'residual' i.e the value of T in the Cobb Douglas’ production function of the following:
ß
level in year t;a,b= individual productivity of C and L. Residual value is considered as effectof the elements of the technology (T).
INTERNATIONAL JOURNAL OF CURRENT RESEARCH
Figure 1 Input Variable(L) and Total Product (TP)
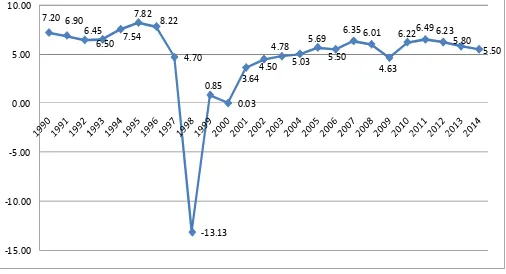
[image:2.595.315.556.59.211.2]Modern growth theory also called endogenous growth model suggests that the crucial factor is not only the production of L and C, but also including changes to the technology (T), Entrepreneurship (Ep), raw material (RM), and material (Mt). Besides, the availability and condition of infrastructure, laws and regulations, political stability, government policies (for example about government spending), the bureaucracy and the basis of international exchange (ToT). Thus, there is a fundamental difference that the modern theory considers C and L are not limited to the amount that prevailed in neoclassical theory but including quality. The quality of L not only educational level but also includes health factor. Education can be measured from the level of formal education attained, while health can bemeasured fromthe population’s life expectancy at birth (eo). Growth model that takes into account all the elements referred known as modern endogenous growth model. In the last 15 years the national economic growth of no more than 6.5%, except in the new order, the growth averaged 7%. Even in 1995 reached 8.22%. This condition does not last long; four years later, in 1999 the national economic growth plummeted to minus 13.13% (Figure 2). As a result of the political crisis and the economic crisis that occurred at that time. Population poverty rate increased to 49.50 million people (1999), while unemployment increased to 6.03 million people in the same year (Maipita, 2014).
Figure 2. National Economic Growth
Pack and Page (1994) in their empirical studies suggested that there were two main sources that drive economic growth, investment and productivity. Investments related to the use of factors of production capital (C)while the productivity refers to increased productivity through technological advances. Increased productivity of each factor of production can be calculated partially (PFP) or the calculated total for all inputs (TFP). TFP can be calculated using the Cobb Douglas production function which is transformed intoliner logarithms, by the following equation:
Ln Yt = Ln T
t+ α Ln K
t+ ßLn L
tFigure 3. Supply and Demand Workforce
Economic growth will produce a trickle down effect on other productive sectors in economy. Every 1(one) percent of economic growth can absorb 400,000 workforce (Sjafii Achmad, in Yustika 2006), thereby reducing unemployment, and poverty. Unemployment is the working age population (15-64 years old) who was trying to find a job but have not got a job. Factors causing unemployment are: (1) the low rate of prevailing wage. Labor willing to not work (= unemployed) because the rateof prevailingwage is low, so they are called voluntary unemployment (Figure 3).Figure 3 it was found that in the W2 lowest wage, the amount of supplying workforce(SN)for 2people is smaller than the demand for labor (DN) for 8 people. It means that the number of unemployed are 6 people because they are not willing to accept the prevailing wage rate. Classicism (Adam Smith) considers that this situation is only a temporaryeffect because the game of market mechanism(the invisible hand) will lead to a balance where it will occur again automatically, occurs at a wage of W5 produce SN = DN (Figure 3). (2) Mismatch between workforce skilldemand (DN) with the skill of the labor supply (SN), (3) geographic factors (residence), workers who settled in the village have limited access to information than the labor force who settled in city, (4) a shortage of effective demand (effective fever). This situation tends to reduce the company's profits and thus potentially cause unemployment. Poverty is a state of deprivation experienced by a group of people, so they were not able to enjoy proper health, higher education, and or consumption of foods that are less viable for health.Poor people do not have enough income to achievegood clothing, food, and housing. Just to meet the basic needs to be satisfied, do not pay attention to the nutritional aspects, thereforethe immune system is not strong, so they can be easily strucked by disease. This condition occurs because of low productivity, this low quality leads to lower revenue as a result of poor education.The pooreducationcaused by the low income. The poor people get stuck in a vicious circle that is called.
A study conducted by Charles Both and B.Seebohm Rowntree (Townsend, 1954) stated that families who live in poverty are grouped into two parts: (1) Families whose income is not sufficient to meet the minimum requirement, called the primary poverty, and (2) families whose overallincome is just enough to meet their physical needs, so-called secondary poverty. Rio Group (2006) classified poverty into three groups: (1) absolute poverty, (2) the relative poverty, and (3) a subjective poverty. Absolute poverty has similar meaning with primary poverty which also referred to as extreme poverty. Some countries like Nigeria, Pakistan, including Indonesia use
7.20 6.90 6.45
6.50 7.54
8.22 7.82
4.70
-13.13 0.85
0.03 3.64
4.50 4.78
5.03 5.69
5.50 6.35 6.01
4.63 6.226.49 6.23
5.80 5.50
[image:2.595.38.291.481.618.2]this concept to define population’spoverty (Maipita, 2014). Relative poverty, measured by the ratio of low-income groups with the highest income groups. Differences of income earned between the two groups explain the uneven distribution of income. On this ratio, there are some income distribution measurement criteria: (1) World Bank criteria, (2) the Lorenz curve, and (3) Gini coefficient. The World Bank classifies people into three groups: (1) 40% lowest-income population, (2) 40% of middle-income population, and (3) 20% highest-income population. The criteriaare: (1) if the 40% lowest-income residents who receive lowest-income are less than 12% of total household income inequality then it isconsidered as a high inequality, (2) if the 40% lowest-income residents who receive income of between 12-17% of total revenue is considered a moderate inequality / inequity medium, (3) but if the 40% lowest-income residents who receive income over 17% of total revenue, classified as a low inequality. Maipita, 2014 processedBPS data from 1999 to 2013 found that between 1999 and 2010 inequality of income in Indonesia was very low, but in 2011 until 2013, including income distribution was medium. In 2013 only 16.87% of the total revenue was enjoyed by 40% of the population with low incomes, while the highest-income residents enjoyed 49.04% of total revenue.
Figure 4. National Gini coefficient index (Source: Maipita, 2014)
Gini coefficient index, the highest equal to 1 (one), describes the unequal distribution of national income severe. The smaller the Gini coefficient, for instance close to zero, meaning that the more equitable distribution of income. From 1999 to 2010, Indonesia experienced a moderate inequality. The value of the average Gini coefficient was 0.3. This value increased to 0.4 in 2011 until 2013 (Figure 4). The more the gap in income distribution has been and will increase population’spoverty. The poverty line of population per capita is anassessment benchmarkof a person or group of people to be classified poor or not poor. The calculation of poverty line (PL) includes expenditures for food and non-food materials. The numbers change every year following the development of the economy, including inflation. The more advanced the economy or the higher the inflation,the higher the population’spoverty line, both in urban areas and in rural areas (Figure 5). Based on the PL it is known that in terms of the number and percentage of poor people in Indonesia it has been likely to decline since the last 5 years, due to: (1) the rapid advancement of the economy, (2) can be caused of the determination of the poverty line is too low (Maipita, 2014) (Figure 5). This study aimed to determine: (1) the relationship between education and unemployment, (2) a direct relationship between education and poverty of the population, (3) a direct link between unemployment and population’spoverty, (4) a direct relationship between economic growth and poverty, (5 ) relationship between
[image:3.595.36.291.330.467.2]education and unemployment with economic growth, and (6) the relationship between education, unemployment and economic growth with population’s poverty. Based on the research aims, the corresponding framework is created in the image below (Figure 6):
Figure 5 The poverty line and the number of poor population (National)
Figure 6. Research Paradigm
METHODS
This study uses panel data (secondary), time series the last 16 years (years 2000-2015), compiled from the Central Statistics Agency (CSA). Variables treatment and itsmeasurement including units and data sources for each of the variables appeared in Table 1 below:
This study uses path analysis techniquee(path analysis) to find a causal relationship (causal) between the research variables. The relationships of the research variables are direct and indirect.The education variable(X1), and unemployment (X2) have a direct relationship patterns, and indirect relationship with poverty variable (X4 / Y), it is stated that the pattern is indirect because education and unemployment can be associated with poverty through economic growth variable (X3). Economic growth variable acts as an intermediate variable towards population’s poverty variable (X4 / Y).Path analysis modelling proposed are: (1) formal mode, and (2) the informal model. The formal model is made in the form of formal equality with reference to the framework, made in 4 (four) blocks as follows:
Blok 1 : X2 = P21.X1 + P2r.R
Blok 2 : X3 = P31.X1 + P32.X2 + P3s.S
Blok 3 : X4/Y = P41.X1 + P42.X2 + P43.X3 + P4t.T
0.31 0.33
0.32
0.32 0.36
0.33 0.36
0.35 0.37
0.38
0.41 0.41 0.41
0 0.05 0.1 0.15 0.2 0.25 0.3 0.35 0.4 0.45
1999 2002 2003 2004 2005 2006 2007 2008 2009 2010 2011 2012 2013
0 50 100 150 200 250 300
2005 2006 2007 2008 2009 2010 2011 2012 2013 129.1
152.85 166.7
182.64
200.26 211.73 233.74
248.7 271.63
[image:3.595.308.562.350.466.2]This matrix contains the value of the correlation (r) between the variables, which will be used to analyze the path of causal relationship between the research variables. The correlationvalue is obtained by using three (3) types of analysis tools, they are: the momentproduct, the layout level analysis, and regression analysis. This is because of the types of research data are: interval, ordinal and ratio. The results of correlation matrix is shown in Table 2 below:
The hypotheses are: (1) there is a significant relationship between education and unemployment, (2) there is a significant relationship between education and poverty of the population, (3) there is a significant relationship between unemployment and population’spoverty, (4) there is a significant relationship between economic growth and population’spoverty, (5) there is a significant relationship between education and economic growth and unemployment, and (6) there is a significant relationship between education, unemployment and economic growth with population’s poverty,
RESULTS AND DISCUSSION
Recapitulation of Path Coefficient in formal type as follows Block I: X2 = -0.584X1 + 0.812r.R
Block II: X3 = 0.631X1 – 0.270X2 + 0.063s.S
Block III: X4 = 0.238X1 + 0.559X2 + 0.590X3 + 0.355t.T
The next discussion is the interpretation of the results of the analysis of the causal relationship between the variables in accordance with the formal model, informal model and hypotheses. The discussion is grouped into three (3):
Education is essentially a conscious effort made by a person or group of people (residents) to improve skills. Improving the ability not only through formal education, but also through non-formal, and informal.A person whogot education (formal) to graduate college has the intellectual ability which is relatively higher than those who only finished high school. Variations flexibility in determining the choice of type and or jobs for their high quality due to highly educated are more open. They are relatively selective in choosing jobs. The size / wage levels, and the comfort of the workplace environment, could be a trigger factor of this. Even some of them would prefer to be unemployed (temporarily) than to work. This type of unemployment is known as a sort of temporary unemployment.Long period of time of being idle (voluntary unemployment) is very relative, depends on several things including: (1) family support (finance), (2) the estate, and (3) they have (savings) .If these three factors changed or reduced the unemployed will soon be entering a workplace. At this point the ability to choose the type of work tends to decrease. Whatever the job, and with the prevailing wage leveladjustment will occur naturally, this is what is known as the law of "trade off", cancels between needs and wants. In contrast to the low-educated population, they do not have much choice. The type of work that is labeled 3 things,
smelling, risky, and dangeroushave to be chosen. This group of
[image:4.595.109.469.73.327.2]workers exceeds the number of highly educated. Table 3 show that the percentage of unemployed workers with low education (≤ elementary school) tends to decline between 2004-2009, then increased again until 2014. The senior high educated unemployed, tend to be more stable, the lowest in 2013 was 39.96 percent, and rose again to 45.48 percent in 2014. While the highly educated unemployed is much lower than the primary and secondary education.
Table 1. Variable Treatment and Source of Data
Variable Measurement Unit Source of Data
Formal education attained (X1) 1. ≤ Junior High Total CSA
2. Senior high 3. University
Unemployment (X2) Unemployment level % CSA
Economic(X3) growth population’s poverty (Y)
Growth level % CSA
Population under the poverty line % CSA
[image:4.595.105.491.355.408.2]Figure 7 Informal Model
Table 2. Correlation Matrix (data sheet for data analysis)
Poverty (Y/X4) Education (X1) Unemploymen growth (X2) Econ.Growth (X3)
Poverty (Y/X4) 1.000
Education (X1) -0.924 1.000
Unemploymen (X2) 0.602 -0.535 1.000
The lowest was in 2004 at 5.58 percent and a high of 13.63 percent in 2010. It means thatthe time/waiting period for highly educated workforceis relatively less when compared with the low educated workforce (elementary, middle, high school). Results of statistical analysis using series panel-time data the last 10 years resulted in a negative relationship between education (formal) and unemployment, with the value of the path coefficient (standard beta) of -0.584 and value Sign 0.001, smaller than 0,005 alpha, so the first hypothesis proved significant. This means that the higher the educational attainment the more likely a person to obtain / acquire a job.The close relationship between two variables relatively strong, characterized by coefficient value of regression, 0.584. The result of path analysis for education and unemployment variables is shown in the following models:
[image:5.595.96.463.59.224.2]R.0.659
Figure 9 Causal relationship between education and unemployment
[image:5.595.76.525.270.354.2]The residual value 0.659, illustrates that 66 percent of unemployment is influenced by other variables not included in this model, or in other words 34 percent (= (R²) unemployed is caused by education factor. Economic growth is a result of the factors of education and unemployment. Education makes people (labor) to be qualified. The higher the education, someone will have a higher quality. A qualified workforce will produce output of goods and services in greater numbers and better quality. Philip Steven (2003) in his study of G7 countries found that improving the quality of employment has a positive relationship with the growth of output. The higher the quality of the workforce the higher the contribution to economic growth. Improving the quality of labor in Japan for examplearound 1.16 percent will be able to contribute the growth of output by 0.79 percent, and the growth of output per capita of 5.39 per cent. Whereas in Italy by improving the quality of 0.19 per cent itcontributed to the growth of only 0.12 percent of output (Table 4 and Figure 10). While Psacharopoulos (1985) using data from year 1960 to 1977argued that the amount of GNP /capita is influenced also by the ability of labor, measured by the ability to read (literacy).
[image:5.595.120.479.391.514.2]Figure 8 Informal Model: Causal-relationship between variables
Table 3. Percentage open unemployment based on last education (formal) attained, 2004-2014 (Indonesia)
Source : Survey Angkatan Kerja Nasional(Sakernas)2004-2014
Table 4 The relationship between the quality of manpower with output growth
[image:5.595.70.262.729.776.2]South Korea with 43.6 percent literacy to get the growth of GNP / capita added up to 7.6 percent, bigger than Portugal and Spain with a GNP / capita respectively 5.7 percent and 5.3 percent for literacy was only 1.7 percent, and 1.2 percent.The study also gives a consistent result that education has a positive relationship with economic growth despite educational variables combined with unemployment variable to economic growth. The value of beta coefficient standardized is 0.631 with an alpha of 0.031, so that the second hypothesis is also accepted that education has a significant relationship with economic growth. A standardized beta coefficient between unemployment and economic growth was negative with -0.270. The greater the unemployment tends to potentially reduce economic growth.
[image:6.595.95.503.59.256.2]This relationship is significant, Sign value 0.001 less than the 0.005 probability value shows that the third hypothesis also proved acceptable. The working age population that is not working (unemployed) including the elderly, do not produce for development, but at the same time they also need food, clothing, and housing. This group needs financed by the productive age population. The larger the population of unproductive the greater the burden to be borne by the productive population. In the year 2010 (CSA-2010) Dependency Ratio (DR) to Indonesia case was 51.31 smaller than that what was experienced byNTT province, andNTB province, respectively by 73.21, and 55.52. This means that the population of productive ageand produced in NTT have a greater load of dependence than NTB, and Indonesia.
[image:6.595.217.380.293.392.2]Figure 10. The relationship between the quality of manpower with output growth
Figure 11. Causal relationship between education and unemployment to economic growth
Figure 12. Economic Growth and Unemployment,Year 1996-2011
0 1 2 3 4 5 6 7 8
Kanada Perancis Jerman Italy Jepang United
Kingdom United
State
The Growth of Output/Capita
Contribution to output Growth
% Increase in The Quality of Labor
(15.00) (10.00) (5.00) -5.00 10.00 15.00
1996 1998 1999 2000 2001 2002 2003 2004 2005 2006 2007 2008 2009 2010 2011
Growth
[image:6.595.102.502.425.601.2]Theoretically unemployment tends to reduce economic growth, or economic growth can reduce unemployment. Unemployed means not generate for economic development and tend to reduce output per capita and economic growth, which could ultimately cause poverty. Economic growth, judged by additional output from the productive sectors of the economy can reduce unemployment. Each 1(one) percent additionalineconomic growth will absorb 400.000 workers in the manufacturing sector (Yustika, 2006). Data released by CSA (2012) that the amount of additional labor force during the period from 1996 to 2011 far exceeded the ability of economic growth to absorb them. Even during that period the percentage of people who are unemployed is greater than the economic growth (Figure 12). Spending on education is a financinginvestment, usefulness obtained or enjoyed in the days to come, after completing one's education and entering the labor market. Boediono et al (1992) tried to calculate the rate of return of vocational education and general for the province of East Java, West Sumatra, andNTT province.Variations in education returns both SRR, and PRR in West Sumatra higher than the East Java province, andNTT. This difference may reflect that the quality of the education process and output in both province is lower than that occurred in the province of West Sumatra. Another interesting thing is the SRR, PRR received by those from private schools is relatively higher than the School organized by the Government. It means that the quality of schools organized by the Foundation (Private) is relatively higher than the School organized by the Government. The value of the SRR / PRR can explain about the quality of the output. Both have a positive relationship, meaning that the higher the education the higher the quality of the value SRR / PRR obtained. Or in other words, labor productivity is assessed on the amount of output produced depends on the quality of education. The higher the quality of the graduate/higher labor productivity, resulting in greater revenues, which can reduce poverty. This study found that between education (formal) with poverty has a negative correlation. Beta coefficient standardized value is -0238, and it is significant. The higher the education the lower the population’s poverty.
Fig. 13. Causal relationship between education, unemployment and economic growth, to poverty population’s
The amount of the output produced by labor in the economy is an indicator to assess the level of economic growth. Economic growth is assessed from the amount of GDP (Gross Domestic Product), generated by all productive sectors in high economy.The higher PDRB the higher the economic growth. Economic growth can absorb the labor force, reduce unemployment, and population’s poverty. In this study,it is found that the value of standardized beta coefficient lines -0.590 illustrates that higher economic growth can reduce population’spoverty. This relationship is significant, with Sign
value 0.001 alpha which is smaller than 0.005, so the hypothesis is accepted. This means that the higher the economic growth the lower thepopulation’spoverty. Several other studies found that between economic growth and income distribution are negatively related. This means thathigher economic growth has created more population’spoverty because income distribution is uneven. Maipta, (2014)in his research found that 20 percent ofpopulation with highest income received over 40 per cent of the national income, 40 percent of the lowest income received only around 20 percent, and 40 percent of middle-income population received around 36 percent of national income. Gini coefficient index with the average 12.32 per cent is less than 0.05 so that the unequal distribution of national income is medium. However, when observed more closely the greater the income earned by the highest income population (20%), the greater the Gini Coefficientindex. It means that the greater inequality in line with the more revenue generated the highest income population. Poverty can occur because of many working-age population do not work (unemployed), as a result of lack of education, the next effect is to reduce economic growth, and increasing poverty of the population. The results of path analysis (Figure 13) shows that unemployment variable has a positive relationship with poverty, with the path coefficient value (standardized beta coefficient) of 0.559, and the Sign value 0.001 so that the relationship is significant. These three variables: education, unemployment, and economic growth simultaneously have a very strong relationship, with regression coefficient value of 0.935. While the determinant coefficient value is 0.874, meaning that 87 percent of the population’spoverty is affected by the model, which was formed, with the residue of 35 percent.
Conclusion
Education (formal) as an investment, produces benefits that will be enjoyed in a few years later. The high quality of human resources is one of determining factorsin the world of work. A qualified workforce has a shorter waiting period to enter the labor market, compared with less qualified workforce. Productivity of qualified labor will increase by thetime passwhich can increase GNP and economic growth, which in turn will reduce population’spoverty. The testing of the hypothesis in this study are all significant.
REFERENCES
Boediono et al. 2006. Education Economic and Social Development : Secon Edition 25. Year Development Plan, Back Ground Paper and Goals. Jakarta. Pusat Informatika Balitbang-Dikbud.
BPS 2010. Susenas, 2012. Penduduk Miskin Tahun 1970-2013. http://www.bps.go.id/subjek/view/id/6#subjekview Tab3/accordion.daftar-subjek1/diakses 21 Februari 2017 BPS 2012. Tambahan Angkatan Kerja 1996-2011/diakses 23
Februari 2017.
BPS Sakernas 2004-2014. Pengangguran Terbuka Berdasarkan Pendidikan(formal) Terakhir yang ditamatkan/ http:// www.google.com/search/diakses 21 Februari 2017.
BPS Statistik Indonesia-Statistical Yearbook of Indonesia. 2012. Istamat.info/files/upload/47407/Statistical_year book_of_indonesia_2012.pdf/diakses 22 Februari 2016 BPS, 2010. Pengangguran Terbuka Menurut Pendidikan
Tertinggi yang Ditamatkan, tahun 2004-2014. http://www.
bps.go.id/subjek/view/id/6#subjekviewTab3/accordion.daft ar-subjek1/diakses 21 Februari 2016
Elfindri & Nasri Bachtiar, 2004. Ekonomi Ketenagakerjaan. Padang.Universitas Andalas. George Psacharopoulous-2001.The Contribution of Education to Economic Growth : International Comparisons/www.sus.edu/indiv/I/langd/ Psacharopoulous2.pdf./diakses 22 November 2017.
Fox, M.F.1992. Research Teaching, and Publication Productivity : Mutualy versus competition in academia. Sociology of Education, 65(4) : 293-305
Maipita Indra, 2014. Mengukur Kemiskinan dan Distribusi Pendapatan. Yogyakarta. UPP STIM YKPN.
Mangkunegara A.A. Anawar Prabu, & Mela Puspitasri, 2014.Kecerdasan Emosi Guru, Stres Kerja, dan Kinerja Guru SMA. Jurnal Kependidikan Vol.45.No.2.Nov.2015. http://journal.uny.ac.id/index.php/jk. Diakses 24 Mei 2016. Najib Ahmad and Bety Nur Achadiyah.2012.Pengaruh
Pendidikan Karakter Terhadap Prestasi Belajar Siswa. Jurnal Ekonomi & Pendidikan.Vol.9,No.1.2012. http://journal. uny.ac.id/ index.php/jk. Diakses 25 Mei 2016.
Nurdin, 2014. Pengaruh Metode Penyuluhan dan Tingkat Pendidikan Terhadap Pengetahuan Berwawasan Lingkungan. Jurnal Ilmu Pendidikan Vol.20.No.2. Malang. UM-Press.Parhah, Siti.2012. Pengaruh Ekspansi Pendidikan Tinggi Terhadap Ketimpangan Pendapatan di Indonesia. Jurnal Pendidikan Ekonomi, Vol.7 No.2. Bandung. JupeUPI Press.
Philip Stevens dan Martin Weale, 2003. Education and Economic Growth. National Institue of Economic and Social Research2 Dean Trench Street, London Swip 3He/cee./se.ac.uk/comference_papers/28_11_2003/martin_ weale.pdf. diakses 22 Februari 2016.
Rio Group, 2006. Compendium of Best Practices in Poverty Measurment. Expert Group on Poverty Statistics. Rio Jeneiro.
Sankaran, S.R. and Bui, T.2001.Impact of Learning Strategies and Motivation on Performance : A Study in web-based Instruction. Journal of intrutional Psychology, 28(3): 191-198.
Sasetyowati Tyas, dan Susanti Kurniawati, 2012. Faktor-faktor yang Mempengaruhi Pendapatan Pedagang Sembako(studi pada pedagang pasar pananjung). Jurnal pendidikan ekonomi. Vol.7 No.2.Bandung. Jupe UPI Press.
School of Economics and Political ScienceStable URL. http:// www.jstor.org/ stable/587651/diakses 23 Februari 2016. Schultz, T.W. 1964. Capital Formation by Education. Journal
of Political Economy. http//.uvm.edu/diakses,tanggal 20 Februari 2016.
Tambunan Tulus T.H.2003. Perekonomian Indonesia-Beberapa Masalah Penting. Jakarta. Ghalia Indonesia. Townsend, Peter.1954. Measuring Poverty. The British Journal
of Sociology.Vol.5 No.2 June 1954,pp.130-137. Published by : Blackwell Publishingon behalf of the London
Yustika Ahmad Erani. 2006. Perekonomian Indonesia, Deskprisi, Prediksi, dan Kebijakan. Jawa Timur. Bayu media publishing.