doi:10.4236/jwarp.2011.311089 Published Online November 2011 (http://www.SciRP.org/journal/jwarp)
Developing a Framework to Measure Watershed
Sustainability by Using Hydrological/Water Quality Model
Aditya Sood1*, William F. Ritter2
1Currently at International Water Management Institute (IWMI), Colombo, Sri Lanka 2Department of Bioresources Engineering, University of Delaware, Newark, USA
E-mail:*[email protected]
Received September 1, 2011; revised September 30, 2011; accepted October25, 2011
Abstract
A framework is built, wherein hydrological/water quality model is used to measure watershed sustainability. For this framework, watershed sustainability has been defined and quantified by defining social, environ-mental and biodiversity indicators. By providing weightage to these indicators, a “River Basin Sustainability Index” is built. The watershed sustainability is then calculated based on the concepts of reliability, resilience and vulnerability. The framework is then applied to a case study, where, based on watershed management principles, four land use scenarios are created in GIS. The Soil and Water Assessment Tool (SWAT) is used as a hydrology/water quality model. Based on the results the land uses are ranked for sustainability and pol-icy implications have been discussed. This results show that landuse (both type and location) impact water-shed sustainability. The existing land use is weak in environmental sustainability. Also, riparian zones play a critical role in watershed sustainability, although beyond certain width their contribution is not significant.
Keywords: Sustainability, Development, Framework, Watershed, Resilience, Reliability, Vulnerability, Hydrological Models Application, Landuse
1. Introduction
The concept of sustainable development has been there since the mid twentieth century but it was promoted by UNEP in the 70s and later by the World Bank in the early 80s. Sustainability implies maintaining natural re-sources for future generations and sharing them in an equitable manner in the current generation [1]. In reality there is no clear consensus on how to achieve develop-ment that can be considered sustainable [2]. Some schol-ars try to define sustainability based on the level of sub-stitution of human and non-human capital allowed [3,4]. Others have defined sustainability from urban perspec-tive [5,6]. Wackernagel and Rees [7] look at sustainabil-ity from an ecological perspective. Vliet [8] suggests nine principles of sustainability whereas Afgan [9] has done a good job of compiling a set of definitions of sus-tainability from different organizations and perspectives. Goodland [3] broke the sustainability debate into three paradigms—technocentric paradigm, ecocentric paradigm, and sustaincentric paradigm. Another way to look at sus-tainability is by broadly classifying it as social, economic and environmental [10]. Each class of sustainability
fo-cuses on maintaining its own capital. From human soci-ety’s perspective, natural capital can be considered as a “stock of environmentally provided assets” that provide useful service to humans [3]. From the ecological per-spective, natural capital includes all the living and non-living (like air, water, soil) matter. Out of the three classes of sustainability, environmental sustainability takes precedence [4]. Social and economic sustainability depends upon the success of environmental sustainabil-ity.
perspective. Finally, the ecological approach also in-cludes ecological models along with other models and monitoring techniques. Within these four groups, four major international models have been developed.
“Framework for the Development of Environmental Statistics (FDES) developed by the United Nations Sta-tistical Office, relates environmental components to four information categories—social and economic activities, natural events; environmental impacts of activities/events; responses to environmental impacts; and inventories, stocks and background conditions. Pressure-State-Re- sponse (PSR) framework developed by the Organization for Economic Cooperation and Development (OECD), has three components that are measured by indicators— pressure that the human society puts on the environment; the resulting state or condition of the environment; and the response of the society to these conditions. It forms a closed loop since the response of the society further im-pacts the environment. The Driving Force-State-Re- sponse (DSR) framework developed by the Commission on Sustainable Development, groups the indicators in three categories—driving force indicators deal with hu-man activities and processes that impact the environment; state indicators measure the state of sustainable devel-opment; and the response indicator looks at the policies and other responses to the state of environment and de-velopment. Agenda 21 is based on this framework. The Driving Force-Pressure-State-Impact-Response (DPSIR) framework developed by the European Environmental Agency (EEA) and the Statistical Office of the European Communities (Eurostat) is a further enhancement of PSR and DSR framework. It breaks up indicators into five groups—driving force that deals with social, economic and demographic development; pressure measures the processes that have harmful effect on the environment; state indicators deal with the state of environment; im-pact indicators measure the imim-pact of the state of the environment on society; and response is the reaction of various organizations and society.
To bring the debate of sustainable development from out of the theoretical realm and make it useful, sustain-ability indicators are required. These indicators are af-fected by the cultural, technical, economical, physical and social conditions [2]. Heintz [12] suggests four ma-jor categories of indicators—system capacities and their allocation, consequences of water allocation, effects on people and underlying processes and driving forces. Af-gan [9] suggests grouping the indicators for each subsys-tem and then combining them into a sustainability indi-cator. Indicators should be large enough to be compre-hensive but small enough to be practical and under-standable [13]. Each region or watershed will have to
come up with its own set of sustainability indicators but the underlying principle has to be the same. Barlow et al. [14] define water sustainability as the “development and use of water resources in a manner that can be main-tained for an indefinite time without causing unaccept-able environmental, economic, or social consequences”. Gleick [15] defines sustainable water use as “the use of water that supports the ability of human society to endure and flourish into the indefinite future without undermin-ing the integrity of the hydrological cycle or the ecologi-cal systems that depend on it”.
790
2. Methodology and Data Description
For this research, the following steps were followed: Step 1: River Basin Sustainability Index was defined and developed (discussed in Section 4);
Step 2: The calibrated and validated watershed model was developed (not covered in this paper);
Step 3: Land use scenarios were created by using GIS (discussed in Section 5.2);
Step 4: The land use of the calibrated model was re-placed with each scenario and the model run for 50 years;
Step 5: The River Basin Sustainability Index was mea- sured for each land use scenario; and
Step 6: Resilience, Reliability and Vulnerability was measured for each land use scenario.
SWAT2000 version incorporated in the EPA’s Better Assessment Science Integrating point and Nonpoint Sources (BASINS) (version 3.1) was used in the case study to model Millsboro Pond watershed in Inland Bays basin in southern Delaware region of USA. To analyze a watershed, the model divides it into sub-watersheds based on topography. The sub-watersheds are further divided into hydrologic response units (HRU) based on similar land use and soil properties. Major components of the model are hydrology, weather, erosion, soil tem-perature, crop growth, nutrients, pesticides, and agricul-ture management [17]. The water balance is the driving force behind all of model simulations. Hydrology simu-lation is based upon two divisions—the land phase of the hydrological cycle (which includes movement of water, nutrients, pesticides from precipitation till the main channel); and the water or routing phase of the hydro-logical cycle (which includes movement of water, nutri-ents and pesticides through the channel network to the watershed outlet) [18]. Surface runoff and infiltration are calculated from the modification of the Soil Conserva-tion Service (SCS) curve number method or Green and Ampt infiltration method (but this method requires sub- daily precipitation data). SWAT can estimate evapotran-spiration by one of the three methods: Modified Penman Montieth, Hargreaves, and Priestley-Taylor. Sheet ero-sion and sediment yield are calculated based on the Modified Universal Soil Loss Equation (MUSLE). Chan- nel sedimentation routing is estimated based on the mo- dified version of Bagnolds sediment transport equation, which uses flow velocity to estimate transport concentra-tion capacity. SWAT profiles the soil in multiple layers. Soil water processes include infiltration, runoff, evapora-tion, plant uptake, lateral flow, and percolation to lower layers. Nitrogen and phosphorus processes are handled in a similar manner as in the Erosion Productivity Impact Calculator (EPIC) model. Use of nitrogen and
phospho-rus by biomass from the soil is based upon supply and demand. Plant’s nitrogen (N) demand is a function of total biomass and the N concentration in the biomass. Supply is based on N in the soil. Nitrogen in the water is calculated as a product of nitrogen concentration and volume of water. Dissolved phosphorus is calculated based on the concept of partitioning phosphorus into solution and sediment phases. It uses labile P concentra-tion in the top 10 mm of soil, runoff volume and a phos-phorus soil-partitioning coefficient. Stream nutrient dy-namics uses the kinetic routines from the water quality model QUAL2E. SWAT also allows simulation of land management practices. Management practices are broadly divided into agriculture management, water management and urban areas. Some of the management practices in agriculture management include plant growth cycle, timing of fertilizer, type of tillage, pesticide application, and removal of plant biomass. The crop model is a sim-plification of the EPIC crop model. Water management includes irrigation, tile drainage, impounded/depress- sional areas, water transfer, consumptive water use, and loading from point sources. For the urban areas, the model estimates quantity and quality of the runoff based upon the impervious cover that are either directly con-nected to the drainage system and those that are not di-rectly connected.
Response in Delawares’ Inland Bays Ecosystem” (CIS-Net) and the “Inland Bays Tributary Total Maximum Daily Load” (IBTMDL) projects and has data from 1998 to 2002. For land use land cover (LULC), National Land Cover Database (NLCD) 2001 land cover was used. NLCD has been created through a cooperative project conducted by the Multi-Resolution Land Characteristics (MRLC) Consortium.
SWAT uses its own weather generator, which is based on the WXGEN weather generator model. The weather generator is used either to predict weather information in the future or fill in the gaps in the existing weather data. The accuracy of this weather generator was not evaluated in this study, but it has been widely used in multiple studies (e.g. most of the studies using SWAT model [19, 20]. Although there are shortcomings with this generator but this is still popular stochastic model that is available [21]. Additionally, the focus of this research is on the framework of sustainability and a more reliable weather generator, when available, can be used in future studies. For the weather generator to function, an input file con-taining the statistics of the historic weather needs to be input. It is recommended to use at least 20-years’ worth of historic data. For this research, 50 years of historic data, i.e. from 1958 to 2007 was used. The historic weather data was collected from the same weather sta-tion (i.e. Georgetown station) that was used to calibrate and validate the model. A program called WXPM3020, developed and supported by the staff of SWAT devel-opment team, was used to generate the statistical values to be input in the SWAT weather generator model. Be-fore using WXPM3020 program, the historic weather data was run through another program called WXGN3020, which simulates any missing data. The output from WXPM3020 was used as an input for the .wgn file in SWAT.
3. Framework
Development in the context of this research means change in land use from its natural function to provide goods and services to the mankind. The change in land use can be either development for residential, commercial, recrea-tion or agriculture purposes. Sustainability in a water-shed context means development of the waterwater-shed so as to provide at the minimum the basic services to its stakeholders at all the times (including drought) without compromising the quality of water, its ability to perform its ecological function and reserving sufficient resources for the biodiversity to proliferate. Goods and services provided by the development is the economic benefit to the community. Basic services provided by water to
hu-manity are safe water for drinking, water for sanitation, water for livelihood (either agriculture or manufacturing). The term “all the times” is significant for sustainability. Water, being a natural resource, is an uncertain commod-ity. Droughts and floods create stress in the watershed— both to humans and non-human population. The devel-opment of a watershed can be called sustainable only when it can “cope with and recover” from these stresses. Hence the goal of water sustainability is not to have enough water available all the time, but rather have the system in place so as to adapt to the changing water sce-nario in a region. The system should be resilient enough to recover from occasional drought or floods and hence be less vulnerable to the whims of nature. Also, from an ecological perspective, there is a minimum amount of water required to fulfill its ecological obligations espe-cially for aquatic systems. During the extreme conditions, these obligations should be met to a level so as not to impact the biota adversely. Finally, since land use is the main management tool in the watershed management, it is necessary to consider the continuity of undeveloped areas in a watershed so as to provide an undisturbed ha-ven to the local wildlife. Giha-ven enough space and re-sources, the local wildlife can prosper as long as there is no interference from the humans. Fragmentation of wild-life habitat can adversely interfere with biodiversity. Hence continuity of human-interference-free land use can lead to sustaining the biodiversity of the region (this is a narrower view of biodiversity—a broader view would include consideration at eco-region scale).
3.1. Reliability, Resilience and Vulnerability
Sustainability in a water system can be measured in terms of reliability, resilience and vulnerability [22]. It can be measured in terms of the time required by the system to return to the equilibrium state after it has been disturbed from the equilibrium (also called “engineering resilience” [23]). Klein et al. [24] consider vulnerability to be “degree of incapability to cope with” disturbances. While the resistance is the ability of the system to avoid disturbance, the resilience (as discussed above) is the system’s capacity to respond. Fara [25] uses the defini-tion of vulnerability as “the characteristics of a person or group in terms of their capacity to anticipate, cope with, resist and recover from the impact of a natural hazard”.
792
times the system fails (i.e. indicators fall outside the pre-defined acceptable limits). Thus reliability has been defined as the probability of a system to be within the range of satisfactory values over a period of time under consideration. Resilience has been defined as a measure of the “speed of recovery” from an unsatisfactory condi-tion. Finally vulnerability has been defined as the statis-tical measure of the extent of failure. These three pa-rameters can be used together to measure sustainability in a quantitative way.
3.2. Indicators for Watershed Sustainability
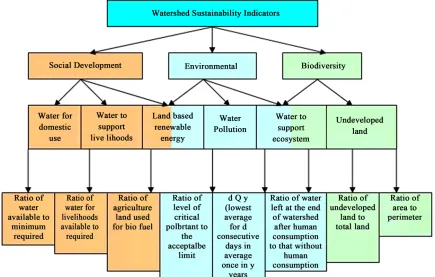
[image:5.595.80.515.424.701.2]Indicators for watershed sustainability can be divided into social development, environment and biodiversity (Figure 1). For this framework, it has been assumed that the economic system is constrained by the availability of the natural resources (land and water to support liveli-hoods). As long as these resources are used in a way to provide for livelihood, it will lead to economic wellbeing. Since the issues related to watershed sustainability are region specific, the indicators should measure the per-formance of the region relative to its requirements. Thus two regions with very different hydrological profile may be equally sustainable because the demands within the watershed may be different. The indicators are defined in Table 1. The range of all the indicators are from 0 (worst
case) to 1 (best case).
3.3. River Basin Sustainability Index (RBSI)
As discussed earlier, river basin sustainability incorpo-rates social, environmental and biological sustainability. Hence river basin sustainability index can be created by summing up the social, environmental and bio-diversity indicators as discussed above. Based on the region, some indicators could be more critical than others. Thus a proper weight needs to be applied to these indicators based on the subjective judgment regarding the issues for the region under study. This is shown in the following equation:
IWS = WWD*IWD + WWL*IWL + WRE*IRE
+ WWP*IWP + WWE*IWE + WUL*IUL,
where Wx is the weightage for “x”.
The RBSI gives a measure of the watershed’s sustain-ability on an annual basis. A natural system cannot be sustainable all the time. During extreme events like drought or flooding, a system becomes unsustainable. Applying the analogy of sustainable livelihoods to tainable watershed, a good measure of watershed sus-tainability is the ability of the system to cope and even-tually recover from the stresses of such extreme (non- sustainable) events.
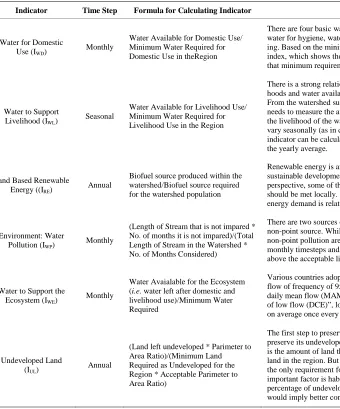
Table 1. Descriptions of indicators used in this study.
Indicator Time Step Formula for Calculating Indicator Comments
Water for Domestic Use (IWD)
Monthly
Water Available for Domestic Use/ Minimum Water Required for Domestic Use in theRegion
There are four basic water needs for humans: drinking water, water for hygiene, water for sanitation, and water for cook-ing. Based on the minimum requirements of a region, an index, which shows the capability of a watershed to meet that minimum requirement, is sufficient for this research.
Water to Support
Livelihood (IWL) Seasonal
Water Available for Livelihood Use/ Minimum Water Required for Livelihood Use in the Region
There is a strong relationship between sustainable liveli-hoods and water availability (Alan, 2000; Hope, 2003). From the watershed sustainability perspective, the indicator needs to measure the availability of water required to sustain the livelihood of the watershed. The water requirement will vary seasonally (as in case of water for irrigation), so the indicator can be calculated seasonally and then converted to the yearly average.
Land Based Renewable Energy ((IRE)
Annual
Biofuel source produced within the watershed/Biofuel source required for the watershed population
Renewable energy is an important part of the equation of sustainable development. From the watershed sustainability perspective, some of the energy demands for the watershed should be met locally. From landuse perspective, renewable energy demand is related to renewable energy
Environment: Water
Pollution (IWP) Monthly
(Length of Stream that is not impared * No. of months it is not impared)/(Total Length of Stream in the Watershed * No. of Months Considered)
There are two sources of pollutants in water: point and non-point source. While point sources are easy to pinpoint , non-point pollution are hard.The indicator is calculated in monthly timesteps and looks at non-point pollution that is above the acceptable limits for that region
Water to Support the
Ecosystem (IWE) Monthly
Water Avaialable for the Ecosystem (i.e. water left after domestic and livelihood use)/Minimum Water Required
Various countries adopt different low-flow standards - A flow of frequency of 95% (Q95) , the seventh lowest average daily mean flow (MAM7) in a year, “the characteristic flow of low flow (DCE)”, lowest 7-day average flow that occurs on average once every 10 years (7Q10)
Undeveloped Land (IUL)
Annual
(Land left undeveloped * Parimeter to Area Ratio)/(Minimum Land Required as Undeveloped for the Region * Acceptable Parimeter to Area Ratio)
The first step to preserve the biodiversity of a region is to preserve its undeveloped land. Thus a good indicator for this is the amount of land that is undeveloped with respect to the land in the region. But prevention of habitat loss alone is not the only requirement for preserving biodiversity. The other important factor is habitat fragmentation. The higher the percentage of undeveloped land with high area to edge ratio would imply better conditions for biodiversity.
3.4. Measuring Sustainability by Using Reliability, Resilience and Vulnerability Concepts
To measure such ability of a watershed, reliability, resil-ience and vulnerability can be measured by methodology developed by Loucks and Gladwell [22]. Once the RBSI is plotted (as shown in Figure 2), an acceptable range needs to be decided for the watershed. This decision is subjective based on the local conditions of the region. The acceptable range could have both the upper and lower limit or it could just have upper limit or only lower limit. For example if both drought and flooding is a critical issue in a watershed, the acceptable range would have lower and upper limit but if drought only is the main concern, then the framework could have only the lower limit, i.e. anything under that is unacceptable. The
reliability, resilience and vulnerability are calculated as follows:
[image:6.595.311.535.555.705.2]794
Rel
Number of satisfactory values Re liability S =
Total number of values
Res
Number of Times a Satisfactory Value Follows an Unsatisfactory Value Re silience(S ) =
Number of Unsatisfactory Values
Vul
Vu ln erability(S )Expected Extent given Unsatisfactory values + Expected Duration given Unsatisfactory values
where Expected Extent given Unsatisfactory values = Cumulative extent of failure Number of individual failure events
and Expected Duration given Unsatisfactory values = Total number of failure periods Number of continuous series of failure events
Thus Watershed Sustainability
Watershed Rel Res Vul
S = S * S * 1 Relative S
where “Relative SVul” = Vulnerability/Maximum
Vul-nerability among all alternatives.
Relative SVul is subtracted from 1 to make it consistent
with reliability and resilience.
4. Case Study
4.1. Description of the Watershed
The Inland Bays is an estuary located in Sussex County in southeastern Delaware. It is one of the four drainage basins in the state of Delaware, draining into Atlantic Ocean. It is approximately 51 kilometers in size and drains roughly 810 square kilometers of watershed. The Millsboro Pond sub watershed is representative of other sub-watersheds in the Inland Bays basin. The Millsboro Pond watershed is 8708 hectare (87 Km2) in area, out of which row crop agriculture occupies 41.8 percent, fol-lowed by 30.3 percent of deciduous forest cover and 11.5 percent of pasture land. The quality of the Inland Bays has been degraded over the years due to anthropogenic activities. The waters of the Inland Bays are rich in nu-trients i.e. nitrates and phosphates. This nutrient enrich-ment can lead to eutrophication of the Bays. These con-ditions have been reported in the waters of Inland Bays as recently as 1998, 1999 and 2000 [27]. The nutrients entering the Bays are from various sources like agricul-ture, urban, wastewater and storm water. The watershed has also faced occasional droughts. The existing land use is highly fragmented. The current land use have about 45 percent of agriculture land, about 40 percent of forested land, roughly 9 percent of pasture land, 3 percent of wa-ter and wetland and rest is low residential development and other pervious land uses. This is a predominantly rural and agricultural watershed. According to the DNREC reports, 1256.7 kilograms (kg) of total nitrogen and 51.1 kg of total phosphorus are being added to the Bays daily.
4.2. Applying Framework to the Watershed
The prerequisite for applying the theoretical framework is to model a watershed as accurately as possible. The first step was to calibrate and validate the SWAT model. This was done as discussed in Sood and Ritter [28].
Two criteria that are critical to linking land use with water quantity/quality were considered to create land use scenarios. These are:
1) The recharge potential of the land: Andres [29], de-fines groundwater recharge as both the process and quantity of the precipitation that infiltrates through the unsaturated zone to the saturated zone.
2) The riparian zone along the water body: The vege-tation in the riparian zones plays a critical role in the quality of water in the watershed.
Figure 3 shows the land use scenarios. The first (Case-1) is the existing land use (Figure 3(a)). The sec-ond scenario (Case-2) was created only on the basis of the recharge potential of the watershed (Figure 3(b)). Areas with high recharge potential should not only be left undeveloped, so that maximum water infiltrates, but it should also not be used for agriculture since it will cause high infiltration of nutrients (from fertilizers) into the groundwater system. For this research, a groundwater recharge map (and GIS data) provided by Delaware Geological Survey, University of Delaware [29] were used. The recharge potential of the watershed is classi-fied as excellent, good, fair and poor. Thus keeping the percentage of types of land use the same, a hypothetical land use was created, with all the excellent, good, fair and poor recharge potential land being assigned to forest, pasture, agriculture, and development in that order. For the first land use scenario, no particular attention was paid to the riparian zones. Based on the second land use scenario, two more land use scenarios were created – one with 50 m riparian zone (Case-3) (Figure 3(c)) and the
other with 200m riparian zone (Case-4) (Figure 3(d)).
(a) (b)
(c) (d)
Figure 3. (a) Current land use—case 1. (b) land use based on recharge potential—case 2. (c) land use based on recharge po-tential and 50 m riparian zone—case 3. (d) land use based on recharge popo-tential and 200 m riparian zone—case 4.
The calibrated SWAT model was the basis for the simulation of the new land use scenarios. The GIS data of the new scenarios were used to replace the old land use data. The model had to be reconfigured for each land use scenario. Because of this the calibrated values of the parameters were lost each time and had to be reassigned. The model was run with the different land use scenarios one at a time, with all the data collected and analyzed as discussed in the next section.
4.3. Indicators
The social, environmental and biodiversity indicators were calculated for 50 years. The total water available for human use and minimum stream flow was calculated as the sum of stream flow (which is made up of surface runoff and base flow) and deep aquifer percolation. It is safe to assume that the 100% of the percolation is avail-able for human consumption because it is a renewavail-able
source and would not deplete the groundwater. The pa-rameters used in calculating the indicators are shown in
Tables 2, 3 and 4.
[image:8.595.58.539.82.443.2]796
substitute for unaltered habitat. Thus biodiversity was given slightly more importance than pollution and energy requirements. In a scale of 100, domestic, livelihood and
[image:9.595.58.531.144.356.2]ecological water usage was given a weightage of 18 each, pollution and energy was given a weightage of 15 whe- reas biodiversity was given 16.
Table 2. Parameters used in calculating the hydrological indicator.
Parameter Value Unit
Amount used from percolation1 100 %
Area of watershed2 8704.1624 hectare
Population of Millsboro3 4000
Population growth4 2 %
Domestic water consumption5 75 gallons/capita/day
Livelihood water consumption
Amount of agriculture land2 45 %
Percent of agriculture land irrigated6 12 %
Agriculture land irrigated 470.02477 hectare
Water required for irrigation in the watershed7 236,632,038 gallons in June and August
Water required for chicken industry8 26 liter/broiler
Boilers produced in Delaware in 20079 245,800,000
No of flocks per year10 5.3 per year
Average flock size in Millsboro11 1,363,925 broilers/flock
Water consumed in poultry industry12 30 %
Water required for chicken industry13 4,000,000 gallons per season
Water required for ecological purpose14 9,505,161 gallons per day
1
Percolation goes to deep aquifer. Since it is renewable, it can be assumed that 100% of the percolation can be made available for human consumption; 2From
SWAT Model; 3Based on 2000 Census of population and housing, Delaware State Data Center; 4Estimated based on the region; 5Based on various sources -
Handbook of Water Use and Conservation (Vickers 2001), NOAA, General Science Archive (http://www.newton.dep.anl.gov/askasci/gen01/gen01629.htm); 6
Based on Department of Agriculture; 7Based on Department of Agriculture; 8from the web site of United States Department of Agriculture, Agriculture
Re-search Service; 9from “FACTS ABOUT DELAWARE'S BROILER CHICKEN INDUSTRY” produced by Delmarva Poultry Industry, Inc.; 10from the web site
of Spatial Analysis Lab, College of Agriculture and Natural Resources, University of Delaware—“Delaware Inland Bays Watershed Nutrient Management
Project” document; 11Calculated based on 9 and 10; 12from Northcutt and Jones, 2004; 13((Liter per broiler)*(No. of broilers per flock)*(No. of flock per
year)/4)*(Percentage consumed)*(Area of Millsboro Pond/Area of Indian River catchment); 14Using USGS’s StreamStats Data-Collection Station Report—95
[image:9.595.58.533.462.618.2]% duration flow.
Table 3. Parameters used in calculating the energy indicators.
Parameter Value Unit
Ethanol production 0.125 gal/Kg of dry corn
Bio diesel production 0.052 gal/Kg of wet soy
Wet/Dry soy ratio 1.3
Energy per gallon of ethanol 80,000 BTU/gallon
Energy per gallon of bio diesel 140,000 BTU/gallon
Watershed population 4000
Population growth 2 %
Energy consumption per capita per year 290 MBTU
Energy demand to be met by biofuels 3 %
Improvement in technology 2 %
Crop used for energy 50 %
Table 4. Parameters used in calculating the environmental (pollution) indicator.
Parameter Value Unit
TP loading rate 1.00 Kg/ hectare /year
TN loading rate 22.00 Kg/ hectare /year
TP loading rate 0.08 Kg/ hectare /month
TN loading rate 1.83 Kg/ hectare /month
Total Stream length 109.849 Km
[image:9.595.54.539.640.724.2]For domestic indicator, it was assumed that the do-mestic water consumption in the region is 282 liters (75 gallons) per capita per day. The population of the water-shed was taken as 4000 with a growth rate of 2%. Based on these parameters, the domestic indicator was calcu-lated for each month and then averaged over the year. After the demand for domestic water needs was met, the remaining water was grouped together at three months intervals to measure the seasonal demand of water for livelihood. For the Millsboro watershed, there are two major livelihoods, i.e. agriculture and the poultry indus-try. About 12% of the agricultural land in the watershed is irrigated from June and August at the rate of roughly 5 cm per week. In the poultry industry, roughly 98.4 litters (26 gallons) of water are used per broiler [30]. Approxi-mately 5.3 flocks per year are produced and each flock contains 1,364,000 broilers in the watershed. Based on this, the livelihood water demand for the watershed was calculated on seasonal basis and the indicator calculated. The minimum stream flow was based on the stream flow statistics collected by USGS at their gauging station at the Millsboro Pond outlet at Millsboro, DE (Station
number 01484525). A 90 percentile flow of 0.76 m3/sec
was used as the minimum stream flow required from an ecological perspective.
For the energy indicator calculations, the per capita energy requirement of the population was taken as 306 × 109 joules per capita per year. The population in the wa-tershed was taken as 4000 with a growth rate of 2%. It is assumed that only 3 percent of the total watershed energy demand will be met by bio fuels and 50% of biomass (i.e.
corn and soybean) grown in the watershed will be used for energy. The yield (i.e. Kilograms per hectare) from the SWAT model was used as the biomass generated from the watershed. Also, it was assumed that due to technological innovation, the increase in production in the energy from the same amount of biomass will be at
the rate of 2%. Since the land under agriculture was kept the same in all the scenarios, there was not much differ-ence in the energy indicators for all the scenarios.
For the biodiversity indicator, GIS was used to calcu-late area and perimeter of the forested land in the water-shed. The best case area to perimeter ratio was calculated by considering all the land area in the watershed as for-ested. This gave the value of the area to perimeter ratio as almost three times higher than the best case land use scenario.
5. Results and Analysis
5.1. Indicators
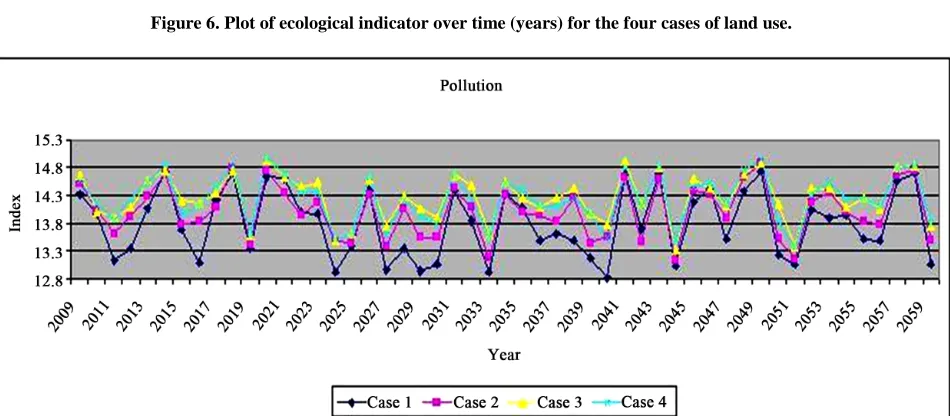
Figures 4-9 show the values of all the six indicators over the period of 50 years (i.e. from 2009 to 2059). There are three years (i.e. 2013, 2046, and 2058), where the do-mestic water demands is not met. These years probably indicate drought situation. The livelihood indicator is similar in the most of the scenarios except in 2052 and 2053, when land use case 2 performs the worst among all the scenarios. The indicator dips frequently in the first decade and then once and then towards the end of the simulation period. Looking at the figure closely, it is evident that although none of them meet the ecological water demand all the time in the year, case 3 and case 4 of the land use perform better than other cases most of the time. From the perspective of nutrients in the water system, the current land use fares the worst. Although case 2 performs better than case 1 most of the times, it is not very different from the current land use performance. That is understandable as the case 2 lacks a good riparian zone. Numerous studies have shown that the riparian zone land use has a substantial effect on the nutrient pol-lution in the water system. Land use case 3 and 4 per-form much better than the other two scenarios, although
798
[image:11.595.62.538.93.453.2]Figure 5. Plot of livelihood indicator over time (years) for the four cases of land use.
Figure 6. Plot of ecological indicator over time (years) for the four cases of land use.
[image:11.595.62.537.494.702.2]Figure 8. Plot of energy indicator over time (years) for the four cases of land use.
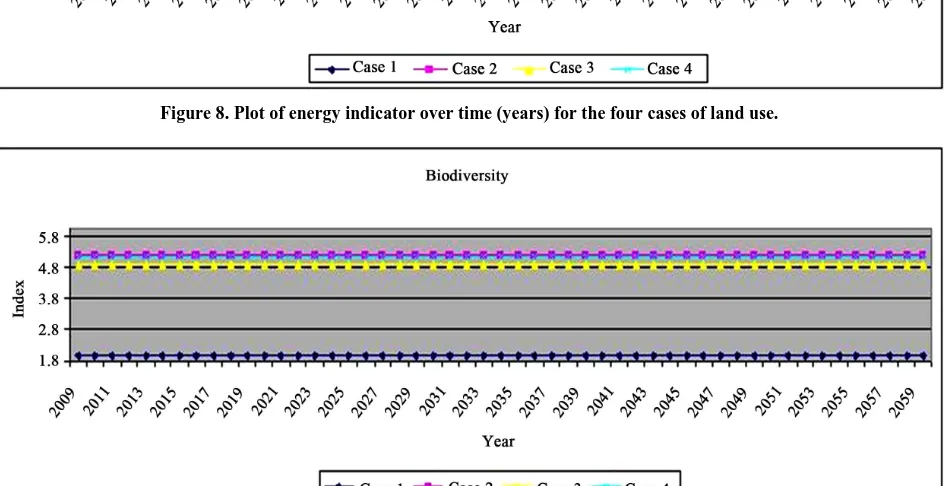
Figure 9. Plot of biodiversity indicator over time (years) for the four cases of land use.
e difference between them is not significant. This im- 5.2. Watershed Index
as calculated by adding the eighted indicators for each of the land use scenarios. th
plies that there is not much difference in having a ripar-ian zone 50 meter wide as compared to having a riparripar-ian zone 200 m wide for nutrient management. Thus it is clear that although a vegetative riparian zone in neces-sary to control the nutrients in the water way, but after a certain width, its effectiveness is reduced. The effective-ness of riparian zones in reducing nutrients is site spe-cific, as it depends upon soil conditions, water table, type of vegetation etc. Thus to define an adequate riparian buffer width, each watershed needs to be modeled sepa-rately and appropriate riparian width defined. Land use cases 1 and 4 come up slightly higher than the other sce-narios for energy indicator but as mentioned before, the difference is not significant. The current land use (case 1) is highly fragmented and as such had a very low area to perimeter ratio (roughly eight times less than the best case scenario). Among the four scenarios, case 2 has the highest value for the indicator.
The watershed index w w
The indicators were then plotted against time (in years)
for the next 50 years. The results are shown in Figure
10(a). On visual inspection, land use case 1 is much be-low the other scenarios and can be outright rejected. The majority of the difference is due to the biodiversity indi-cator. As discussed in the above section, the current land use, because of high fragmentation, fared badly with biodiversity indicator. That indicator outstrips (and hides) the significance of other indicators. Thus another graph
was plotted without the biodiversity indicator (Figure
800
tershed Sustainability
bility, the first step is define the acceptable value for the indicator. The deci-the same. In this case, it can be seen that “as is” scenario is comparable to other scenarios and in fact sometimes performs better that the case 2 (without any riparian zones).
5.3. Wa
To calculate the watershed sustaina to
sion on acceptable values for the indicator is subjective and is based on practicality and best judgment. Full availability of water for domestic, livelihood and eco-logical purposes was considered necessary. Hence they
were all assigned a value of 1. On the other hand, if the pollution level falls to 0.8 of the “no pollution” value, could be considered acceptable. For energy, 70 percent of demand met would be considered acceptable. For the biodiversity indicator, 30 percent of the best possible scenario was considered because it is necessary to main-tain the agriculture land to forest land ratio (since chang- ing that would impact the economy of the region and it is not being considered in this research). Considering that 45 percent of the watershed land is agriculture, it will be hard to achieve a high value for this indicator. An un-achievable value will make the whole system unsustain-able and hide the other influence of other indicators.
(a)
(b)
[image:13.595.116.483.253.682.2](c)
l the indicators, (b) all indicators except the bi
ase 2 is worse off than the current la
logical issues are given less significance, the current land
eliability, resiliency and vulnerability as been applied previously to evaluate and select
alter-eloping nations. Both, due to di
indic rs except biodiversity with more weightage to human requirements.
[image:14.595.59.539.515.723.2]cluded weightage scenario
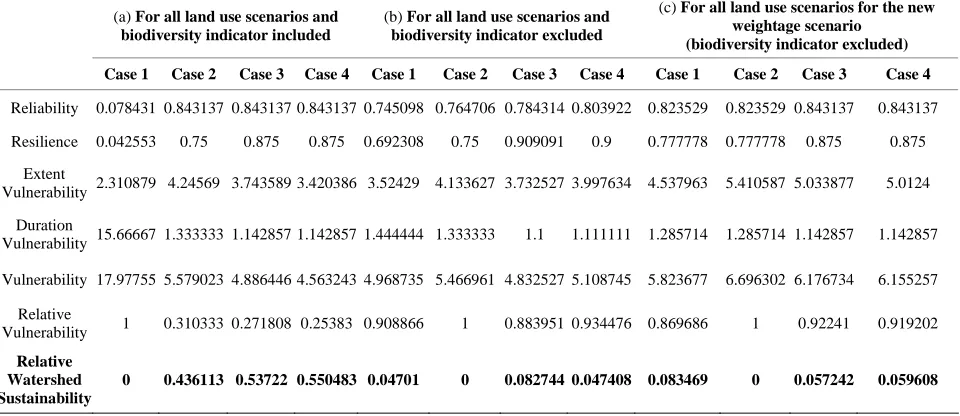
Table 5 shows the results of the sustainability calcula-ion for (a) al
diversity is ignored and other environmental and eco-t
odiversity indicator, and (c) all indicators (without bio-diversity) and higher weightage to human use. In the first case, when all the indicators are considered, the current land use has the least reliability and resilience and very high vulnerability. This is because the current land use’s biodiversity indicator is very low. Land use case 3 and 4 are almost similar, with case 4 just outstripping case 3. These two scenarios are less vulnerable and a little more resilient than case 2.
When the biodiversity indicator is removed, it is seen, that in fact land use c
nd use scenario. The vulnerability for the case 2 is higher. This can be explained due to the lack of the good riparian buffer in the case 2. Thus, although it has the highest biodiversity indicator value, its pollution indica-tor is lower than the other scenarios. Without the biodi-versity indicator, land use case 3 is the most sustainable alternative of the four scenarios. Thus, it is seen that pro-viding large riparian buffer widths does not necessarily make the system better off. If biodiversity is ignored (i.e.
zero weightage is given) and the ecological water needs,
pollution and energy are given less importance (i.e.
lesser weightage), the outcome is much different. The domestic water requirement and the livelihood water requirement were given a weightage of 35 whereas the other relevant indicators were given a weightage of 10.
Table 5(c) shows the resilience, reliability, vulnerability and watershed sustainability for this new weightage sce-nario. In this case, the current land use scenario (case 1) is more sustainable than the other scenarios. Thus if
bio-use works fine. In other words, the current land bio-use is de- veloped by keeping only anthropogenic requirements in mind and ignoring other ecological issues. Thus, it seems, the planning for existing land use, although meeting hu-man needs, did not consider a holistic approach.
6. Discussion
Table 5. Resilience, reliability, and vulnerability for (a). All
The concept of r h
native design and operational policies for water resources projects [22,26,31,32]. But the scale of such an applica-tion has been restricted to a single project level. Also, there are not too many case studies using such a concept [26]. This research is an attempt to expand the scope of the concept of reliability, resiliency and vulnerability to the scale of watershed.
Most of the future global population growth is ex-pected to take place in dev
rect and indirect needs of increasing population and development, there is going to be extreme pressure on the limited land in these countries. This research shows that the location of development within a watershed is critical for sustainability of water resources and biodi-versity. Along with how much land is converted to de-velopment, it is also necessary to consider where in the watershed that development is taking place. High re-charge potential landuse should be either left in its natu-ral state or used for the type of activities which require less impervious cover and have lesser scope of pollution
ators; (b). All indicators except biodiversity; (c). All indica-to
(a) For all land use scenarios and biodiversity indicator included
(b) For all land use scenarios and biodiversity indicator ex
(c) For all land use scenarios for the new
(biodiversity indicator excluded)
Case 1 Case 2 Case 3 Case 4 Case 1 Case 2 Case 3 Case4 Case 1 Case 2 Case 3 Case 4
Reliability 0.078431 0.843137 0.843137 .843137 0 0.745098 0.764706 0.7843140.803922 0.823529 0.823529 0.843137 0.843137
Resilience 0.042553 0.75 0.875 0.875 0.692308 0.75 0.909091 0.9 0.777778 0.777778 0.875 0.875
Extent
V 4 3 3 4. 7 3.9 5
1
4.8
Sustainability
ulnerability 2.310879 .24569 .743589 .420386 3.52429 13362 3.732527 97634 4.537963 5.410587 .033877 5.0124
D Vulnerability
uration
15.66667 1.333333 1.142857 1.142857 1.444444 1.333333 1.1 1.111111 1.285714 1.285714 1.142857 .142857
Vulnerability 17.97755 5.579023 4.886446 4.563243 4.968735 5.466961 32527 5.108745 5.823677 6.696302 6.176734 6.155257
Relative
Vulnerability 1 0.310333 0.271808 0.25383 0.908866 1 0.883951 0.934476 0.869686 1 0.92241 0.919202
Relative
802
in . Also, riparian zones play a critical role in
se e ams
f the watershed. Thus there should be
ade-light modifications to the water-sh
de-ve
gical aspect well, they do no
nerated land uses linked to the model within the frame-
work to generate the best land use after running hundreds
the land n e
computer program could use recharge potential, riparian
ity in
ay. Currently, most of the planning is done sing political boundaries. Thus land use is planned on quirements within a district or a mu-icipality boundary, without considering its impact on
tion is given to population living outside the political filtration
r e
lowing out o
educing th dim nts and nutrient load in the stre
f
quate buffer between agriculture landuse and stream system. Based on the climatic conditions, this framework simulates the renewable water available over a long pe-riod of timeframe. It also takes into consideration mini-mum land and water required for biodiversity. Thus, in a sense, this framework helps in defining the carrying ca-pacity of a watershed.
Although the framework proposed in this research was implemented in the watershed of a developed nation, it can be applied with s
eds of the developing nations. In the developing na-tions the line between forested and developed land is a little blurred. There are subsistence communities that depend on non-timber forest products (NTFP) for their daily needs and livelihoods. A separate category of land use needs to be created. Many communities have water storage structures as “commons ponds”, which have im-portant significance in the social structure. The hydro-logical model needs to incorporate such ponds as they affect the water cycle in the watershed. These ponds would also play an important role in the supply side management of the water resources in the watershed.
The indicators to calculate the watershed sustainability could be created based on the critical issues of the wa-tershed. Also the water needs and requirements in
loping nations are different than those in the developed nations. So, although the indicators will stay the same, the acceptable values (denominators in the indicators used in this study) will change. Where excess water is an issue, for example in the floodplains and low lying areas, an upper limit, along with a lower limit needs to be con-sidered for calculating reliability, resilience and vulner-ability for the watershed. This framework could be used to identify the most effective adaptive measure, both in terms of its effectiveness and cost wise, to reduce the vulnerability of the watershed.
Some of the shortcomings of this framework are that the indicators used in this study are simplistic. Although the indicators cover the hydrolo
t cover the social and biodiversity completely. Social issues and biodiversity are more complex than presented here and are outside the scope of this analysis. In a more detailed study, these aspects of landuse could be repre-sented better by integrating other relevant models within this framework. Second, the land use scenarios in the case study were developed based on the recharge poten-tial and riparian zones. Only four scenarios were created in this study. This limits the scope of land use possibili-ties. A more thorough study could include computer ge-
zones, fragmentation in randomly creating land uses and/or any watershed specific parameter. Then the model could be run for these different land uses and a ranking given based on watershed sustainability calculated as defined in the framework. Then a subjective decision can be made by policy makers as to select the direction of future land use for the watershed. Third, although the SWAT model does a good job of hydrological analysis for surface runoff, root zone and channel flow, it does not include a detailed groundwater modeling that takes into consideration the coastal effect, large scale ground-water withdrawal and treated wasteground-water disposal using groundwater infiltration. Since groundwater is an impor-tant component of hydrological cycle and water use in the watershed, a dedicated model could be combined with the SWAT model for a better simulation and pre-diction of groundwater in the watershed. Forth, an im-portant consideration in any watershed study is the scale of the watershed. A watershed can be as small as a catchment or as big as a river basin. Each scale would lead to a different outcome. The question is how to de-cide the appropriate scale of watershed to be considered for the study. If the watershed is too small, it will not be able to capture the holistic picture. If the watershed is too big, it would hide some of the local issues and not be as effective. Also a densely populated area like a big city will require much a bigger watershed to be sustainable within its boundaries. Thus watershed scale, which has not been an issue (because of low human population) in this study, needs to be incorporated in the framework.
Lastly, climate change has the potential to disrupt and modify hydrological regimes and thus affect watershed management. Along with land use scenarios, different climate change scenarios need to be considered. This research has not taken into consideration the future cli-mate change scenarios, which has a potential to have a significant impact on the land use and water availabil
of iterations. In deciding use sce arios, th
the region.
7. Conclusions
This framework has many policy implications. Foremost, it provides a tool to policy makers, land use planners, zoning officials, watershed managers to look at land use in a holistic w
u
the basis of local re n
considera-. Kconsidera-. Bisw
and C. Tortajada, Eds., nable
Develop-anagement and Environmental Challenges
sity Press, Oxford, 2005.
boundary. In some instances, this leads to conflict be-tween people. If the demand for the water is looked-upon at the watershed scale, such conflicts can be avoided. Since this framework takes into account the water re-quirement for the ecosystem, it also helps in reducing the conflicts with respect to water, between people and en-vironment. The land use planning will become even more critical with the popularity of bio fuels and need for more land under cultivation. The greatest threat to bio-diversity is the fragmentation of pristine land and inter-ference due to human activity. Using recharge potential as a guiding principle for land use planning has two ad-vantages—one, since the high recharge potential areas are left free of human development; it helps in recharg-ing the groundwater faster. Also, infiltratrecharg-ing water is less polluted due to lack of human activities in these areas; second—since, recharge potential is based on soil prop-erties and since soils with similar propprop-erties are grouped together, it is easier to plan with less fragmentation. Some of the limitations of this research, as mentioned in the section above, can be addressed in the future research. The biodiversity indicator needs to be further developed to better depict the biodiversity issues of a region. Also, an economic indicator can be added to the existing indi-cators to represent the social sustainability better. With the inclusion of an economic indicator, scenarios with less water intensive industries to replace agriculture (water intensive) land use could be played out and its affect analyzed with respect to sustainability, especially in the watersheds with high water scarcity.
8. References
[1] WCED (World Commission on Environment and Devel-opment), “Our Common Future,” Oxford University Press, Oxford, 1987.
[2] C. Tortajada, “Sustainable Development: A Critical As-sessment of Past and Present Views,” In: A
Appraising Sustai
as ,
ment: Water M
Oxford Univer
[3] R. Goodland, “The Concept of Environmental Sustain-ability,” Annual Review of Ecology and Systemetics, Vol. 26, 1995, pp. 1-24.
doi:10.1146/annurev.es.26.110195.000245
[4] R. Goodland and D. Herman, “Environmental Sustain-ability: Universal and Non-Negotiable,” Ecological Ap-plications, Vol. 6, No. 4, 1996, pp. 1002-1017.
doi:10.2307/2269583
[5] D. Satterthwaite, “Sustainable Cities or Cities That Con-tribute to Sustainable Development?” Urban Studies, Vol. 34, No. 10, 1997, pp. 1667-1691.
doi:10.1080/0042098975394
An Assessment of Sustainability,” Annual Review of En-vironment and Resources, Vol. 28, 2003, pp. 243-274.
doi:10.1146/annurev.energy.28.050302.105541
[7] M. Wackernagel and W. Rees, “Our Ecological Footprint,
division Planning and eview and Annotated
Bib-r ic, Eds.,
ore, R. Shafer and A.
Indicators for the Sustainable Water Re-
nd Their Rela-Reducing Human Impact on the Earth,” New Society Publishers, Gabriola Island, 1996.
[8] D. R. Van Vliet, “Sustainable Sub Design: Analysis, Literature R
liography,” In Issues in Urban Sustainability: Institute of Urban Studies, University of Winnipeg, Winnipeg, 1994. [9] N. H. Afgan, “Sustainability Concept for Energy, Wate
and Environment Systems,” In: Bogdan and Du
Sustainable Energy Technologies, Swets and Zeitlinger B.V., Lisse, 2004.
[10] R. Kranz, S. P. Gasteyer, H. Theod
Steinman, “Conceptual Foundations for the Sustainable Water Resources Roundtable. Universal Council on Wa-ter Resources,” Water Resources Update, No. 127, 2004, pp. 11-19.
[11] R. Shah, “International Frameworks of Environmental Statistics and Indicators,” Inception Workshop on the In-stitutional Strengthening and Collection of Environment Statistics, 25-28 April 2000, Samarkand.
[12] H. T. Heintz Jr., “Conceptual Foundations for the Sus-tainable Water Resources Roundtable,” Water Resources Impact, Vol. 8, No. 4, 2006, pp. 7-10.
[13] E. T. Smith and H. X. Zhang, “Overview/Introduction: Developing
sources Roundtable,” Water Resources Impact, Vol. 8, No. 4, 2006, pp. 3-6.
[14] P. M. Barlow, W. M. Alley and D. N. Myers, “Hydro-logical Aspects of Water Sustainability a
tion to a National Assessment of Water Availability and Use,” Water Resource Update, Vol. 127, No. 1, 2004, pp. 76-86.
[15] P. H. Gleick, “Water in Crisis: Paths to Sustainable Water Use,” Ecological Applications, Vol. 8, No. 3, 1998, pp. 571-579.
doi:10.1890/1051-0761(1998)008[0571:WICPTS]2.0.CO;2
[16] H. M. L. Chaves and S. Alipaz, “An Integrated Indicator for Basin Hydrology, Environment, Life, and Policy: The Watershed Sustainability Index,” Water Resources Man-agement, Vol. 21, No. 5, 2007, pp. 883-895.
doi:10.1007/s11269-006-9107-2
[17] C. Santhi, R. Srinivasan, J. G. Arnold and J. R. Williams, “A Modeling Approach to Evaluate the Impacts of Water Quality Management Plans Implemented in a Watershed in Texas,” Environmental Modelling & Software, Vol. 21, No. 8, 2006, pp. 1141-1157.
doi:10.1016/j.envsoft.2005.05.013
[18] S. L. Neitsch, J. G. Arnold, J. R. Kiniry, J. R. Williams and K. W. King, “Soil and Water Assessment
retical Documentation, Version
Tool Theo- 2000,” Grassland, Soil
nold, “The Soil and Water Assessment Tool: Historical and Water Research Laboratory, Blackland Research Center, Temple, 2002.
804
gricultural and Biological
-1250.
F. Griffiths, “An Assessment of Development, Applications, and Future Research Direc-tions,” American Society of A
Engineers, Vol. 50, No. 4, pp. 1211
[20] R. D. Harmel, C. W. Richardson and K. W. King, “Hy-drologic Response of a Small Watershed Model to Gen-erated Precipitation,” Transactions of the ASABE, Vol. 43, No. 6, 2000, pp. 1483-1488.
[21] T. W. R. Wallis and J.
the Weather Generator (WXGEN) Used in the Erosion/ Productivity Impact Calculator,” Agricultural and Forest Meteorology, Vol. 73, No. 1-2, 1995, pp. 115-133.
doi:10.1016/0168-1923(94)02172-G
[22] P. D. Loucks and J. S. Gladwell, “International
of Ecology and System
ogy Series—Sustainability Criteria for Water Resource Systems,” Cambridge University Press, Cambridge, 1999. [23] L. H. Gunderson, “Ecological Resilience—In Theory and
Application,” Annual Review atics,
Vol. 31, 2000, pp. 425-439.
doi:10.1146/annurev.ecolsys.31.1.425
[24] R. J. T. Klein, M. J. Smit, H. Goosen and C. H. Hulsber-gen, “Resilience and Vulnerability: Coastal Dynam Dutch Dikes?” The Geographical Jou
ics or
rnal, Vol. 164, No. 3, 1998, pp. 259-268.doi:10.2307/3060615
[25] K. Fara, “How Natural Are ‘Natural Disasters’? Vulner-ability to Drought of Communal Farmers in Southern Namibia,” Risk Management, Vol. 3, No. 3. 2001, pp. 47-63.doi:10.1057/palgrave.rm.8240093
[26] T. R. Kjeldsen and D. Rosbjerg, “Assessment of the
Basin,”
s in Millsboro Pond Watershed Using Soil
.25047
tainability of a Water Resources System Expansion,” In-tegrated Water Resources Management, Vol. 272, 2001, pp. 151-156.
[27] D. N. R. E. C., “Inland Bays/Atlantic Ocean Delaware Department of Natural Resources and Envi-ronmental Control, Dover, 2001
[28] A. Sood and W. F. Ritter, “Evaluation of Best Manage-ment Practice
and Water Assessment Tool (SWAT) Model,” Journal of Water Resource and Protection, Vol. 2, No. 5, 2010, pp. 403-412.doi:10.4236/jwarp.2010
ey of Water Use
. P. Loucks, “Reli-[29] A. S. Andres, “Ground-Water Recharge Potential Map-ping in Kent and Sussex Counties, Delaware,” Delaware Geological Survey, Report of Investigations No. 66, Uni-versity of Delaware, Newark, 2004.
[30] J. K. Northcutt and D. R. Jones, “A Surv
and Common Industry Practices in Commercial Broiler Processing Facilities,” Journal of Applied Poultry Re-search, Vol. 13, No. 1, 2004, pp. 48-54.
[31] T. Hashimoto, J. R. Stedinger and D
ability, Resiliency, and Vulnerability Criteria for Water Resource System Performance Evaluation,” Water Re-sources Research, Vol. 18, No. 1, 1982, pp. 14-20.
doi:10.1029/WR018i001p00014