89
Printed in Great Britain © The Company of Biologists Limited 1993Key words: locomotion, biomechanics, aerodynamics, power output, arthropod, cockroach, Periplaneta americana, Blaberus discoidalis.
DRAG AND LIFT ON RUNNING INSECTS
R. J. FULL and M. A. R. KOEHL
Department of Integrative Biology, University of California at Berkeley, Berkeley CA 94720, USA
Accepted 15 October 1992
Summary
We examined the effects of aerodynamic forces on the mechanical power output of running insects for which kinematic data were available. Drag and lift on the cockroaches Periplaneta americana (a small, rapidly running species) and Blaberus discoidalis (a larger, more slowly moving species) were measured in a wind tunnel. Although lift would be expected to affect power output by altering functional body weight, the magnitude of the lift on these cockroaches was less than 2% of their weight. Drag, which increases the horizontal force that must be exerted to run at a given speed, accounted for 20–30% of the power output of P. americana running at speeds of 1.0–1.5 ms21, but had a much
smaller effect on B. discoidalis. Aerodynamic drag on the body (parasite drag) can significantly increase the mechanical power output necessary for small, rapidly running insects in contrast to larger running animals and to flying insects.
Introduction
the body forward and accounts for only a 7% increase in metabolic rate during running in still air at 6ms21(Pugh, 1971).
Under what conditions might drag and lift become important in terrestrial locomotion? The Reynolds number (Re=lU/nwhere l is body length, U is the velocity of the air relative to a running animal and n is the kinematic viscosity of the fluid) of many running terrestrial animals ranges from about 103 (e.g. beetles; Bartholomew et al. 1985 and
cockroaches; Full and Tu, 1991) to 106(e.g. cheetahs; Garland, 1983) In this range of Re
values the drag force (D) is function of the density of the fluid (r=1.18kg m23for air at
25˚C), the projected area of the organism (S), the velocity of the air relative to the animal (U) and the drag coefficient (CD, which depends on the organism’s shape, surface texture
and Re; D=0.5CDrSU2; see Vogel, 1981). Parasite power, the increase in power output
needed to overcome drag on the body, is the product of drag and the speed of the animal through the air. The lift force (L) in this range of Re values is a function similar to drag except that the coefficient of lift (CL) replaces the drag coefficient (L=0.5CLrSU2).
Larger animals should experience greater absolute lift and drag than smaller ones moving at the same speed but, because small animals have a greater area-to-volume ratio than do large animals, small animals should encounter greater aerodynamic forces per unit mass than large animals. Since drag and lift increase with speed, aerodynamic forces might have significant effects on the power output required for terrestrial locomotion of rapidly moving small animals (even though their consequences for larger animals appear to be less important).
Many insect species are small and yet run at high speeds. For example, a 1g desert beetle, Onymacris plana, can run at speeds of 1.0 ms21. Bartholomew et al. (1985)
suggested that lift and possibly drag affect the cost of transport of this species. A 1 g American cockroach, Periplaneta americana, can run even faster, attaining speeds of 1.5 ms21during escape, equivalent to 50bodylengths s21(Delcomyn, 1971; Full and Tu,
1991; McConnell and Richards, 1955). P. americana can cycle its legs at over 20Hz, equivalent to its wingbeat frequency during flight. At these high speeds, these insects (1) raise their body farther off the ground than when running slowly; (2) tilt their body axis with the anterior end upwards at a positive angle of attack (a) of 25˚; (3) become quadrupedal or bipedal; and (4) show aerial phases during which all six legs are off the ground (vertical ground reaction force decreases to zero; Full and Tu, 1991). By using its hind legs as the primary propulsive units, P. americana overcomes the limitations to stride length imposed by the shorter anterior limbs. Increasing the angle of attack of the body may give the hind legs a greater range of movement. The highest speeds are attained by incorporating an aerial phase into each step during bipedal running. When P.
americana travels at high speeds, the mechanical power output generated to move the
center of mass is significantly greater than that predicted from scaling relationships derived from birds, mammals, crabs and other cockroaches (Heglund et al. 1982; Blickhan and Full, 1987; Full and Tu, 1990, 1991; Full, 1991).
The elevated power output of rapidly running American cockroaches, coupled with their shift in body position, led us to question the assumption that aerodynamic forces have negligible effects on terrestrial locomotion. The purpose of the present study was to examine the effects of drag and lift on the mechanical power output of running insects.
We focused on the small, rapidly running American cockroach P. americana and compared it with the larger, slower (peak speed=0.6 ms21) tropical cockroach Blaberus
discoidalis (Full and Tu, 1990, 1991).
Materials and methods
Animals
Periplaneta americana (mean body mass=0.84g, S.D.=0.07, N=3) and Blaberus
discoidalis (mean mass=3.7g, S.D.=0.31, N=3) were obtained from Carolina Biological Supply Company. Animals were killed by 24h CO2anesthesia and stored in a freezer at 280˚C until used.
Wind tunnel
When an insect runs through still air, the velocity of the air relative to the insect is equal in magnitude and opposite in direction to the velocity of the animal. We mimicked the air flow relative to a running cockroach by blowing air past a stationary, dead cockroach in an open-circuit, open-jet wind tunnel (Vogel, 1981; Kingsolver and Koehl, 1985; Emerson and Koehl, 1990) with a working section 0.3m in diameter. A series of screens was used to suppress turbulence generated by the fan and to create an even flow field in the working section of the tunnel.
A board (0.5m tall 30.8m long) oriented parallel to the flow direction served as the substratum; it bisected the working section and its leading edge abutted on the nozzle of the wind tunnel (Fig. 1). When fluid moves relative to a solid surface (such as the substratum in our wind tunnel), the fluid in contact with the surface does not slip with respect to the surface; hence, a velocity gradient (boundary layer) develops in the fluid between the surface and the freestream flow (Tritton, 1977). In contrast, there is no boundary layer along the substratum in the velocity field relative to an animal running in still air. Therefore, in order for air flow in our wind tunnel to simulate air flow with respect to a cockroach running in still air across the ground, we had to produce a flow field in which the boundary layer was much thinner than the distance between the animal’s ventral surface and the substratum and in which the air velocity encountered by the insect did not vary as a function of distance away from the substratum. We achieved this by placing the animal near the leading edge of the board (Fig. 1; boundary layer thickness increases with distance from the leading edge of a flat plate; Tritton, 1977) and by fixing extra strips of screen to specific locations on the nozzle of the wind tunnel to adjust air velocities at different distances from the substratum. A Kurz air velocity meter (model no. 440) was used to measure wind speeds at the position where the cockroach was to be placed at 2mm intervals away from the substratum to a distance of 8cm. Speeds varied by less than 5% as a function of height.
Aerodynamic forces
Gauge output was fed into a bridge circuit and amplified (Gould Bridge Amplifier, model no. 11,4113-01) and then collected by an analog-to-digital converter (C-100, Cyborg) interfaced with a computer (IBM PC/AT). Force signals were sampled at a frequency of 5 samples s21for 30s. Each force record was averaged over the 30s interval using data
acquisition hardware and analysis software (Discovery, Cyborg).
The force transducer was mounted above the working section of the wind tunnel and each cockroach was suspended from it by a stiff steel rod (1mm diameter, 22cm length) that passed through the animal’s center of mass (Fig. 1). An extension of the mounting rod below the working section of the wind tunnel bore a sphere immersed in a tub of light Karo syrup to damp out any small, high-frequency fluctuations in force. The force beam was calibrated with each insect and damping sphere attached by applying known forces (using a weight-and-air pulley system) at the point of attachment of the animal to the rod. The steady-state drag and lift forces on each insect were measured to the nearest 1mN for a variety of conditions chosen to represent those measured for running cockroaches (Full and Tu, 1990, 1991).
(1) Air speed. Reynolds number (Re) ranged from 1400 to 3500 for P. americana of 35mm in length at speeds of 0.6–1.5 ms21. For B. discoidalis 44mm in length, Re ranged
from 880 to 2933 for speeds of 0.3–1.0 ms21. Three speeds were tested for each animal.
[image:4.595.85.412.69.368.2]92
R. J. F
ULLand M. A. R. K
OEHL(2) Body posture. The distance between the substratum and the center of mass of the animal was 5 or 10mm. Angle of attack (a) was set at 0, 15 or 25˚; positive angles indicate a ‘nose-up ‘ attitude. The posture of the mounted animals was similar to that measured during running, except for the leg positions. However, our measurements showed no significant difference in drag or lift when the legs were trimmed or removed.
Measurements of drag and lift on the mounting rod alone were also made at the relevant wind speeds and were subtracted from the drag and lift measurements made when each cockroach was attached to the rod. Rod forces were less than 3% of the total force on the rod plus insect. Since the legs had no measurable effect on drag or lift, we assumed that aerodynamic interaction between the animal and the rod (see Tucker, 1990) was also minimal.
Coefficients of drag (CD) and lift (CL) were calculated using the equations given in the
Introduction. Experiments were carried out at sea level at 25˚C, so a value of 1.18kg m23
was used for air density (Pankhurst and Holder, 1952; Cambell, 1986). The plan area of each animal (its projected area viewed from above when a=0˚) was determined to the nearest 1.031027m2by video image analysis: images were recorded using a Panasonic
PV-320 camera, frames were captured by a frame grabber (MacVision) and areas were determined by image analysis software (Image 1.4, NIH). The frontal area of each animal (its projected area when viewed from the front) was also determined when a=0˚, 15˚ and 25˚. Plan area was used for S to calculate CL. Drag coefficients were calculated in two
ways: CDwas calculated using plan area for S (CDP) and frontal area at the appropriate
angle of attack for S (CDF).
Data analysis
The effects of three variables (distance of the animal above the substratum, air speed and angle of attack) on drag, the drag coefficient, lift and the lift coefficient were determined by using an analysis of covariance in a general linear model (ANCOVA, Systat Inc.). Two of these variables served as covariates when the effect of the third treatment variable was tested (e.g. MGLH model drag=constant+speed+height+angle). Homogeneity of slope tests were conducted initially for all ANCOVAs. In addition, we tested whether the slopes (estimated by a linear fit) were significantly different from zero.
Results
Drag
Distance of the animal above the substratum
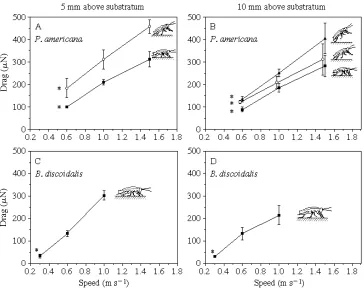
Drag on P. americana was greater when animals were close to the substratum than when they were farther away (F1,41=12, P=0.001; Fig. 2A,B). In contrast, for
B. discoidalis drag was not affected by distance above the ground (F1,15=2.1, P=0.16;
Fig. 2C,D).
Speed
(F2,40=55, P<0.001; Fig. 2A,B). Drag also increased significantly with air speed for
B. discoidalis (F2,14=38, P<0.001; Fig. 2C,D).
Angle of attack
Drag increased significantly with angle of attack for P. americana (F2,41=9.9, P<0.001;
Fig. 2A,B), as did frontal area [from 1.331024m2(S.D.=1.331026, N=3) at a=0˚ to
2.831024m2(S.D.=4.231026, N=3) at a=25˚]. Since B. discoidalis does not alter the
angle of attack during locomotion, we did not vary this angle in our experiments. The frontal area of B. discoidalis running at a=0˚ was 2.631023m2(S.D.=8.331026, N=3).
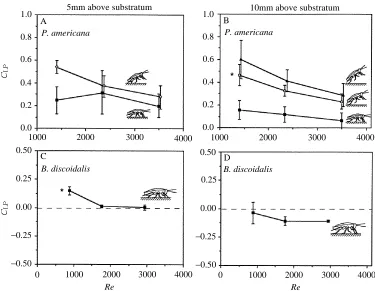
Drag coefficient
Drag coefficient (CDP) decreased as Re increased (i.e. as speed or size increased) in
P. americana (F2,40=33, P<0.001; Fig. 3), but did not change significantly in
B. discoidalis. Drag coefficients calculated using frontal area (CDF) were similar for the
94
R. J. F
ULLand M. A. R. K
OEHL [image:6.595.67.431.73.362.2]two species (ranging from 2.3 to 1.9 for P. americana and from 3.6 to 0.9 for B.
discoidalis); CDP values calculated using plan area were greater for the small P.
americana than for the larger B. discoidalis (Fig. 3). In P. americana, CDPincreased with
an increase in angle of attack (F2,40=11, P<0.001) and height (F1,41=12, P<0.001).
Lift
Distance of the animal above the substratum
The distance of an animal’s center of mass above the substratum had no significant effect on lift in P. americana (F1,41=3.7, P=0.06; Fig. 4A,B), but it did in B. discoidalis
(F1,15=17, P=0.001; Fig. 4C,D). Lift on B. discoidalis was positive (i.e. acted away from
the substratum) when the animals were 5mm above the substratum, but was negative (i.e. acted towards the substratum) when the animals were 10mm above the substratum (Fig. 4C,D).
Fig. 3. Drag coefficient (CDP, calculated using plan area for S given in the equation presented
in the text) as a function of Reynolds number (Re) for P. americana (A and B) and B. discoidalis (C and D). A and C represent data for a distance of 5mm between the animal’s center of mass and the substratum, whereas B and D represent data for a distance of 10mm above the substratum. Symbols represent angles of attack: 0˚ (filled squares), 15˚ (open circles) and 25˚ (filled triangles). Vertical bars represent one standard error (N=3 in each case). Asterisks indicate that the slope is significantly different from zero.
3
2
1
0
2.0
1.5
1.0
0.5
0.0
2.0
1.5
1.0
0.5
0.0 3
2
1
0
0
1000 2000 3000 4000
1000 2000 3000
1000 2000 3000 4000
4000 0 1000 2000 3000 4000
A B
C D
5mm above substratum P. americana
P. americana
B. discoidalis B. discoidalis
10mm above substratum
[image:7.595.64.419.70.360.2]Speed
Lift increased significantly with an increase in speed for P. americana (F2,40=10,
P<0.001; Fig. 4A,B). Lift changed significantly with an increase in speed for B. discoidalis (F2,14=6.2, P=0.012; Fig. 4C,D). Lift away from the substratum only
changed with speed in B. discoidalis when the animal was 10mm away from the substratum, not when it was 5mm from the substratum.
Angle of attack
Increasing the angle of attack of P. americana increased the lift significantly (F2,40=7.1, P=0.002; Fig. 4A,B). The angle of attack is not altered by B. discoidalis
during locomotion, so this effect was not tested.
Lift coefficient
Lift coefficients for both species decreased as Re increased (as speed or size increased):
P. americana, F2,40=5, P=0.010; Fig. 5A,B; and B. discoidalis, F2,14=4, P=0.04; Fig. 5.
[image:8.595.67.431.76.362.2]96
R. J. F
ULLand M. A. R. K
OEHLFig. 4. Lift as a function of air speed for P. americana (A and B) and B. discoidalis (C and D). A and C represent data for a distance of 5mm between the animal’s center of mass and the substratum, whereas B and D represent data for a distance of 10mm. Symbols represent three angles of attack: 0˚ (filled squares), 15˚ (open circles) and 25˚ (filled triangles). Vertical bars represent one standard error (N=3 in each case). Asterisks indicate that slope is significantly different from zero.
Lift coefficients calculated using frontal area (CLF) were more similar for the two species;
CLPvalues calculated using plan area were greater for the small P. americana than for the
larger B. discoidalis (Fig. 5). In P. americana both CLP and CLF increased with an
increased angle of attack (F2,40=11, P<0.001; Fig. 5A,B).
Discussion
Drag
Mechanical power output
Because drag increases the horizontal force that must be exerted by an animal, drag should raise the power output necessary for running. We measured substantial drag on
P. americana ranging from 3 to 15% of the peak horizontal accelerating force generated
[image:9.595.56.431.70.361.2]by members of this species during constant average-speed locomotion (Full and Tu, 1991). The drag measured on the larger, more slowly moving, B. discoidalis was only 0.8–7.6% of their peak horizontal accelerating force (Full and Tu, 1990).
Fig. 5. Lift coefficient (CLP) as a function of Reynolds number (Re) for P. americana (A and
B) and B. discoidalis (C and D). A and C represent data for a distance of 5mm between the center of mass and the substratum, whereas B and D represent data for a distance of 10mm above the substratum. Symbols represent angles of attack: 0˚ (filled squares), 15˚ (open circles) and 25˚ (filled triangles). Vertical bars represent one standard error (N=3 in each case). Asterisks indicate that the slope is significantly different from zero.
C A
1000 2000 3000 4000
0 1000 2000 3000 4000
1.0
0.8
0.2
0.0
0.50
0.25
0.00
−0.25
−0.50 0.4 0.6
Re P. americana
B. discoidalis
5mm above substratum
B
D 1.0
0.8
0.2
0.0
0.50
0.25
0.00
−0.25
−0.50 0.4 0.6
P. americana
B. discoidalis
10mm above substratum
1000 2000 3000 4000
0 1000 2000 3000 4000
When running rapidly, the American cockroach makes postural adjustments (Full and Tu, 1991) that affect drag: a higher angle of attack increases drag, while a greater height above the substratum lowers it. If the American cockroach made neither postural adjustment when running rapidly, then drag experienced at top speed would be 12 % greater than actually experienced.
The mechanical power generated by running animals to lift and accelerate their center of mass (E˙c m) is determined by summing the increases in instantaneous energy of the
center of mass (i.e. the instantaneous sum of vertical and horizontal kinetic energy and gravitational potential energy) over an integral number of strides and dividing by the duration of those strides (as described by Heglund et al. 1982; Full and Tu, 1990).
B. discoidalis (Full and Tu, 1990), crabs (Blickhan and Full, 1987), birds and mammals
(e.g. Cavagna et al. 1977; Heglund et al. 1982) show a linear increase in E˙c mwith speed.
Furthermore, E˙c mis directly proportional to body mass for all these species. Therefore, a
single linear function of mass-specific E˙c mversus speed describes the mechanical power
output of pedestrian locomotion for the wide range of species mentioned above (Full, 1989). This function can be used to predict the mechanical power output generated to move an animal’s body during terrestrial locomotion (i.e. dashed line in Fig. 6).
Unlike the other species studied thus far, P. americana shows a curvilinear increase in
98
R. J. F
ULLand M. A. R. K
OEHLFig. 6. Contribution of drag to the mechanical power output used to move the center of mass as a function of running speed for P. americana (Full and Tu, 1991; open circles) and B. discoidalis (Full and Tu, 1990; filled circles). The dashed line represents the predicted mechanical power output required to lift and accelerate the center of mass based on data for a variety of other running animals (Full, 1989, 1991). Squares represent the contribution of drag to the mechanical power output required to move the center of mass of P. americana (open squares) and B. discoidalis (filled squares). The power output caused by drag was calculated, as described in the text, using the angle of attack and the distance of the body center of mass above the substratum used by each species: P. americana 0.6 ms21, 5mm, 0˚; 1.0 ms21,
10mm, 15˚; 1.5 ms21, 10mm, 25˚; B. discoidalis 0.3 ms21, 5mm, 0˚; 0.6 ms21, 5mm, 0˚;
E˙c m with speed (Full and Tu, 1991) such that at high speeds E˙c m was greater than
predicted for a 1g animal (Fig. 6; Full, 1989). The additional power output generated at high speeds was almost exclusively in the horizontal direction (Full and Tu, 1991), the direction in which drag acts. We determined the power output necessary to overcome drag by multiplying the air speed relative to a running animal by the drag measured at each speed (at the angle of attack and distance above the substratum used by the cockroaches at each speed). The mechanical power output that is due to drag alone for
P. americana and for B. discoidalis is shown in Fig. 6. The additional power output to
overcome drag can explain the elevated power output used to move the center of mass in the American cockroach. Hence, drag has a significant effect on the power output of small (i.e. <1g), rapidly running (i.e. >1.0 ms21) insects, such as P. americana, but is of little
consequence to slower, larger runners like B. discoidalis.
Comparison with other insects
The measured drag on running cockroaches is consistent with that measured on the bodies (‘parasite drag’, e.g. Pennycuick, 1972) of insects flying and swimming over a similar range of Reynolds numbers. Values of drag coefficients based on plan area (CDP)
for running cockroaches (Fig. 3) ranged from 0.3 to 2.6, whereas CDP values for
bumblebees vary from 0.12 to 0.95 (Dudley and Ellington, 1990). Drag coefficients calculated using frontal area (CDF) ranged from 1.9 to 3.6 in cockroaches and are 1.5 for
locusts (Weis-Fogh, 1956), 0.5 for beetles (Nachtigall, 1964) and 1.1–2.3 for flies (Hocking, 1953; Vogel, 1981). The CDPvalues of these insects are greater than those of a
streamlined body (e.g. 0.16 at an Re of 1000; Hoerner, 1958; Dudley and Ellington, 1990) and a sphere (e.g. 0.25 at an Re of 1000; Hoerner, 1958).
A decrease in CD with an increase in air speed, as we observed for P. americana
(Fig. 3), has also been found for the parasite drag on flying insects (Hocking, 1953; Weis-Fogh, 1956; Vogel, 1966; Chance, 1975; Dudley and Ellington, 1990). Consequently, drag on the bodies of these flying or running insects did not increase with the square of velocity (as it would if CDwere constant), but followed a more linear function of air speed
(Fig. 2). In addition to this decrease in CDwith an increase in Re, the increase in distance
above the substratum (described above) that P. americana undergoes when running at high speeds further reduces the drag during rapid locomotion.
Although the drag on the bodies of flying and of rapidly running insects is comparable, the importance of that drag to the total power output of fliers and runners is quite different. In running P. americana, drag accounts for 20–36% of the total E˙c mat speeds
ranging from 1.0 to 1.5 ms21(Fig. 6). If American cockroaches did not experience this
drag, it is possible that they could attain speeds approaching 2 ms21(i.e. simply because
(4–5 ms21) thus far investigated, whereas the contribution of body drag to total power
output appears to be critical for small, rapidly running animals.
Lift
Although lift should affect the power output during running by altering functional body weight, the magnitude of lift on running cockroaches was so small that this effect was negligible. Lift acted away from the substratum (thereby decreasing functional weight) for P. americana, but maximum lift was only 1.8% of body weight, even at the highest speed (1.5 ms21) and greatest angle of attack (25˚) tested. In contrast, lift was either too
low to be measured or acted towards the substratum (thereby increasing functional weight) for B. discoidalis, but the maximum force was only 0.3% of body weight. Even if the effects of lift were large, power output generated to move the center of mass vertically at high speeds is only a small fraction (10%) of the total power output (Full and Tu, 1991).
Our finding that lift on a cockroach was small when compared with the animal’s weight is consistent with previous measurements of lift on the bodies of flying insects traveling at comparable or greater speeds. Lift on the bodies of bumblebees was found to be less than 7 % of body weight (i.e. angles of attack, a, of 0–45˚ and speeds, U, of 1–4ms21; Dudley
and Ellington, 1990); lift on the bodies of beetles was 3% of body weight (i.e. a=40˚ and
U=2.3 ms21; Nachtigall, 1964); of flies 4% (i.e. a=10˚ and U=2 ms21; Wood, 1970);
and of moths 10% (i.e. a=25˚ and U=4 ms21; Chance, 1975). Therefore, although drag
on rapidly running insects can increase the mechanical power output of locomotion, lift only makes a minor contribution to decreasing or increasing power output.
Although aerodynamic forces have negligible effects on the power output generated for terrestrial locomotion by many large animals, drag cannot be ignored for small, rapidly running insects. Drag on the bodies of such insects can significantly increase the power output required for running, in contrast to its minor contribution to the power output required for insect flight.
We thank Michael Tu and Alexa Tullis for their aid in collecting the data and C. Loudon, R. Kram and C. Farley for comments on the manuscript. This work was supported by NSF Grant DCB 89-0458689 to R.J.F. and by a Guggenheim Memorial Foundation Fellowship, a John D. and Catherine T. MacArthur Foundation Fellowship Award and an NSF Grant OCE 89-17404 to M.A.R.K.
References
ALEXANDER, R. MCN. (1977). Terrestrial locomotion. In Mechanics and Energetics of Animal Locomotion (ed. R. McN. Alexander and T. Goldspink), pp. 168–203. New York: Wiley and Sons. BARTHOLOMEW, G. A., LIGHTON, J. R. B. ANDLOUW, G. N.(1985). Energetics of locomotion and patterns
of respiration in tenebrionid beetles from the Namib desert. J. comp. Physiol. 155, 155–162.
BILL, R. G. ANDHERRNKIND, W. F. (1976). Drag reduction by formation movement in spiny lobsters.
Science 193, 1146–1148.
BLICKHAN, R. ANDFULL, R. J. (1987). Locomotion energetics of the ghost crab. II. Mechanics of the
center of mass during walking and running. J. exp. Biol. 130, 155–174.
CAMBELL, G. S.(1986). An Introduction to Environmental Biophysics. New York: Springer-Verlag.
CASEY, T. M. ANDELLINGTON, C. P. (1989). Energetics of insect flight. In Energy Transformations in
Cells and Organisms (ed. W. Wieser and E. Gnaiger), pp. 200–210. Stuttgart: Georg Thieme Verlag. CAVAGNA, G. A., HEGLUND, N. C. ANDTAYLOR, C. R.(1977). Mechanical work in terrestrial locomotion:
two basic mechanisms for minimizing energy expenditure. Am. J. Physiol. 233, R243–R261. CHANCE, M. A. C. (1975). Air flow of the flight of a noctuid moth. In Swimming and Flying in Nature,
vol. 2 (ed. T. Y. Wu, C. J. Brokaw and C. Brennen), pp. 829–843. New York: Plenum Press.
DANIEL, T. L. (1991). Efficiency in aquatic locomotion: limitations from single cells to animals. In
Concepts of Efficiency, Economy and Related Concepts in Comparative Animal Physiology (ed. R. W. Blake), pp. 83–95. New York: Cambridge University Press.
DELCOMYN, F. (1971). The locomotion of the cockroach, Periplaneta americana. J. exp. Biol. 54,
443–452.
DUDLEY, R. ANDELLINGTON, C. P. (1990). Mechanics of forward flight in bumblebees. II. Quasi-steady
lift and power requirements. J. exp. Biol. 148, 53–88.
ELLINGTON, C. P.(1991). Limitations on animal flight performance. J. exp. Biol. 160, 71–91.
EMERSON, S. B. ANDKOEHL, M. A. R.(1990). The interaction of behavioral and morphological change in
the evolution of a novel locomotor type: ‘Flying’ frogs. Evolution 44, 1931–1946.
FULL, R. J. (1989). Mechanics and energetics of terrestrial locomotion: bipeds to polypeds. In Energy
Transformations in Cells and Organisms (ed. W. Wieser and E. Gnaiger), pp. 175–182. Stuttgart: Georg Thieme Verlag.
FULL, R. J. (1991). Concepts of efficiency and economy in land locomotion. In Concepts of Efficiency,
Economy and Related Concepts in Comparative Animal Physiology (ed. R. W. Blake), pp. 97–131. New York: Cambridge University Press.
FULL, R. J. ANDTU, M. S.(1990). The mechanics of six-legged runners. J. exp. Biol. 148, 129–146.
FULL, R. J. ANDTU, M. S. (1991). Mechanics of rapid running insects: two-, four- and six-legged
locomotion. J. exp. Biol. 156, 215–231.
GARLAND, T., JR(1983). The relationship between maximal running speed and body mass in terrestrial
mammals. J. Zool., Lond. 199, 157–170.
HEGLUND, N. C., CAVAGNA, G. A. ANDTAYLOR, C. R. (1982). Energetics and mechanics of terrestrial
locomotion. III. Energy changes of the center of mass as a function of speed and body size in birds and mammals. J. exp. Biol. 79, 41–56.
HOCKING, B. (1953). The intrinsic range and speed of flight in insects. Trans. R. ent. Soc. Lond. 104,
223–345.
HOERNER, S. F.(1958). Fluid-dynamic Drag. Brick Town, NJ: S. F. Hoerner.
KINGSOLVER, J. G. ANDKOEHL, M. A. R. (1985). Aerodynamics, thermoregulation and the evolution of
insect wings: Differential scaling and evolutionary change. Evolution 39, 488–504.
MCCONNELL, E. ANDRICHARDS, A. G. (1955). How fast can a cockroach run? Bull. Brooklyn ent. Soc.
50, 36–43.
NACHTIGALL, W. (1964). Zur Aerodynamik des Coleopterenfluges: wirken die Elytern als Tragflügel?
Verh. dt. Zool. Ges. (Kiel). 58, 319–326.
PANKHURST, R. C. ANDHOLDER, D. W. (1952). Wind-Tunnel Technique. London: Sir Isaac Pitman and
Sons.
PENNYCUICK, C.(1972). Animal Flight. London: Edward Arnold.
PUGH, L. G. C. E. (1971). The influence of wind resistance in running and walking and the mechanical
efficiency of work against horizontal or vertical forces. J. Physiol., Lond. 213, 255–276.
SCHMIDT-NIELSEN, K.(1983). Animal Physiology: Adaptation and Environment. Cambridge: Cambridge
University Press. 619pp.
TRITTON, D. J.(1977). Physical Fluid Dynamics. Workingham, UK: Van Nostrand Reinhold.
TUCKER, V. A. (1990). Measuring aerodynamic interference drag between a bird body and the mounting
strut of a drag balance. J. exp. Biol. 154, 439–461.
VOGEL, S.(1966). Flight in Drosophila. I. Flight performance in tethered flies. J. exp. Biol. 44, 567–578.
VOGEL, S.(1981). Life in Moving Fluids. Boston: Willard Grant Press.
WEIS-FOGH, T. (1956). Biology and physics of locust flight. II. Flight performance of the desert locust
(Schistocerca gregaria). Phil. Trans. R. Soc. Lond. B 239, 459–510.
WOOD, J. (1970). A study of the instantaneous air velocities in a plane behind the wings of certain