MR Assessment o
f
Pituitary Gland Morphology in Healthy
Volunteers: Age- and Gender-Related Differences
P. Murali Doraiswamy, 1 Jonathan M. Potts,3 David A. Axelson, 1 Mustafa M. Husain,5 Scott N. Lurie, 1 Chul Na, 1
P. Rodrigo Escalona,1 William M. McDonald,1
Gary S. Figiel,4
Everett H. Ellinwood, Jr.,1
Orest B. Boyko,2 and K. Ranga Krishnan1·6
PURPOSE AND METHODS: High-field MR images at 1.5 T were used to characterize the effects of age and gender on pituitary size and shape in a sample of 71 adult volunteers (40 females), aged 21 to 82 years. FINDINGS: For all subjects, age was inversely correlated with pituitary height (r = - .43, P < .0002) and cross-sectional area (r = - .35, P < .0028). Age-specific gender differences were also present in pituitary height and area. A convex upper pituitary margin was more common in females (P = .002) and younger subjects (P = .009). CONCLUSIONS: This study confirms that aging is accompanied by gender-specific changes in pituitary size and shape, and provides normative data that may facilitate evaluation of the pituitary gland in neuroendocrine disorders.
Index terms: Pituitary gland; Pituitary gland, magnetic resonance
AJNR 13:1295-1299, Sep/Oct 1992
MR is important in assessing the in vivo shape (1-4), dimensions (2, 5-7), and pathology (8) of the pituitary gland. Prior MR studies have char-acterized the maturation of the pituitary gland during early childhood (7) as well as during pu-berty (1). Hayakawa et al (7) studied 94 patients, newborn to 15 years old, and showed that, except for growth spurts in the 1st year and between the 1Oth and 15th years, the pituitary gland showed linear growth. Elster et al (1), in an elegant study of 169 children and adolescents, confirmed Peys-ter's hypothesis (9) that the pituitary gland
under-Received May 1, 1991; revision requested July 31; revision received on August 21; accepted after additional revision November 27.
This work was supported by NIMH Grant MH-44716, MH-42210, and the Stanley Fellowship.
1
Department of Psychiatry, Duke University Medical Center, Durham, NC.
2
Department of Radiology, Duke University Medical Center, Durham, NC.
3
Department of Radiology and Nuclear Medicine, Medical University of South Carolina, Charleston, SC.
4
Department of Psychiatry, Washington University School of Medi-cine, St. Louis, MO.
5
Department of Psychiatry, UT-Southwestern School of Medicine, Dallas, TX.
6
Address reprint requests to Ranga Krishnan, MD, Box 3215, Duke University Medical Center, Durham, NC 27710.
AJNR 13:1295-1299, Sep/Oct 1992 0195-6108/92/1305-1295 © American Society of Neuroradiology
goes physiologic hypertrophy during puberty. This, they suggested, is manifested in girls by a significant enlargement in pituitary size and the frequent presence of a spherical or convex upper pituitary margin, whereas the glands of teenage boys undergo a transformation in size only.
Two recent MR studies (7, 1 0) have examined age-related changes in the adult pituitary gland. Using a low field (0.35 T) MR, Hayakawa et al (7), in 49 patients and seven volunteers aged 16-60 years, found that pituitary gland height and cross-sectional area were both less for subjects over 50 years of age than for those under 40 years of age. Suzuki et al (10) studied a group of 213 patients and showed that pituitary height de-creases with increasing age after the age of 20 years.
Since both these studies were based on patient populations rather than healthy volunteers, we undertook a large cross-sectional MR study of pituitary morphology in adult community volun-teers. In a preliminary report on 35 healthy vol-unteers (5), we found a significant age-related decline in pituitary gland cross-sectional area and height, although the limited sample size did not permit age-specific subgroup comparisons.
1296 DORAISWAMY
of 71 adult volunteers and further characterizes
age- and gender-related differences in pituitary
size and morphology.
Methods
Subjects
The study was approved by the Duke University Medical
Center Institutional Review Board. Written informed con-sent was obtained from all subjects prior to their partici-pation. All premenopausal women had a negative f}-hCG test to rule out pregnancy. We studied 71 volunteers (40
females and 31 males), aged 21-82 years, recruited from
the community and medical center health staff. None of
the subjects had a current clinical indication for a brain MR
and all were scanned for ongoing research studies. Efforts
were made to recruit approximately equal numbers of
males and females in each decade. All subjects were free
of significant current neuroendocrine (except as specified below), neurologic, and psychiatric disorders as determined by history and physical examination. Ten subjects who had undergone a hysterectomy and two postmenopausal women on replacement estrogen were not excluded. One
subject had thyroiditis 2 years ago, but his recent thyroid function tests and clinical exam were within normal limits. Four women had been (or were being) treated for hypothy-roidism, one of whom (a 59-year-old) also reported a past history of amenorrhea following pregnancy. These subjects
were included since all were judged on clinical grounds to
be currently euthyroid and since reanalysis after exclusion of the latter four subjects revealed an essentially identical
and highly significant relationship between age and
pitui-tary height (r = -.46, P < .0001). The overall group of 71
subjects consists of 35 subjects who were included in our preliminary report (5) and an additional 36 subjects. Table 1 presents the composition of this group.
MR Acquisition and Pituitary Gland Measurements
MR was performed on a 1.5-T system. Sagittal images
obtained using T1-weighted spin-echo pulse sequences
were used for all measurements and data analysis. TR/TE/
excitations/matrix/field of view /thickness (mm)/intersca!l
gap (mm) were as follows: For the 36 new volunteer
subjects, pulse sequence parameters were 500/20/.5/
256X 128/20/4/1. Parameters for 23 of the original 35 subjects were 500/20/1/256X128/20/5/2.5. For the
re-maining 12 subjects, parameters varied as shown below
and as reported previously (5). Parameters were 500/20/
2/256X 128/20/5/2.5 for four subjects; 500/20/4/
256X256/20/5/2.5 for two subjects; 500/20/1/256X 192/
20/5/2.5 for three subjects; 500/20/2/256X 192/20/5/2.5
for one subject; 500/20/4/256X256/20/3/0 for one
sub-ject; 500/20/1/256X128/20/4/1 for one subject. The var-iations in the original group of subjects resulted from initial
efforts to minimize acquisition time and improve visuali-zation of other structures. These variations were unrelated
to age (5). The imaging protocol for all 71 subjects also
AJNR: 13, September /October 1992
included a T1-and T2-weighted axial series. A T1-weighted
contiguous coronal series was also obtained for the original
35 subjects, but not for the additional 36. All scans available were evaluated by a neuroradiologist to rule out
macroad-enomas and mass lesions. The lack of coronal images in some subjects or contrast enhancement prevented com-plete exclusion of microadenomas.
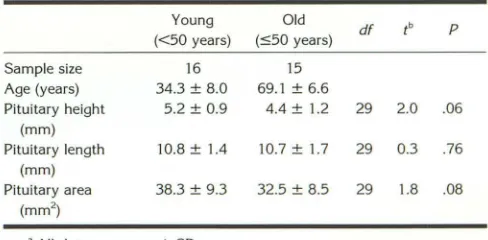
The sagittal and midsagittal images were graphically prescribed and selected at the time of image acquisition by identifying the sella using an axial series. The pituitary gland was measured for height, length, and cross-sectional area on the midsagittal image as shown in Figure 1 and as reported previously (2, 5). Pituitary height was measured as the maximum height drawn perpendicular to the floor of the sella. Length was the maximum anteroposterior diameter parallel to the floor of the sella. Linear measure-ments were obtained using the Measure Distance program available with GE Signa software on an offline console with twofold magnification of images. Pituitary area was meas-ured using the ROI program on Signa software, without magnification, by manually tracing the outline of the gland with a tracball controlled cursor. The hyperintense area in the posterior portion of the gland (routinely seen on Tl-weighted images) was included in the measurements (7). Subjects with a partially empty sella were not excluded since this condition is common in normal subjects (5, 6, 8).
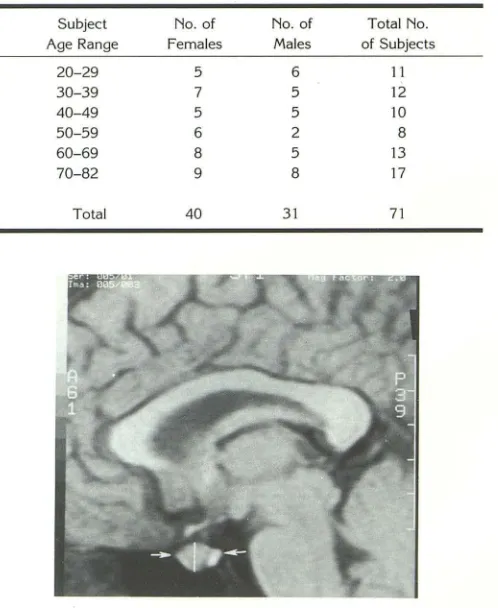
TABLE 1: Distribution of volunteers by age and gender
Subject No. of No. of Total No.
Age Range Females Males of Subjects
20-29 5 6 11
30-39 7 5 12
40-49 5 5 10
50-59 6 2 8
60-69 8 5 13
70-82 9 8 17
Total 40 31 71
Fig. 1. Central line indicates pituitary height. Arrows indicate
[image:2.612.317.566.416.720.2]AJNR: 13, September /October 1992
All measurements were obtained blinded to the age and gender of the subjects and represent the average of two independent ratings (P.M.D./S.N.L. for the initial 35 sub-jects and P.M.D./J.M.P. for the rest). lnterrater reliability as assessed by Pearsons correlation coefficients Y'as ex-cellent: for pituitary height r
=
.96, P < .0001 (P.M.D./ S.N.L. and P.M.D./J.M.P.); pituitary length r= .93 (P.M.D./ S.N.L.) and .85 (P.M.D./J.M.P.), P < .0001; pituitary area r = .88 (P.M.D./S.N.L.) and r = .92 (P.M.D./J.M.P.), P < .0001. The superior margin (upper border) of the pituitary gland was classified into one of two categories: flat/concave (Elster grades 1/2/3) or convex/spherical (Elster grades 4/ 5) as per Elster et al (1). This was done by the consensus judgment of the raters who were blinded to the subject's age and gender. Similar methods have been used by the rater(s) in several previous studies (2, 4-6).Statistical Analyses
Data was analyzed using PC-SAS (SAS Institute, Cary, NC). Pearson correlation coefficients were used to examine correlations between pituitary measurements and age. Spearman correlation coefficients were almost identical. Subjects were divided into under 50 years and over 50 years to enable comparison with our previous study. Dif-ferences between these two groups were analyzed using the Student's two-tailed t-test (since variances were almost identical). The nonparametric Kruskai-Wallis (x2
approxi-mation) test yielded essentially identical results. We then further subdivided the sample into three groups: 21-40 years ("young or premenopausal"), 41-64 years ("transi
-tional period or perimenopausal"), and 65 years or older ("elderly or postmenopausal"). Between groups, differences were tested using analysis of variance (ANOV A) (NPAR 1 WAY). Gender differences within each of the three groups were tested using the nonparametric Wilcoxon's 2-sample test (normal approximation with continuity correction of .5) because pituitary heights and areas showed greater variability in women than in men. The Fisher's Exact test (two-tailed) was used to compare the shape of the pituitary between those under 50 and those older, and between males and females.
Results
The mean (±SD) for age, pituitary height,
length, and cross-sectional area for all subjects was 52 years (±18), 5.1 mm (±1.5), 10.6 mm (± 1.5), and 38.3 mm2 (±12), respectively. For all subjects, age was inversely correlated with pitui-tary height (r
=
-.43, P<
.0002) and area (r=
-.35, P
<
.003), but not length (r = -0.12, P<
.32). Pituitary area correlated well with pituitary height (r=
.80, P<
.0001). Subjects under 50 years of age had larger pituitary height ( t = 3.2, df=
69, P<
.003) and area ( t=
2.5, df=
69, P<
.01) than subjects over 50 years (Table 2). Pituitary length did not differ between the youngMR ASSESSMENT OF THE PITUITARY 1297
TABLE 2: Pituitary gland morphology: the effect of age•
Young (<50 yr)
Sample size 33
Male/female 16/17
Mean (± SD) age 34.2 ± 7.8 (years)
Pituitary height 5.7±1.4 (mm)
Pituitary length 10.8 ± 1.2 (mm)
Pituitary area 42.2 ± 12
(mm2 )
Number of sub- 10
jects with a (30%) convex pitui
-tary
• All data are mean ± SD.
b Student's two-tailed 1-test.
c x2 test (x2 = 0.58).
d Two-tailed Fisher's Exact test.
Old
df
(>50 yr)
lb p
38
15/23 .45<
67.6 ± 7.2 -18.8 69 .000
4.6 ± 1.4 3.2 69 .002
10.5 ± 1.7 0.8 69 .42
34.9 ± 12 2.5 69 .01
2 .009d
(5%)
TABLE 3: Pituitary gland morphology: the effect of age in females•
Young Old
df lb p
(<50 yr) (~50 yr)
Sample size 17 23
Age (years) 34.1 ± 7.8 66.6 ± 7.5
Pituitary height 6.1 ± 1.7 4.7 ± 1.5 38 2.8 .01
(mm)
Pituitary length 10.8 ± 1.1 10.4 ± 1.7 37.2 0.8 .44
(mm)
Pituitary area 45.8 ± 13.7 36.5 ± 13.3 38 2.2 .04
(mm2
)
'All data are mean ± SD.
b Student's two-tailed t-test.
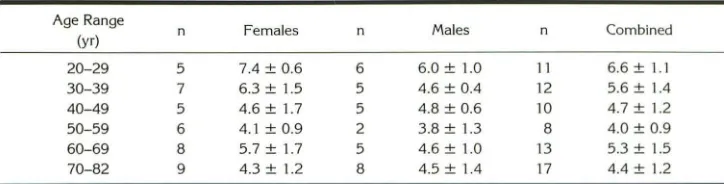
TABLE 4: Pituitary gland morphology: the effect of age in males'
Sample size Age (years) Pituitary height
Young (<50 years)
16 34.3 ± 8.0
5.2 ± 0.9
Old
(~50 years) df tb p
15 69.1 ± 6.6
4.4 ± 1.2 29 2.0 .06
(mm) Pituitary length
(mm) Pituitary area
(mm2 )
10.8 ± 1.4 10.7 ± 1.7 29 0.3 .76
38.3 ± 9.3 32.5 ± 8.5 29 1.8 .08
• All data are mean ± SD. b Student's two-tailed t-test.
and old groups. Tables 3 and 4 show gender-specific comparisons. In male subjects, the age effects did not reach significance.
[image:3.612.316.558.96.276.2] [image:3.612.318.560.342.484.2] [image:3.612.316.560.506.626.2]1298 DORAISWAMY
'E
E .'E.~
Q)
..c:
>-....
. ~
.a
a:
10~---,
3 0
Key
0 0 0 •
0 - Females (R'2 = 0.34) • - Males (R'2 = 0.27)
Age
•
Fig. 2. Age versus pituitary height.
0 0
6 mm and of these, 10 (25%) exceeded 7 mm.
Twelve of 14 (81 %) women in the 20-40 year
range had pituitaries that exceeded 6 mm in height and of these, seven (58%) exceeded 7
mm. In the 41-64 year range, only one (10%) of 11 exceeded 6 mm. Five of 15 women (33%) in
the 65-78 year range had pituitary heights that
exceeded 6 mm and of these, three (20%)
ex-ceeded 7 mm. ANOV A confirmed the highly
significant differences in pituitary height between
the three groups (f = 8.3, P
<
.001). Pituitaryheights for women in the 20-40 year ranges were
larger than women in the older age groups (P
<
. 05). Pituitary heights in women age 30-39,
40-49, and 60-69 years showed considerably greater
variability than males of similar age (Table 5).
In male subjects, also, pituitary height declined
between the ages of 20 and 65 (Fig. 2), although
age effects were clearly less prominent than that
observed among women. Only three of 31 (10%)
males (all three within the 20-30 age range) had
pituitary heights greater than 6 mm and of these,
only one exceeded 7 mm. Differences in pituitary
heights between the 20-40, 41-64, and 65 plus
groups did not reach significance (f = 2.8, P
<
.08).Age-specific gender differences were
signifi-cant in the 20-40 age group (Rank Sum = 114;
Wilcoxon's test, P
<
.01) with larger pituitaryheights among female subjects. Visual
examina-tion of the upper pituitary margin revealed gender
differences. A convex upper pituitary margin was present in 11 females, but in only one male (P
<
.0016). Nine females below 50 years (53%) had
AJNR: 13, September/October 1992
a convex upper margin compared with two
fe-males over 50 years (9%) of age.
There were no group differences between the original 35 subjects and the additional 36 in pituitary measurements.
DISCUSSION
The main findings were as follows: Pituitary height and cross-sectional area declined with in-creasing age in both males and females between the ages of 20 and 65. This decline was highly significant in women, but not in men. Female subjects in the 20-40 age group had larger pitui-taries than males of similar age. Young female subjects also showed a greater prevalence of a convex upper pituitary margin than males of all ages and older females. In the 30-39 and 40-49 age groups, the variability in pituitary heights was approximately threefold greater in female than in
male subjects.
These results are consistent with our prelimi-nary report (5). The mean dimensions of pituitary height in our volunteer subjects are similar to those reported from coronal CT (9, 11, 13) and midsagittal MR (7) studies in adult populations. The age-related decline in pituitary height and area is consistent with prior midsagittal MR stud-ies in patient populations (7, 1 0). The prevalence of a convex upper pituitary border in female subjects under 50 years in the present study is
similar to that reported previously by our group
(5), by Swartz et al (44% of 50 women of
child-bearing age) (11), and recently by Elster et al (1) . Our protocol, by not including coronal images in some subjects or contrast enhancement, was not optimal to completely excluding pituitary
mi-croadenomas. Coronal images for the two older women with pituitary convexity were normal, although we cannot exclude the presence of an associated microadenoma (probably
nonfunc-tional) in these two subjects.
The functional significance of our findings re-mains speculative. Two previous studies have suggested that changes in the endocrine milieu
may be reflected in pituitary morphology (6, 12). The increased prevalence of pituitary convexity and the larger pituitary heights in young women
may reflect physiologic neuroendocrine differ-ences between young women and men. This is
further supported by the lower prevalence of pituitary convexity in older women than younger
[image:4.614.56.299.77.296.2]AJNR: 13, September /October 1992 MR ASSESSMENT OF THE PITUITARY 1299
TABLE 5: Age- and gender-specific pituitary heights
Pituitary Gland Height (mm) (mean ± SD)
Age Range
(yr) n Females
20-29 5 7.4 ± 0.6
30-39 7 6.3 ± 1.5
40-49 5 4.6 ± 1.7
50-59 6 4.1 ± 0.9
60-69 8 5.7 ± 1.7
70-82 9 4.3 ± 1.2
physiologic pituitary "hypertrophy_" This hyper-plasia in young adult females appears to be re-lated to endocrine changes associated with nor-mal menarche and is relatively uncommon in older females or in males (1).
The decline in pituitary gland size between the second and sixth decades of life may likewise reflect the neuroendocrinology of aging and a physiologic pituitary "atrophy." We speculate that this may also be related to chronologie changes
in the activity of the hypothalamo-pituitary-go
-nadal axis. It has been reported that basal serum
~oncentrations of gonadotropic hormones
(lutein-izing hormone and follicle-stimulating hormone) decline after puberty up to the fifth decade (14).
However, concentrations of these hormones then
begin to increase dramatically in the fifth and
sixth decades (14), apparently due to an
age-related decline in circulating gonadal steroids (loss of feedback) and an increased "drive" from
go-nadotrophic-releasing hormone. Thus,
specula-tively, the larger pituitary heights observed in some of the elderly subjects over 65 years could reflect a compensatory hypertrophy following a
greater loss of gonadal steroid feedback.
Correl-ative endocrine studies as well as longitudinal MR studies are clearly needed to test this hypothesis and to elucidate the functional significance of differences in pituitary size and shape.
The neuroendocrine milieu reflects an
impor-tant pathway in which patterns of diet, weight,
activity, stress, and mood, as well as
hypothal-amic function are expressed (4). Whether such
endocrine changes are reflected in pituitary size
and shape deserves further study. MR provides a
useful noninvasive means to help test such
hy-potheses. In conclusion, our study provides
nor-mative data on pituitary size and shape for a
group of 71 adult volunteers. These data should facilitate further evaluation of pituitary morphol-ogy in neuroendocrine disorders.
n
6 5 5 2 5 8
Males n Combined
6.0 ± 1.0 11 6.6 ± 1.1
4.6 ± 0.4 12 5.6 ± 1.4
4.8 ± 0.6 10 4.7 ± 1.2
3.8 ± 1.3 8 4.0 ± 0.9
4.6 ± 1.0 13 5.3 ± 1.5
4.5 ± 1.4 17 4.4 ± 1.2
Acknowledgments
We are grateful to Robert A. Burn, RT and the MR staff for their expert technical assistance.
References
1. Elster AD, Chen MY, Williams DW, Key LL. Pituitary gland: MR
imaging of physiologic hypertrophy in adolescence. Radiology 1990;174:681-685
2. Doraiswamy PM, Krishnan KRR, Figiel GS, et al. A brain magnetic
resonance imaging study of pituitary gland morphology in anorexia
nervosa and bulimia. Bioi Psychiatry 1990;28: 110-116
3. Doraiswamy PM, Potts JM, Figiel GS, Boyko OB, Krishnan KR. MR
imaging of physiologic pituitary gland hypertrophy in adolescence.
Radiology 1991; 178:284-285
4. Doraiswamy PM, Krishnan KRR, Boyko OB, et al. Pituitary abnor
-malities in eating disorders: further evidence from MRI studies. Prog Neuropsychopharmacol Bioi Psychiatry 1991;15:351-356
5. Lurie SN, Doraiswamy PM, Husain MM, et al. In vivo assessment of
pituitary gland volume with MRI: effect of age. J C/in Endocrinol Me tab 1990; 71 :505-508
6. Krishnan KRR, Doraiswamy PM, Lurie SN, et al. Pituitary size in depression. J C/in Endocrinol /11etab 1991; 72:256-259
7. Hayakawa K, Konishi Y, Matsuda T, et al. Development and aging of brain midline structures: assessment with MR imaging. Radiology
1989;172:171-177
8. Chakeres DW, Curtin A, Ford G. Magnetic resonance imaging of
pituitary and parasellar abnormalities. Radio/ C/in North Am
1989;27:265-281
9. Peyster RG, Hoover ED, Viscarello RR, Moshang T, Haskin ME. CT
appearance of the adolescent and preadolescent pituitary gland.
AJNR 1983;4:411-414
10. Suzuki M, Takashima T, Kadoya M, et al. Height of the normal pituitary gland on MR imaging: age and sex differentiation. J Comput Assist Tomogr 1990;1491:36-39
11. Swartz JD, Russell KB, Basile BA, O'Donnell PC, Popky GL. High resolution CT appearance of the intrasellar contents in women of child bearing age. Radiology 1983;147:115-117
12. Gonzalez J, Elizondo G, Saldivar D, et al. Pituitary gland growth during normal pregnancy: an in vivo study using magnetic resonance
imaging. Am J /11ed 1988;85:217 -220
13. Wolpert SM, Molitch ME, Goldman JA, Wood JB. Size, shape and
appearance of the normal female pituitary gland. AJNR 1984;5:263-267
14. Simpkins JW, Estes KS. Role of Monoaminergic Neurons in the
age-related alterations in anterior pituitary secretion. In: Nemeroff CB,
Dunn AJ, eds. Peptides, hormones and behavior. New York:
[image:5.614.121.483.114.206.2]