Comparison of Lesion Enhancement on Spin-Echo and Gradient-Echo
Images
Phylliss M. Chappell, 1 Norbert J. Pelc, 1
Thomas K. F. Foo,2
Gary H. Glover, 1
S. Patricia Haros, 1
and Dieter R. Enzmann 1
PURPOSE: To compare lesion enhancement after injection of gadopentetate dimeglumine on
spin-echo and gradient-echo T1-weighted images. METHODS: A total of 48 contrast-enhancing
intracranial lesions were evaluated using a spin-echo and two gradient-echo T1-weighted pulse
sequences. Percent contrast, contrast-to-noise, and signal-to-noise measurements were made on
the spin-echo T1-weighted, three-dimensional gradient-echo, and multiplanar gradient-echo
se-quences. RESULTS: The measurements were somewhat different for the following categories of
lesions: extraaxial, intraaxial with edema, and intraaxial without edema. The latter group provided
the greatest diagnostic challenge: three of 19 such lesions 1 em in size or smaller could not be
identified on three-dimensional gradient-echo images, and one could not be identified on
multi-planar gradient-echo images. The spin-echo T1-weighted sequence demonstrated significantly
higher percent contrast (P < .05) and greater contrast to noise (P < .03) than either gradient-echo sequence for these small intraaxial lesions without edema. For extraaxial and intraaxial lesions with edema, percent C was similar for spin-echo T1-weighted and three-dimensional gradient-echo
images, while contrast to noise was greater for spin-echo T1-weighted images. This reflected
greater tissue noise with gradient-echo sequences. CONCLUSION: The T1-weighted spin-echo sequence was preferred for detecting the full spectrum of contrast-enhancing lesions of the central
nervous system.
Index terms: Magnetic resonance, comparative studies; Magnetic resonance, contrast
enhance-ment; Magnetic resonance, gradient-echo; Magnetic resonance, 3-D
AJNR Am J Neuroradiol 15:37-44, Jan 1994
Improvements in machine hardware and
soft-ware have resulted in new capabilities in scan-ning. One goal has been faster scanning, both for T 1-weighted and T2-weighted images ( 1, 2). The
conventional spin-echo T1-weighted and
T2-weighted pulse sequences have proved valuable
in lesion detection and are considered the current
standard by which different and newer pulse
sequences should be judged. New pulse
se-quences need to be evaluated in the detection of
contrast enhancement of lesions of the central nervous system using gadopentetate
dimeglu-Received August 12, 1992; revision requested October 30; revision received and accepted December 30.
1
Department of Radiology, Stanford University School of Medicine
Stanford, California. Address reprint requests to: Dieter Enzmann, MD, Department of Radiology, S072, Stanford University School of Medicine, Stanford, CA 94305-5105.
2
Present address: General Electric Medical Systems, Milwaukee, WI
.53201.
AJNR 15:37-44, Jan 1994 0195-6108/94/1501-0037 © American Society of Neuroradiology
37
mine even if they appear to be very good
surro-gates for conventional spin-echo images. This
comparison study used measures of contrast to evaluate differences between pulse sequences.
Materials and Methods
Thirty-two patients were randomly selected for this
study and prospectively scanned on the basis of the need for administration of gadopentetae dimeglumine based on clinical history. Five patients had no demonstrable contras t-enhancing lesions; 27 had a variety of contrast-enhancing
intracranial lesions (Table 1). There were 13 female patients
and 14 male patients, ranging in age from 13 to 77 years (mean age 47.6 years). A total of 48 enhancing intracranial
lesions were evaluated: 38 intraaxial and 10 extraaxial (Table 1).
Magnetic resonance (MR) examinations were performed with a 1.5-T magnet (General Electric Medical Systems,
Milwaukee, Wis). In each patient T 1-weighted spin-echo
sagittal (500/20/2 [repetition time/echo time/excitations]),
Tl-weighted spin-echo axial (800/20), and T2-weighted
38 CHAPPELL
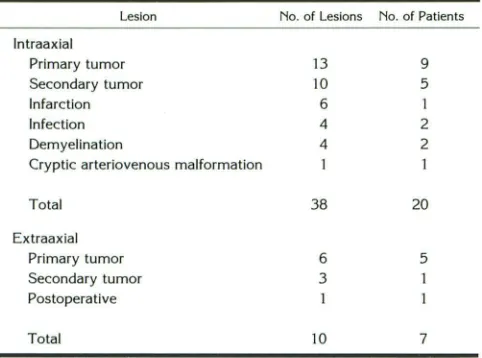
TABLE 1: Distribution of intra-and extraaxial contrast-enhancing lesions
Lesion No. of Lesions No. of Patients
lntraaxial
Primary tumor 13 9
Secondary tumor 10 5
Infarction 6 1
Infection 4 2
Demyelination 4 2
Cryptic arteriovenous malformation
Total 38 20
Extraaxial
Primary tumor 6 5
Secondary tumor 3
Postoperative
Total 10 7
contrast material. Immediately after the intravenous admin-istration of a single dose of gadopentetate dimeglumine (0.1 mmol/kg), the three following sequences were ran-domly performed in the axial plane: 1) spin-echo T1-weighted sequence (800/20) with the acquisition time of 6:53 minutes; 2) spoiled gradient-echo sequence (SPGR) (30/6) and flip angle of 30° with acquistion time of 4:07 min; and 3) multiplanar spoiled gradient-echo sequence (MPSPGR) (247/3.8) and flip angle of 60° with acquistion time of 2:09 min. The section thickness of 5 mm, field of view of 21 em, and matrix size of 256 X 256 were held constant. These studies were performed at two sites, in an inpatient and outpatient setting. One site randomized these sequences well; the other had a predominance of the spin-echo Tl-weighted sequence first. Approximately 60% of the studies were randomized; the others had a potential bias of early imaging after injection for the spin-echo T1-weighted sequence and delayed imaging for the gradient-echo sequences. However, we felt that a delay of, at most, 7 to 8 minutes after injection would not significantly alter the magnitude of contrast enhancement. It has been shown that tumor contrast enhancement does not change signifi-cantly for up to 25 minutes after injection (3). If anything, an early scan could bias the spin-echo T1-weighted image to lower degrees of enhancement because of slow buildup of tissue levels of gadopentetate dimeglumine to a stable,
higher level.
One question that arises in the use of short repetition time gradient-echo imaging is the choice of flip angle.
Some analytical guidance to flip angle selection is useful. If noise is constant, contrast can be defined as the difference in signal between two materials. If the two materials have longitudinal relaxation times of T 1a and T lb and assuming equal spin-density and T 2 * effects, the contrast is t.S =
S(T1a)- S(T1b), where S(T1) is the MR signal for a particular T 1. Because of the simple and useful relationship that results, we approximate the signal difference by t.S = (dS/
dT1)6.T 1, where dS/dT 1 is the derivative of S with respect to T1 evaluated at the average of T1• and T 1b, and 6.T1
=
T 1a - T1b· This differential approximation is particularly
AJNR: 15, January 1994
appropriate when the T 1 difference is small, and this often matches the relevant clinical problem. Thus, differential T 1 contrast C is proportional to dS/dT1. It has been shown that the optimum flip angle, C¥0, which maximizes C, is given by (2, 4): cos(a0 )
=
2E1 - 1/2 - E1, or ao=
cos-1
(2E1 - 1/2 - E1), where E1
=
e·TR/T1 evaluated at the average T1. The optimum flip angle depends only on TR/ T 1, just as the Ernst angle does (5). However, it is instructive to examine it as a function of TR and parametrically as a function of T 1 (Fig 1 ).The flip angles for these gradient-echo sequences were calculated to achieve maximum contrast between subtle contrast-enhancing lesions and adjacent white matter as background. The calculations were based on the assump-tion that the goal of the imaging sequence was to detect subtle contrast-enhancing lesions in white matter, and thereby to detect lesions with a slightly shorter T 1 relaxation time than white matter. The range of T 1 relaxation times for normal white matter (T 1 = 500-700) were obtained from the literature (6-8). The graphs resulting from the calculations used to determine the optimum flip angles for the three-dimensional SPGR and two-dimensional MPSPGR sequences are shown in Figure 1.
In three additional patients with contrast-enhancing le -sions, the following sequences were performed to evaluate the change in white matter background standard deviation as a function of echo time for spin-echo and gradient-echo sequences. The comparison was for spin-echo (800/12 and 800/18) and SPGR (30/12 and 30/18).
Region of interest (ROI) measurements were obtained to determine the mean signal intensity and standard deviation of spin-echo and gradient-echo images for the enhancing lesions, the adjacent background, and the air surrounding the calvarium. The ROI outlined the entire lesion if it was homogenous or the area of maximal contrast enhancement if it was inhomogenous. Identical ROis were used for the same lesion for the three sequences. The range of ROls
90
80
v; Ql 70 ~ Ol Ql 60 :£ ..91 50
Ol c <1l
..
.---
]._...-- .-
.___ y---
v-v
Y . 0::>
[
/<
;
..
c. 40
:;:::
E 30
::1
E
s_ 20
0 10
i
/'
- - s o o m s7:
--- - -600 ms700 ms
1
/
0
0 50 100 150 200 250
TR (ms)
Fig. 1. Optimum flip angle as a function of TR for the SPGR
[image:2.612.59.300.100.279.2] [image:2.612.317.556.505.684.2]AJNR: 15, January 1994
was 0.03 to 12 cm2. Percentage of contrast was then
calculated using the following formula (Sl = signal inten-sity): %C = Silesian - Slbkgd/Slbkgd· Noise was calculated by each of two methods (9): Noise.1, = SI.,,/
.J
1r and Noisebkgd=
StdDevbkgd· Noise.,, represented "thermal" noise. Noisebkgd also included tissue noise (ie, inhomogeneity of background white matter and artifacts).ROis selected for background signal intensity measure-ments were confined to cerebral white matter immediately adjacent to the lesion except for extraaxial lesions. For these, cerebrospinal fluid or gray /white matter was used.
Contrast-to-noise ratios (CNR) and signal-to-noise ratios (SNR) were calculated using each of these noise measure-ments ( 1 0): CNR.,, = Silesian - Slbkgd/Noise.," CNRbkgd = Silesian - Slbkgd/Noisebkgd. and SNRbkgd = Slleslan/Noisebkgd·
The detectability of contrast-enhancing lesions on T1-weighted spin-echo and gradient-echo sequences was com-pared by comparing mean percentage of contrast, CNR.1"
CNRbkgd• and SNRbkgd of four groups of lesions: 1) extraaxial lesions, 2) all intraaxial lesions, 3)intraaxial lesions with edema, and 4) intraaxial lesions without surrounding edema. All values are mean ± SEM (Table 2). Statistical analysis was performed using an analysis of variance and paired t tests.
Results
Extraaxia/ Lesions
The mean and SEM for percentage of contrast, CNRs, and SNR are shown in Table 2 and Figure 2. The mean percent contrast for extraaxial
le-TABLE 2: Mean± SEM of the measures for Tl-weighted, spin-echo,
SPGR, and MPSPGR images
Lesion T1-Weighted SPGR MPSPGR
Extraaxial
Contrast(%) 79.1 ± 14.0 67.9±19.1 27.3 ± 14.6
CNR.,, 35.7 ± 3.8 30.0 ± 5.9 17.3 ± 12.4
CNR••od 29.5 ± 8.6 11.7 ± 3.7 11.9 ± 8.5
SNR••od 61.9± 12.9 29.8 ± 6.5 59.3 ± 16.7
All intraaxial
Contrast(%) 51.4±4.7 48.5 ± 7.9 24.5 ± 4.3
CNR.,, 26.4 ± 2.4 24.8 ± 3.2 26.7 ± 4.9
CNR••od 24.5 ± 4.0 10.0 ± 1.7 10.8 ± 1.6
SNRbkgd 75.0 ± 10.4 37. ± 3.8 66.3 ± 7.0
lntraaxial with edema
Contrast(%) 61.8 ± 7.9 74.0 ± 12.5 33.2 ± 5.4
CNR.,, 30.6 ± .8 31.3 ± 4.8 23.6 ± 3.5
CNRbkgd 29.4 ± 5.3 13.5 ± 2.7 14.4 ± 2.2 SNR••od 83.4 ± 12.2 34.7 ± 4.6 67.7 ± 10.6
lntraaxial without edema
Contrast (%) 41.0 ± 3.7 22.9 ± 4.8 15.9 ± 6.2
CNR.,, 22.3 ± 2.5 18.3 ± 3.6 29.7±9.1 CNR••od 19.6 ± 5.6 6.4 ± 1.6 7.1 ± 2.2
SNRbkgd 66.5 ± 16.7 40.7 ± 5.9 52.6 ± 7.9
LESION ENHANCEMENT 39
8
7 E3 T1W
6 ESl SPGR
5 ~ MPSPGR
4
3
2
1
% contrast CNR bkgd
Fig. 2. Percentage of contrast and CNR for extraaxial lesions
for the three pulse sequences. TlW indicates Tl-weighted.
sions was statistically comparable for spin-echo (79.1
±
14.0%) and SPGR T1-weighted (67.9±
19.1%) sequences. Both had significantly higher percentage of contrast than the MPSPGR (27 .3±
14.6%) sequence (P = .01). For spin-echo and SPGR images the CNRa1r was comparable and did not discriminate between the sequences. The spin-echo T1-weighted CNRbkgd was higher than the CNRbkgd of both SPGR and MPSPGR, but this just failed to reach statistical significance (P = .07). No lesions were missed by any sequence in this group.lntraaxial: All Lesions
The mean percentage of contrast for all in-traaxial lesions was statistically comparable on T1-weighted spin-echo (51.4
±
4.7%) and SPGR (48.5±
7.9%) sequences. Both had significantly higher mean percentage of contrast than the MPSPGR (24.5±
4.3%) sequence (P=
.001). The CNRbkgd was statistically higher with the T1 -weighted spin-echo sequence (24.5±
4.0) com-pared with either SPGR (10
±
1.7) or MPSPGR (13.3±
1.6) (P<
.05). The mean CNRair again was comparable for each technique.Intraaxial: Lesions with Edema
lntraaxial lesions were separated into those with and without surrounding edema, because this affected lesion detectability (Fig 3). For in-traaxial lesions with edema the mean percentage of contrast was comparable for spin-echo (61.8
±
7.9%) and SPGR (74±
12.5%) sequences.Both demonstrated significantly higher percent -age of contrast than the MPSPGR (33.2
±
5.4%) [image:3.612.318.558.76.194.2] [image:3.612.58.297.478.735.2]40 CHAPPELL
8
7 E3 T1W
6 ES:J SPGR
5 l:l1'l MPSPGR
4 3 2 1
% contrast CNR bkgd
Fig. 3. Percentage of contrast and CNR for intraaxial lesions
with edema for the three pulse sequences. Tl W indicates
Tl-weighted.
(14.4
±
2.2) (P < .002). The CNRair was compa-rable for each technique.lntraaxia/: Lesions without Edema
The detectability of intraaxial lesions without surrounding edema was significantly better with the T 1-weighted spin-echo sequence and dem-onstrated a statistically significantly greater per-centage of contrast (41.0
±
3.7%), than either gradient-echo sequence (SPGR: 22.9 ± 4.8% and MPSPGR: 15.9±
6.2%) (P < .05) (Figs 5, 6, 7, and 8). The CNRbkgd was also statistically higher for the T1-weighted spin-echo sequence (19.6±
5.6) than either SPGR (6.4±
1.6) or MPSPGR (7.1±
2.2) (P < .03). The CNRair was again comparable for each technique. Three small le-sions, of a total of 19 measuring 1 em or smaller, were not visualized on the SPGR images. One of these 19 was not visualized on the MPSPGR sequence. There were no lesions identified on either gradient-echo sequence that were not vis-ualized on the spin-echo T1-weighted images. In this group, two quantitative measures favored the T1-weighted spin-echo sequence.Effect of Echo Time on Spin Echo and Gradient
Echo
There was no significant change in the standard deviation of background signal or CNRbkgd in the comparison of spin-echo and gradient-echo
se-quences using echo-time values of 11 and 18.
Discussion
Conventional spin-echo T 1-weighted and
T2-weighted images have become standard clinical
pulse sequences in the diagnosis of disease of the central nervous system and the de facto standard
AJNR: 15, January 1994
of reference. These pulse sequences, however, have long scanning times and thus a number of faster, substitute pulse sequences have been de-veloped to produce images similar to spin-echo T1-weighted and T2-weighted images. A generic group of SPGR sequences have been developed to generate T 1-weighted-like images, with the advantages being a shorter clinical scanning time and 3-D Fourier transform feasibility ( 1, 2). Al-though these gradient-echo images have T1-weighting, the use of gradient echoes does
pro-duce image differences from spin-echo
T1-weighted sequences. Before a new pulse se-quence can be judged a substitute for the con-ventional spin-echo T1-weighted sequence, it should be compared prospectively.
In choosing to use such a newer sequence, several trade-offs need to be considered, and these trade-offs must be accurately defined. Some image degradation caused by magnetic susceptibility effects around bone and air was expected and present with gradient-echo se-quences (Fig 9). The disturbing finding in this study, however, was that the 3-D gradient-echo sequence failed to detect small contrast-enhanc-ing lesions seen on conventional spin-echo T1-weighted images. This occurrence was limited to small, moderately contrast-enhancing lesions (<1 em) in the brain parenchyma not associated with surrounding edema. This, therefore, would be a clinical problem in the detection of conditions such as metastatic disease, infection, demyelina-tion (multiple sclerosis), and possibly leptomen-ingeal disease. This diagnostic drawback was not encountered with larger intraaxial lesions, which typically have surrounding edema, or with
ex-traaxial lesions. In such lesions, morphologic
change in addition to contrast enhancement aided in the detection of the lesion. The lesions that cause no morphologic change and in which de-tection depends solely on contrast enhancement were the lesions that caused problems for the gradient-echo sequences tested.
The reason for the failure to detect small con-trast-enhancing lesions using gradient-echo T1-weighted sequences is not clear. This problem
was investigated by Rand (11) using theoretical
calculations; that study concluded that the re-duced-contrast enhancement was related to sat-uration effects (ie, the short repetition time of the 3-D SPGR). In our investigation, a long repe-tition time gradient-echo T1-weighted sequence
was included for that reason (MPSPGR) and,
[image:4.615.59.300.74.193.2]AJNR: 15, January 1994
A
% contrast
B
CNR bkgd
c
B T1W
~ SPGR
~ MPSPGR
Fig. 5. Percentage of contrast and CNR for intraaxial lesions
without edema for the three pulse sequences. Tl W indicates Tl-weighted.
SPGR, it did not detect one lesion, and the degree of contrast enhancement (percentage of contrast, CNRbkgd) was not superior to the SPGR sequence. The gradient-echo sequences consistently had lower CNRs than the spin-echo images. In com-paring CNRa;r and CNRbkgd, it became apparent
that background noise (ie, SD) was greater with gradient-echo sequences, and thermal noise (air) remained unchanged. This difference in the pulse sequences was detected only when background noise was used in the CNR calculation. This effect can make detection of lesions of similar intensity
to background difficult and appears to be one reason that lesion detectability was lower with
gradient-echo sequences.
A recent nonrandomized comparison study of
spin-echo Tl-weighted and one type of
gradient-echo Tl-weighted sequence did not find
differ-ences as described in this study (12). That study's
LESION ENHANCEMENT 41
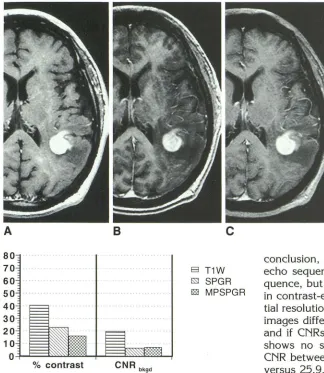
Fig. 4. Comparison of spin echo (800/
20) (A), 3-D SPGR (30/6) (B), and MPSPGR (247 /3.8) (C) sequences in detecting a con-trast-enhancing lesion representing central nervous system lymphoma in the parietal lobe. For large contrast-enhancing lesions with surrounding edema as in this patient, all three pulse sequences adequately de
-tected the lesion.
conclusion, however, was not that the gradient-echo sequence would replace the spin-gradient-echo
se-quence, but only that it would play a major role
in contrast-enhanced MR. In that study, the spa-tial resolution of the spin-echo and gradient-echo
images differed. If our lesion data are combined and if CNRs are calculated, then our study also shows no statistically significant differences in
CNR between spin-echo and SPGR images (28.4 versus 25.9, respectively). Our results, however,
indicate that thermal noise is not a good
discrim-inator between spin-echo and gradient-echo
se-quences because it is not sensitive to differences
in tissue noise. Separation of lesions by their
imaging characteristics was important in identi
-fying the small enhancing lesions without edema
as a subgroup that revealed the drawback of gradient-echo T1-weighted images. Another in
-vestigation of gradient-echo T1-weighted images
also revealed the potential for compromised le -sion detection, with two lesions not being seen
on the gradient-echo images (13).
Tl-weighted images are often judged visually
by the degree of gray-white matter contrast. Although this is important for evaluating mor-phology, it may not be the most important attrib-ute for detecting gadopentetate dimeglumine contrast enhancement. The 3-D SPGR image had the greatest gray-white differentiation, in part because of the relatively higher white matter signal intensity. Lesions on gradient-echo images
are of relatively lower signal intensity than white
[image:5.612.56.380.72.445.2]-42 CHAPPELL
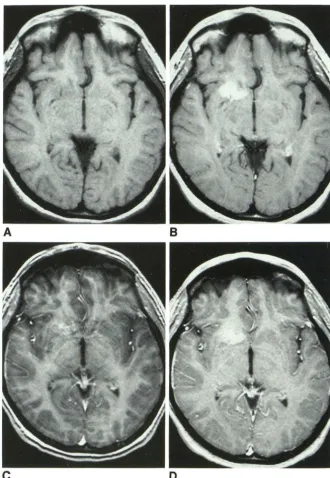
Fig. 6. Comparison of lesion detectabil-ity using spin-echo (800/20) (A and B), 3-D
SPGR (30/6) (C), and MPSPGR (247 /3.8)
(D) techniques for a relatively large contrast-enhancing vascular malformation, which does not have surrounding edema. The
pre-contrast spin-echo sequence shows a small
linear signal void indicative of a vessel in the interior of the vascular malformation. This was a typical venous angioma on angiogra-phy. Postcontrast Tl-weighted spin-echo scan (B) shows relatively uniform, intense
enhancement. The 3-D SPGR sequence (C)
exhibits much less contrast enhancement although the lesion is still detectable. The MPSPGR image (D) shows greater enhance
-ment than the SPGR sequence but less than the spin-echo sequence. Both gradient-echo
sequences have the characteristic high signal in cerebral vessels.
A
c
ages. This lower baseline signal, however, may make contrast enhancement more difficult to
detect in white matter. If small lesions are of
lower signal intensity than white matter on pre-contrast images and then increase in signal inten-sity up to a level equivalent to normal white
matter, contrast enhancement may be more
dif-ficult to detect. Unfortunately, our study design
did not include precontrast SPGR and MPSPGR scans. The phenomenon of contrast
enhance-ment bringing lesion signal intensity up closer to
a level of adjacent background does appear to
play a role in the difficulty of detecting contrast
AJNR: 15, January 1994
B
D
enhancement of lesions without associated edema.
The visual cues used to detect lesions differ for the type and location of central nervous system lesions. Lesions difficult to detect are small, cause no morphologic change, and exhibit only a small change in signal intensity (ie, contrast enhance-ment) in comparison with surrounding tissue. If these can be considered the most difficult diag-nostic problem for central nervous system
con-trast enhancement, then percentage of contrast
and CNRbkgd measurements provided good
[image:6.617.232.563.71.549.2]AJNR: 15, January 1994
A
8
c
A
8
c
Use of tissue noise (background standard devia-tion) as a measure of noise may be more appro-priate than the electronic noise (air) measurement
in comparing spin-echo and gradient-echo se-quences because there appears to be a differential effect on background.
LESION ENHANCEMENT 43
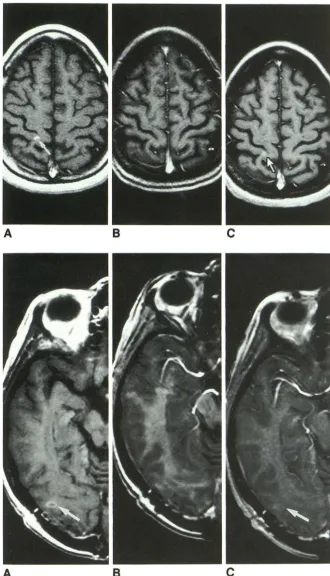
Fig. 7. In this patient with multiple scle
-rosis, the 3-D SPGR image (30/6) (B) did
not show the lesion that was well seen on
the spin-echo sequence image (800/20) (ar -row, A). This contrast-enhancing plaque did
not have surrounding edema. The MPSPGR
sequence (247 /3.8) (C) fell between these two images in that the contrast enhance
-ment was detectable (arrow, C) but less so
than in the spin-echo image (A). This rep-resented a lesion not detected by the 3-D
SPGR sequence. The section level between these sequences was virtually identical (note
the sulcal pattern). Note also the 3-D SPGR
image has the greatest gray-white differen-tiation.
Fig. 8. An example of a contrast-en
-hancing lesion, recurrent primitive neuroec-todermal tumor without surrounding edema,
not detected by the 3-D SPGR sequence (B).
A well-defined elliptical rim of contrast en
-hancement was identified on the spin-echo
image (800/20) (arrow, A). This lesion was not identified on the 3-D SPGR image (30/
6) (B). This recurrent tumor was only poorly visualized on the MPSPGR image (247 /3.8)
(arrow, C). Note the relatively high signal of white matter on the 3-D SPGR image, which resulted in good gray-white differentiation but poor visualization of enhancement.
[image:7.615.54.384.71.647.2]morpho-44 CHAPPELL
Fig. 9. Patient with metastatic Ewing
sarcoma to the left cavernous sinus. The
spin-echo image (800/20) (arrow, A) best demonstrated the enlarged cavernous sinus and its lateral border. Both gradient-echo
sequences, 3-D SPGR (30/6) (B) and
MPSPGR (247/3.8) (C), fail to show clearly the enlarged cavernous sinus or its lateral border. Presumably this is related to mag-netic susceptibility effects caused by
adja-cent air in this sphenoid sinus and bone in the skull base.
A
logic detail, which can be useful in evaluating
subtle mass effects, measuring gray and white matter volumes, or for evaluating cortical gray matter for suspected cortical dysplasia. For post-contrast scans they can be used for follow-up of extraaxial or intraaxial edematous lesions and they are advantageous for generating a 3-D data set that can be used for treatment planning (12).
References
I. Hendrick RE, Kneeland JB, Stark DD. Maximizing signal-to-noise and
contrast-to-noise ratios in flash imaging. Magn Reson Imaging 1987;5:117-127
2. Buxton RB, Edelman RR, Rosen BR, Wismer GL, Brady T J. Contrast
in rapid MR imaging: Tl-anf T2-weighted imaging. J Comput Assist Tomogr 1987;11:7-16
3. Haustein J, Laniado M, Neindorf HP, et al. Administration of gado-pentetate dimeglumine in MR imaging of intracranial tumors: dosage and field strength. AJNR: Am J Neuroradiol 1992; 13:1199-1206
4. Pelc NJ. Optimization of flip angle for Tl dependent contrast in MRI.
Magn Reson Med (in press)
5. Ernst RR, Anderson WA. Application of Fourier transform spectros
-copy to magnetic resonance. Rev Sci lnstrum 1966;37:93-1 02
AJNR: 15, January 1994
B
c
6. Fatouros PP, Marmarou A, Kraft KA, lnao S, Schwarz FP. In vivo brain water determination by Tl measurements: effect of total water content, hydration fraction, and field strength. Magn Reson Med 1989;17:402-413
7. Koenig SH, Brown RD, Spiller M, Lundbom N. Relaxometry of brain:
why white matter appears bright in MRI. Magn Reson Med 1990; 14:482-495
8. Fischer HW, Rinck PA, Van Haverbeke Y, Muller RN. Nuclear
relax-ation of human brain gray and white matter: analysis of field
depend-ence and implications for MRI. Magn Reson Med 1990; 16:317-334
9. Bracewell R. The Fourier transform and its applications. Vol 5. New
York: McGraw-Hill, 1965:6-57
10. Edelstein WA, Glover GH, Hardy CJ, Redington RW. The intrinsic
signal-to-noise ratio in NMR imaging. Magn Reson Med 1986;3:6
04-618
II. Rand SD, Maravilla KR, Schmied! U. Gadolinium DTPA enhancement in radiofrequency spoiled gradient-recalled echo imaging: theory,
experimental evaluation and clinical implications (abstr). In: Book of abstracts: Society of Magnetic Resonance in Medicine 1991. Berkeley,
Calif: Society of Magnetic Resonance in Medicine, 1991: 42
12. Mirowitz SA. Intracranial lesion enhancement with gadolinium:
Tl-weighted spin-echo versus three-dimensional Fourier transform
gra-dient-echo MR imaging. Radiology 1992; 185:529-534
13. Brant-Zawakski M, Gillan GD, Nitz WR. MP RAGE: a three-
dimen-sional, Tl-weighted, gradient-echo sequence: initial experience in the
[image:8.615.231.559.73.295.2]