In sharp contrast to most air-breathing vertebrates, gas flows through the major exchange area of the avian lung, the paleopulmonic parabronchi (Fig. 1), in the same direction during both inspiration and expiration (Schmidt-Nielsen et al. 1969; Bouverot and Dejours, 1971; Bretz and Schmidt-Nielsen, 1971, 1972; Scheid and Piiper, 1971). The absence of any structural organization, such as valve leaflets, capable of controlling airflow direction through the bird’s lung (Dotterweich, 1936; King, 1966; Duncker, 1971; Jones et al. 1981) has led to speculation that ‘aerodynamic valving’ is the controlling mechanism for the observed gas-flow patterns (Hazelhoff, 1943; Scheid et al. 1972; Brackenbury, 1971; Kuethe, 1988).
Butler et al. (1988), on theoretical grounds, suggested that the convective inertial force of the gas stream (ru2, strictly, the momentum flux density, where r is gas density and u is velocity) was the aerodynamic mechanism responsible for rectifying flow through the avian lung during inspiration and expiration. They proposed that the flow of gas through a side
branch of the bronchial tree was systematically less than that through the main tube because of the axially directed momentum of the gas stream in the main tube. Tests of this hypothesis involve establishing that valve effectiveness depends on ru2(Fig. 2). Wang et al. (1988), using models of the avian bronchial system, demonstrated that convective inertial forces could indeed explain the valving seen during inspiration in birds, i.e. no or limited flow in the ventrobronchi during inspiration (see Fig. 1). This hypothesis has been confirmed experimentally in intact birds (Banzett et al. 1987). Despite the progress in our understanding of the operation of the inspiratory valve, the mechanisms controlling expiratory valving have not been previously explored in living birds. Expiratory valving is defined here as the mechanism that acts to direct the gas exiting the caudal thoracic and abdominal air sacs to flow through the dorsobronchi and then the parabronchi with no or little flow through the intrapulmonary portion of the primary bronchus (see Fig. 1).
Printed in Great Britain © The Company of Biologists Limited 1995
The unidirectional gas-flow pattern through the avian lung is thought to result from ‘aerodynamic valves’; support for this hypothesis lies mainly in the failure to find any evidence for anatomical valves. During expiration, air flows from the caudal air sacs through the major exchange area of the lung, the paleopulmonic parabronchi, instead of bypassing the lungs via the intrapulmonary bronchus. We tested whether the effectiveness of this expiratory flow control mechanism depends on aerodynamic factors, especially convective inertial forces that depend on gas density and flow velocity. In pump-ventilated, anaesthetized geese, a bolus of tracer gas was introduced into both the right and left caudal thoracic air sacs during an end-inspiratory pause. During the first expiration, the rise of tracer levels within the caudal trachea was measured. Valve efficacy was positively correlated with the rate of expiratory gas flow, V·AO(range 8–200 ml s21). At
flows assumed to occur during exercise in geese
(V·AO>100 ml s21), the expiratory valve efficacy was
approximately 95 %; it was less effective at lower flows. Surprisingly, the density (r) of the background gas (rof He/O2=0.43 g l21, Ar/O2=1.72 g l21 or SF6/O2=5.50 g l21)
had no effect on expiratory valving. We suggest two possible mechanisms that might explain this unusual combination of flow dependence without density dependence. (1) If airway geometry changes occurred between experiments with different gases, flow in the vicinity of the expiratory valve may have varied independently from flow measured at the airway opening. (2) Alternatively, valving may depend on dynamic compression of the intrapulmonary bronchus, which could depend mainly on viscous resistance and thus on flow velocity but not gas density.
Key words: birds, respiration, airflow distribution, aerodynamic valving, avian lung, convective inertia, dynamic compression.
Summary
THE AVIAN LUNG: IS THERE AN AERODYNAMIC EXPIRATORY VALVE?
RICHARD E. BROWN*, CHRISTOPHER E. KOVACS, JAMES P. BUTLER, NING WANG, JOHN LEHR AND
ROBERT B. BANZETT†
Physiology Program, Harvard School of Public Health, Boston, MA 02115, USA
Accepted 20 July 1995
*Present address: Zoologiska Institutionen, Zoomorfologiska Avdelningen, Göteborg Universitet, Göteborg, Sweden. †Author for correspondence.
Physical and mathematical modelling of the inspiratory valve is relatively straightforward because the geometry of the bronchial features associated with the inspiratory valve is simple (Butler et al. 1988; Wang et al. 1992). Butler et al. (1988) recognized that the complex bronchial geometry associated with the expiratory valve prevented straightforward theoretical predictions but, nonetheless, suggested two mechanisms that might be operative in expiratory valving. (1) An alignment between the axis of the laterobronchus emptying the caudal thoracic air sac and the dorsobronchi would permit jet-flow of the gas stream to enter the dorsobronchi directly as well as entraining the flow exiting the abdominal air sac (Fig. 1). (2) Expiratory flow exiting the intraclavicular and cranial thoracic air sacs via the ventrobronchi must make a change in direction of more than 90 ˚ as it enters the primary bronchus. This change in direction would be accompanied by a pressure gradient directed caudally within the intrapulmonary bronchus that would act to block any cranial flow of gas through the intrapulmonary bronchus. Both of these mechanisms are consistent with the hypothesis that there is an interplay between the pressure gradient and the convective inertial forces that determines the ultimate flow partitioning, but the speculations of Butler et al. (1988) remained untested.
We therefore conducted a series of experiments to determine whether expiratory valve effectiveness scales with ru2 (the momentum flux density of the gas). We estimated valve failure by the appearance of a tracer gas in the trachea during the first expiration following injection of the tracer into the caudal thoracic air sacs. To examine the contribution of convective momentum to valve efficacy, we systematically varied both gas density and velocity in mechanically ventilated geese. The
results revealed that varying gas flow (V·AO) had a strong influence on expiratory valve efficacy but that changes in gas density had no systematic effect.
Materials and methods Experimental rationale
During expiration, gas from the caudal sacs can either travel via the gas-exchange area of the parabronchi or bypass the parabronchi via the intrapulmonary bronchus. We define expiratory valving efficacy as the fraction of gas exiting all the caudal air sacs that passes through the parabronchi. The expiratory valve is then 100 % effective if all the gas exiting the caudal thoracic and abdominal air sacs flows through the parabronchi (Figs 1, 3A). If all gas exiting the caudal air sacs bypasses the lung, efficacy is zero. In these experiments, we estimated valve efficacy as the fraction of caudal thoracic air sac gas that flowed through the bird’s parabronchial lung.
We mechanically ventilated geese at tidal volumes (VT) chosen such that VTwas less than the combined volumes of the parabronchi, dorsobronchi, ventrobronchi and laterobronchus (lung volume 26 cm3kg21; Maina, 1989) but much larger than the volume of the primary bronchus. During expiration, assuming 100 % valving, approximately half of the flow comes directly from the cranial group of air sacs via the ventrobronchi and half comes from the lung. Thus, using a tidal volume of 100 ml results in 50 ml of air coming from both lungs, less if valving is incomplete. We injected an inert tracer gas (N2) bilaterally into the caudal thoracic air sac (Fig. 3) early in a end-inspiratory pause and then measured the rise in concentration of tracer in the caudal portion of the trachea during the following expiration (Fig. 3). We reasoned that any
VentrobronchiIntrapulmonary bronchus
Cranial thoracic
Caudal thoracic sac Dorsobronchi
Abdominal sac Paleopulmonic
parabronchi
sac
Trachea
Syrinx
Primary bronchus
sac
SA
Intra-clavicular
[image:2.609.194.560.474.672.2]LB
Fig. 1. General anatomy of the avian respiratory tract, right side only. The several air sacs filling the bird’s coelom act as bellows to move gas through the lung. The unidirectional pattern of flow (arrows) through the major exchange area of the bird’s lung, the paleopulmonic parabronchi, has been determined from flow-measuring devices implanted in the dorsobronchi (bronchi mediodorsales). During expiration, there is no or little flow in the intrapulmonary portion of the primary bronchus (bronchus primarius, pars intrapulmonalis); instead, nearly all the gas exiting the caudal thoracic and abdominal air sacs passes through the parabronchi. The intrapulmonary bronchus is commonly referred to as the
tracer sampled in the first expiration had exited the caudal thoracic air sac and bypassed the lung via the intrapulmonary bronchus (Figs 1, 3).
Animals
Nine domestic geese (Anser anser) of both sexes, purchased from commercial sources, were used in these experiments (mass range 3.25–3.75 kg). These experiments were approved by the Harvard Medical Area Standing Committee on Animal Use.
Animal preparation
The experimental arrangement is shown in Fig. 3. Unfasted birds were sedated with sodium pentobarbital (25 mg kg21) via deep muscular injection. The subcutaneous tissues over the distal brachium were infiltrated with 1 % lidocaine and the ulnar vein was cannulated (PE 50) for continuous infusion of physiological saline, intermittent doses of sodium pentobarbital as needed to maintain light surgical anaesthesia, and atropine (1 mg h21). A cuffed endotracheal tube (6.5 mm) or thin-walled brass cannula of maximum allowable diameter was tightly sealed (ostomy cement, Turbot Co., USA) into the tracheal lumen in the mid-cervical region. The third most caudal rib was identified through a skin incision immediately cranial to the thigh. Flanged (2 cm) polypropylene (4 mm i.d.) tubes were inserted into both caudal thoracic air sacs through the intercostal musculature immediately cranial to the identified rib and about 3 cm dorsal to the articulation between the vertebral and costal components of the rib. The tubes were sealed to the body wall with sutures and cyanoacrylate glue (Superglue, Loctite Corp.). The skin and subcutaneous tissues surrounding the air sac catheters were sutured and sealed with cyanoacrylate glue to prevent leakage of air into or out of the air sacs.
The physiological status of the bird was continuously
monitored during the experiment via end-expiratory CO2level (LB-2, Beckman Instruments; or Datex Cardiocap, model CG-265), reflexes (pedal, corneal) and deep body temperature using a thermistor (Yellow Springs Instruments, model 45TA) inserted into the rectum through the cloaca. The position of all catheters was confirmed by necropsy following the experiment, when the bird was killed with sodium pentobarbital.
Following surgical preparation, the bird was supported
Valve failure
0 Ar
He
Min Max
[image:3.609.85.265.71.170.2]Max Flow velocity
Fig. 2. Predicted theoretical relationships between valve failure, flow velocity and gas density; arbitrary units. If the mechanism responsible for expiratory valving in the bird is produced through the forces of convective inertia, i.e. ru2, we expect that changes in either gas
density (r) or velocity (u) will have an effect upon valve efficacy. There may be high- (e.g. exercise) or low- (e.g. rest) flow regimes in which valve efficacy is unaffected by changes in gas density. Across a mid-range of flow velocities, valve efficacy should scale with ru2.
Within these mid-range values of velocity, a low-density gas (He,
r=0.18 g l21) will show a larger degree of valve failure for a given
flow velocity than a high-density gas (Ar, r=1.79 g l21).
N 2
AAS
CATAS
CRTAS Parabronchi
ICAS IPB
PB A
AAS
CATAS
CRTAS Parabronchi
ICAS IPB
PB N
sample
2
B Bias in
DT
Pump F
N tracer injection
2
N tracer injection
2 PAO sample
Vacuum
2 2
CO samples
O
Fig. 3. Anatomy of the avian respiratory system showing the experimental arrangement and assumptions, for further details see test. Large arrow denotes unidirectional gas flow through the paleopulmonic parabronchi; small arrows denote the reduction in volume of the several air sacs during expiration. The tracer gas was injected bilaterally into the caudal thoracic air sacs (CATAS) and measured in the caudal end of the trachea. CRTAS, cranial thoracic air sac; ICAS, intraclavicular air sac; AAS, abdominal air sac; IPB, intrapulmonary bronchus; PB, primary bronchus; DT, displacement transducer of pump ventilator; F, pneumotachometer. (A) Predicted pattern for a highly effective expiratory valve. Little to no tracer (N2)
will be detected in the caudal trachea during the expiration immediately following the tracer-injection as the gas being sampled was resident in the ventrobronchi, parabronchi, primary bronchus (cranial to the ventrobronchi) and cranial air sacs (intraclavicular and cranial thoracic) during the end-inspiratory pause when tracer was added to the caudal thoracic air sac. (B) Predicted pattern for an ineffective expiratory valve. In this case, the gas exiting the caudal sacs will be equally divided between flow through the parabronchi and flow through the intrapulmonary bronchus; thus, the concentration of tracer (N2) of the gas sampled in the caudal trachea
[image:3.609.326.558.81.335.2]throughout the experiment in sternal recumbency in a cloth sling with holes through which its legs hung free. The sling provided even support across the ventral thorax from the cranial to caudal extremes of the sternum, a condition which mimics the weight of the bird suspended upon its pectoral muscles during flight (Zimmer, 1935).
Mechanical ventilation
A piston pump driven by a linear magnetic motor was attached to the end of the tracheal cannula and the bird was artificially ventilated throughout the experiment. Tidal volume (VT) was controlled by the magnitude (cm) of piston travel, and the rate of piston travel (cm s21) was used to control flow rate at the airway opening (V·AO). A high-impedance bias flow (4.5–9 l min21) of gas mixtures of known composition (see below) was supplied at the airway opening and an equal flow was removed from the manifold at the airway opening via a high-impedance vacuum source (Fig. 3). Tidal volume was held constant throughout each experiment and flow rates were adjusted by changing the time of expiratory and inspiratory flow,
i.e. rate of piston travel (see Fig. 5). Inspiratory and expiratory pause times could also be adjusted. Airway opening pressure (PAO), referenced to atmospheric pressure (Validyne MP45), and flow (Fleisch pneumotachometer and Validyne MP45) were continuously monitored and recorded. To prevent N2 contamination from room air of the gas volume within the bird, PAO was maintained at >0 cmH2O (1 cmH2O=98.1 Pa) at all times (see Fig. 5). As expected, PAO fluctuated during each pump-controlled breath; however, mean airway pressure during experimental breaths was held constant for each bird at 5–12 cmH2O (0.5–1.2 kPa). The amplitude of the pressure swing varied with V·AO. For each trial, the bias flow of the gas through the manifold at the airway opening was adjusted (using gas source or vacuum, or both) to maintain a condition of zero net flow through the pneumotachometer during the pause periods.
During the trials, the birds were ventilated with commercially prepared mixtures of 20 % O2with a balance of He, Ar or SF6. The He/O2 and Ar/O2 mixtures were commercially prepared. The gases SF6and O2were mixed just prior to entering the manifold at the airway opening (oxygen blender, model 960, Siemens Medical Systems). The density (r) of these gas mixtures is as follows: He/O20.43 g l21; Ar/O2 1.72 g l21; and SF6/O25.50 g l21. The oxygen concentration of this mixture was continuously monitored within the manifold (Datex Cardiocap). 30 min of pump ventilation on a new gas mixture prior to any tracer injections was considered adequate for complete wash-in of that gas to occur.
[image:4.609.83.242.323.602.2]Except during the tracer injections and the following expiration (see below), we ventilated the birds so as to maintain an end-tidal PCO∑of approximately 40 mmHg (5.3 kPa), which rendered the
Fig. 4. Recording of dilution and washout of N2following injection
of room air into one caudal thoracic air sac, see text for details. The pump ventilator (bottom graph) was stopped with bias flow of gas adjusted to maintain a constant PAO (middle graph; 1 cmH2O=98.1 Pa) and thus no flow at the mouth. The N2
concentration (top graph) in the caudal thoracic air sac immediately following injection (adjusted for delay plus rise time of the Nitrolyzer) into the air sac directly adjacent to the sampling catheter represents the 80 % N2content of the injected room air. As the nitrogen injection
equilibrates with the sac gas, %N2falls. After an approximately 2 min
pause, the ventilator was restarted and the washout of N2per breath
was determined.
Fig. 5. Data recordings from two geese. The N2recording has been
shifted by the measured delay plus rise time of the Nitralyzer to coordinate the timing of the nitrogen signal with that of the other data recordings. The broken lines indicate the timing of tracer (N2)
injection. Flow (V·AO) is measured at the tracheal cannula. (A) Good expiratory valving and poor valving (B) in one goose (SK) while ventilated on 80 % He, 20 % O2. (C) Good expiratory valving and poor
valving (D) in a second bird (DL) while ventilated on 80 % Ar, 20 % O2. VT, tidal volume; pressure is measured at the airway opening (1 cmH2O=98.1 Pa); N2(%) is measured in the caudal trachea; Insp,
inspiration; Exp, expiration. 0
10 20
Nitrogen (%)
0 10 20
0 5 10
Motor (mm)
0 25 50 75 100
Time (s)
Pressure (cmH
2
O)
−100
−50
0 50
5 s
−100
0 100
5 15 0 100 0 3
A
D C
B
0 2
0 150
5 25 Insp
Exp Flow (ml
s
−
1)
N2
(%)
V
T
(ml)
Pressure (cmH
2
[image:4.609.312.559.458.614.2]birds apnoeic for periods of greater than 10 s when mechanical ventilation was stopped. CO2 and O2 sampling within the manifold at the airway opening was momentarily discontinued during the tracer injection and measurement periods.
Experimental procedures
We sampled N2levels (Med Science, model 505 Nitralyzer) within the caudal 5 cm of the trachea immediately cranial to the syrinx (Fig. 3). To measure accurately the low concentrations of N2within the background gases used in these experiments, we adjusted the Nitralyzer’s sample chamber pressure for stable, maximum strength signals while sampling low concentrations of N2in the selected background gas (see Banzett et al. 1987). Sample catheter (PE 60) flow rates (0.05–0.07 ml s21) were small relative to the lowest expiratory flow rates (8 ml s21) during these experiments. We calibrated the instrument and repeatedly rechecked calibrations throughout the experiment using gases of known N2content (0 % and 2 %) in the case of Ar/O2and He/O2mixtures and with serial dilutions (into a Douglas bag) of the SF6/O2mixture using room air (80 % N2) prepared immediately prior to experimental measurements. The Nitralyzer responded to a step change in N2 levels at the distal end of the sampling catheter with a 1.5–11 s delay that depended upon the rate of flow through the sample chamber and sample catheter length. Sample catheter length and flow rate were kept constant throughout an experiment and the delay was repeatedly checked. The time constant of the roughly exponential response of the Nitralyzer was about 300 ms.
To introduce the N2 tracer, we injected 20 ml of air simultaneously into both caudal thoracic air sacs (10 ml per sac) (Fig. 3). Injection time was marked by a pressure transducer connected to the tracer injection manifold. The tracer was injected at the beginning of an end-inspiratory pause of 6 s to allow for equilibration of tracer and air sac gas. We allowed a minimum of 5 min between successive injections of tracer.
Several criteria were used as a basis for rejecting a trial: (1) spontaneous respiratory efforts by the bird indicated by fluctuations in PAOunrelated to pump movement; (2) non-zero net flow (imbalance of bias flows) measured by the pneumotachometer during the pause periods before or following a tracer injection; and (3) any change in the Nitralyzer calibration found during a subsequent determination.
The volume (from the dilution of the known volume of tracer) and ventilation rate (from the tracer wash-out curve) of the caudal thoracic air sacs were determined in three birds (Fig. 4). This information allowed us to estimate the percentage of the gas exiting the caudal thoracic air sac that had bypassed the lung via the intrapulmonary bronchus. 10 ml of air was injected into one caudal thoracic air sac while we continuously monitored N2 concentration via a catheter inserted through the lumen of the injection tube. Caudal thoracic air sac volume in ml (VCAUD) is: VCAUD= (CINJ3VINJ)/CCAUD, (1) where CINJis the concentration (%) of N2injected, VINJis the volume (ml) of the injection and CCAUD is the N2
concentration (%) in the caudal thoracic air sac. When we sampled for 2 min, N2concentration continued to fall steadily, presumably because of diffusion out of the sac. We therefore estimated CCAUD by extrapolating the slope between 40 and 70 s post-injection back to the time of the injection. VTof the caudal thoracic air sac (VTCAUD) (in ml) is:
VTCAUD=D%N23VCAUD, (2) where D%N2is the change in N2concentration per breath. The slope of %N2following the reinitiation of pump ventilation (first five breaths only) was used to determine the D%N2per breath. The mean contribution of the two (left and right) caudal thoracic air sacs to VTwas 26 % (range 22–30 %), a roughly similar value to that reported by Scheid et al. (1974), i.e. 40 %. Any increase in N2concentration that appears in the trachea on the first breath is the result of valve failure and can be used to estimate valving efficacy, as follows. First, because gas exiting the caudal sac must pass through either the parabronchi or the intrapulmonary bronchus:
VTCAUD2VTCAUD,LEAK
Valve efficacy (%) = ––––––––––––––––––––3100 , (3) VTCAUD
where VTCAUD,LEAKis the volume of gas exiting the caudal thoracic air sac that bypasses the parabronchi via the intrapulmonary bronchus (in ml). Second, because N2tracer appearing in the trachea on the first expiration comes only from caudal thoracic air sac gas bypassing the lung; and is diluted by gas from all sources:
D%N2= (VTCAUD,LEAK3CCAUD)/VT. (4) Combining the above equations:
D%N23VT
Valve efficacy = 12–––––––––––––––. (5) CCAUD3VTCAUD
The highest commonly measured value of D%N2, 1.0 %, represents 50 % efficacy; only when we were unable to maintain a bird’s normal PCO∑ were higher values of D%N2
measured. The lowest value commonly seen measured in the present experiments, 0.015 %, represents 95 % efficacy.
Data collection
All signals were continuously monitored and digitally stored (Superscope 2, G.W. Instruments, Somerville, Massachusetts, and Apple Macintosh IIc). Measured Nitralyzer delay times were subtracted from the %N2data records to coordinate inputs of all instruments. Regressions were calculated and plotted using Excel.
Results
expiratory valve effectiveness. We define D%N2as the peak %N2 measured in the caudal-most trachea during the expiratory pause immediately following the tracer injection minus the peak %N2of the expiratory pause immediately prior to the injection (Fig. 5). Expired %N2 waveforms varied among birds (Fig. 5); we attribute this variation to the existence of multiple pathways of different lengths for the gas expired from the caudal thoracic air sac to reach the intrapulmonary bronchus (e.g. the laterobronchi and neopulmonic parabronchi; see Dunker, 1971).
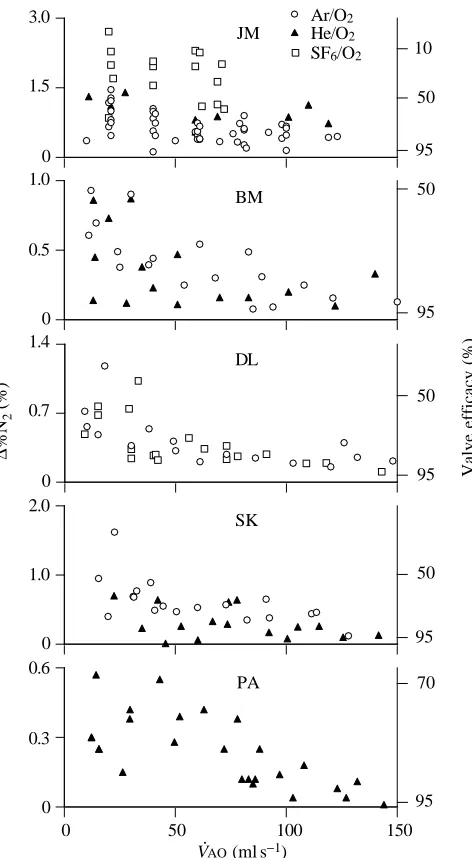
Fig. 6 shows data from five birds. Expiratory valve failure, D%N2 is strongly negatively correlated (P<0.05) with flow measured at the airway opening (V·AO) in all geese. We combined all trials on all gas mixtures for each individual bird in the analysis as it was determined there was no apparent effect of gas density (mixture) on expiratory valving (see below). At flows in excess of 100 ml s21, valving efficacy reached a relatively constant value (about 95 %) that we term ‘maximal effectiveness’. At flows less than 100 ml s21valving efficacy progressively declined to about 50 %.
Surprisingly, changes in gas mixture, and density, had no systematic effect on expiratory valving effectiveness (Fig. 6). If convective momentum is an important factor in expiratory valving, data gathered during variations of flow and density should fall on the same line when D%N2 (estimate of valve efficacy) is plotted against ru2. Because we did not measure flow velocity from the bronchi in the vicinity of the expiratory valve, we used values of V·AO(volume flow at the trachea) as a proxy for u (Fig. 7). When D%N2 was plotted against r(V·AO)2a clear difference between gas mixtures was evident at flows ø100 ml s21 (Fig. 7), and thus, the expected relationship did not occur.
During ventilation with 80 % SF6, 20 % O2 in one bird (individual JM), we encountered expiratory flow limitation at 75 ml s21. As a consequence, we were unable to maintain PCO∑
below 50 mmHg (6.67 kPa; see Fig. 6). We note that under this condition and at low flows, less than 20 % of the gas exiting the caudal thoracic air sac was passed through the lung. During ventilation with He/O2 or Ar/O2 mixtures, where the flow limitation occurred at a higher flow and a normal PCO∑could
be maintained, the relationship between flow rate and valving efficacy was qualitatively the same in individual JM as in the other birds (Fig. 6).
Critique of methods
These experiments produced apparently paradoxical results: a dependence of valve efficacy on gas velocity but not on gas density as predicted by a mechanism responsive to ru2. Can these results be explained by methodological limitations? The range of gas densities used, r=0.43–5.50 g l21, should have been adequate to produce measurable changes in valving. The experiments were often continued for 24 h; yet, during these rather lengthy periods, we found no consistent trend of valving performance with time. Variations in the order of use of the different gas mixtures eliminated any time-dependent factors.
0 1.5 3.0
He/O2 SF6/O2 Ar/O2
0 0.5 1.0
0 0.7 1.4
∆
%N
2
(%)
BM JM
0 1.0 2.0
DL
SK
0 0.3 0.6
0 50 100 150
PA
V(— 1)movet()46 movet-11 -13 54 AOoofontet25 QDShowfontmesQDShowcmykcol/Tietmescmykcol/Tiont sef) setmlset sont 8 -Roman ef-Roman 1 scal1 0 s0 or0 scal ( 8 ontndforndf0 0 ont 11 0 fifi .
95
95
95
95 95
50 50
50 50
70
Valve efficiency (%)
[image:6.609.318.554.69.498.2]10
Fig. 6. Effects of changes in gas density and flow rate on D%N2
measured in the caudal trachea. The magnitude of D%N2was used to
estimate valve failure. The gas mixtures used were 20 % oxygen and 80 % Ar, He or SF6. Expiratory valve efficacy (for calculation, see
equations in text) was correlated with changes in gas flow rate V·AO, i.e. reductions in flow resulted in increases in the percentage of the gas exiting the caudal thoracic air sac that bypassed the lung via the intrapulmonary bronchus. Although we examined flows (V·AO) up to 200 ml s21, for clarity we have included here only those values of flow ø150 ml s21. Above V·AOof 100 ml s21, the valving efficacy remained
at a maximum value. Changes in gas density (rof He/O2=0.43 g l21,
Ar/O2=1.72 g l21 or SF6/O2=5.50 g l21) had no apparent effect on
expiratory valve efficacy. Each panel represents results from a different individual. Goose JM experienced a >10 mmHg (1.33 kPa) increase in end-expiratory PCO∑while ventilated with 80 % SF6, 20 %
O2, owing to a flow limitation that prevented adequate minute
ventilation. The poor valving seen in this individual while on SF6/O2
may therefore have resulted from a physiological response to elevated levels of CO2. These unexpected results indicate that less than 20 %
of expiratory flow passed through the parabronchi in goose JM while being ventilated with SF6/O2.
V·AO(ml s−1)
We are also unaware of any equipment limitations that would have led to our paradoxical results.
Are the estimates of efficacy accurate? During expiration, gas is expelled from both caudal thoracic and abdominal air sacs into the terminal portion of the intrapulmonary bronchus. The experimental technique of placing tracer gas in only the caudal thoracic air sac is therefore likely to underestimate expiratory valve efficacy. It is highly unlikely that gas exiting the abdominal air sac could detour the parabronchi via the intrapulmonary bronchus without entraining the flow of the gas exiting the caudal thoracic air sac (Fig. 1). Thus, we suggest that the percentage of the volume of gas exiting the abdominal sac that bypasses the lung will always be less than or equal to that of the gas exiting the caudal thoracic air sac.
Discussion
Efficacy of the expiratory valve
These experiments demonstrate that birds have an expiratory valving mechanism that is around 95 % effective at flows greater than 100 ml s21(Fig. 6). Such flows are less than those that the goose would encounter in flight (Berger et al. 1970). Powell et al. (1981) reported that, in ducks at rest, approximately 12 % of the caudal sac gas bypassed the lung during expiration. Piiper et al. (1970) reported a bypass of approximately 24 % in chickens and Bouverot and Dejours (1971) reported a 10 % bypass. These previous studies examined spontaneously breathing, anaesthetized birds. The results reported here also suggest that expiratory valving would be less than 95 % effective at the flows encountered during spontaneous breathing in anaesthetized birds, i.e. commonly less than 50 ml s21(Fig. 6). Thus, there appears to be close agreement between previous studies and the results of this study at low flows; the present study also extends these
observations, showing that valving becomes more effective at higher, more physiological flows. A common expiratory pattern in awake, resting birds, however, is two or more bursts of flow interspersed with periods of no flow (R. E. Brown, unpublished observations). Such a pattern may maintain effective expiratory valving even when expiratory duration is long.
Hypothesized mechanisms
The results reported here show a dependence of valve efficacy on gas flow rate (V·AO) but at the same time show no effect of changes of gas mixture and density on valve efficacy (Figs 6, 7). Earlier experiments have indicated that valve efficacy depends on flow rate (Brackenbury, 1979; Hastings and Powell, 1986). Because valving was hypothesized to be governed by convective inertia, we predicted that expiratory valve efficacy would depend on both gas density and velocity and be a function of ru2(Fig. 2). Our data are not consistent with this hypothesis (Fig. 6). Moreover, a fixed resistive mechanism, such as that suggested by Zeuthen (1942), would not be responsive to variations in flow rate and our data are also not consistent with this hypothesis. We propose two possible explanations for the present results, both of which invoke changes in airway calibre: (1) steady changes in bronchial diameter mediated by smooth muscle; (2) cyclic changes in bronchial diameter mediated by dynamic compression during expiration.
Steady changes in bronchial diameter mediated by smooth muscle
We do not know where the crucial point is, if normal function of the expiratory valve does indeed depend on ru2, to measure the relevant velocity. We have therefore used V·AOas an estimate of velocity, assuming that velocity is directly proportional to
r()
4 Θ∆Σηοω0 0 0 1 σετχµψκχολορ11 φινδφοντ αλιχ /Τιµεσ−Ιτ σχαλεφοντ σετφοντ 13 −16 µοϖετο (ς) 6 Θ∆Σηοω0 0 0 1 σετχµψκχολορ(ΑΟ) 11 µοϖετο−18 σχαλεφοντ /Τιµεσ−Ροµαν 19 8 φινδφοντ σετφοντ Θ∆Σηοω0 0 0 1
σετχµψκχολορ()µοϖετο−16 /Τιµεσ−Ροµαν σχαλεφοντ 30 11 φινδφοντ σετφοντ movet()-16 71 QDShow4 omes-movetcmykcolfont67 -13 (2)/Tiset1 set0 QDShowRoman 4 ontef0 oor0 mes-cmykcolfontscal) 11 /Tindfsetmovetontset1 (--13 Roman 63 0 ontfief0 orscal0 8 ondfontfontfisetQDShow24 ontefs)cmykcolscal/Symbol28 ndfsetont1 l 0 fi0 0 or(g σετχµψκχολορ()µοϖετο1 −16 Θ∆Σηοω30 σχαλεφοντ 0 /Τιµεσ−Ροµαν σετχµψκχολορ11 11 (ΑΟ) 0 µοϖετοφινδφοντ −18 σετφοντ1 0 σχαλεφοντ Θ∆Σηοω0 19 /Τιµεσ−Ροµαν 8 0 φινδφοντ σετφοντ0 6 (ς)µοϖετο−16 13 σχαλεφοντ σετχµψκχολορ11 1 φινδφοντ σετφονταλιχ Θ∆Σηοω/Τιµεσ−Ιτ0 r0 4 movet()0 -16 71 QDShow4 () ocmykcolmes-movet-13 67 (2)/Tifontset1 QDShowRoman set0 4 ef0 onto0 or) cmykcolfont11 scalmes-ndf/Tisetmovetsetont1 (--13 63 Roman 0 ontfi0 efor0 scalo8 ndfontfontfiset24 QDShowontefs)scalcmykcol/Symbol8 2ndfset1 ont0 l fi0 or0 (g 0
0.7
1.4 DL
0 1.5 3.0
∆
%N
2
(%)
JM
He/O2 SF6/O2 Ar/O2
0 1.0 2.0
0 50 100 150
SK
0 0.5 1.0
∆
%N
2
(%)
0 50 100 150
BM
[image:7.609.252.562.74.325.2]. .
Fig. 7. Data shown in Fig. 6 replotted for four birds as D%N2versusr(V·AO)2. If the expiratory valve was
indeed controlled by convective inertial forces, replotting the valve failure estimate, D%N2, against ru2should eliminate any differences in the effects of
gas density (rin g l21) on valve failure. Here we have
used V·AO (l s21) as a proxy for u (velocity).
Regression lines are given for valve failure estimates derived at flow rates of 0–100 ml s21for each gas
mixture. All birds showed maximum valving, independent of gas mixture, above flows of
100 ml s21(see Fig. 6). r(V
·
flow; this will only be true if bronchial diameter is constant. It is possible that the geometry (diameter) or cross-sectional area of the bronchi in the vicinity of the expiratory valve (dorsobronchi, caudal intrapulmonary bronchi) changed between experiments with different gas mixtures and densities. It is also possible, but unlikely, that the various inert gases used (Ar, He, SF6) could have tissue-specific effects, such as smooth muscle activation or stimulation of chemoreceptors with secondary activation of smooth muscle, resulting in a change of airway calibre. Alternatively, the airway diameter may have changed in response to local changes in PCO∑or PO∑consequent
to altered distribution of ventilation with changes in gas density. Control of airway calibre by CO2 has been described in the bronchi forming the inspiratory valve. A narrowed segment along the primary bronchus immediately cranial to the ventrobronchial openings, the segmentum accelerans (Fig. 1), convectively accelerates the inspired gas and thus enhances the efficacy of the inspiratory valve (Banzett et al. 1991; Wang et al. 1992). A coat of smooth muscle within the wall of the segmentum accelerans appears to modify bronchial diameter in response to changes in CO2levels (Wang et al. 1992). Thus, gas velocity in the vicinity of the inspiratory valve can be controlled independently from V·AO.
Small changes in PCO∑occurred during each trial (results not
shown), the magnitude of which was related to the number of trial breaths (one to five and their lengthened pause periods) required to stabilize the bias flow for zero net flow during the pauses. Some of the variability in valving performance using a single gas mixture may have resulted from fluctuations of PCO∑
or PO∑; however, there were no systematic changes in
end-expiratory PCO∑and PO∑ with the different gas mixtures.
End-expiratory PCO∑and PO∑may not be an adequate measure in the
bird: expired gas in birds comprises a variable mixture of gas from the parabronchi, gas exiting the cranial group of air sacs and any gas from the caudal group of air sacs that bypasses the parabronchi via the intrapulmonary bronchus. Further, because the cross-current gas exchange mechanism is sensitive to the flow velocity through the parabronchi, changes in arterial PCO∑may
not be reflected in end-expiratory PCO∑(Scheid and Piiper, 1970).
Changes in flow pattern caused by changes in gas density might, therefore, effect changes in airway calibre through changes in arterial blood gas levels or local pulmonary PCO∑undetected in
end-expiratory measurements. Between-trials ventilation was always (except for individual JM while ventilated with SF6/O2) performed at V·AO>125 ml s21 (above the minimum flow necessary for maximum valving). Thus, while it is reasonable to assume that overall flow patterns throughout the respiratory system remained constant except during low-velocity trial breaths, more subtle changes may have been undetected. Cyclic changes in bronchial diameter mediated by dynamic compression
The experiments reported here show that at the lowest flow regimes there is an approximately equal distribution of flow, i.e. approximately half of the caudal air-sac gas bypasses the parabronchi (Fig. 6), consistent with the approximately equal
resistive flow fractionation predicted by Zeuthen (1942). Yet no simple fixed resistive mechanism would yield a flow fractionation dependent upon on flow velocity (Figs 5, 6). This in turn implies that some variation in bronchial geometry is necessary to account for our findings. Below we consider the plausibility of the hypothesis that narrowing of the intrapulmonary bronchus during expiration caused by transmural pressures differences might effect valving. Changes in the calibre of the intrapulmonary bronchus during spontaneous breathing were observed visually a century ago by Soum (1896).
When the pressure surrounding a conducting bronchus (peribronchial pressure) is equal to the upstream driving pressure, resistive pressure losses produce negative transmural pressures that tend to narrow the tube, a phenomenon known as ‘dynamic compression’ (Wilson et al. 1986). This situation exists in the bird during expiration: the membranous medial wall of the intrapulmonary bronchus is exposed to air sac pressure over half of its diameter (Duncker, 1971). The difference in pressure between the air sacs and the bronchial lumen will tend to collapse the bronchus, and this pressure difference will increase as flow is increased. Depending on the magnitude of the pressure difference and the compliance of the bronchus, this could provide a mechanism for expiratory valving; because resistance in the intrapulmonary bronchus is thought to be dominated by viscous loss. The efficacy of such a ‘dynamic compression valve’ would depend on flow, but not on gas density (composition).
Morphometric measurements from Zeuthen (1942) and our own observations at low expiratory flows suggest roughly equal partitioning of flow between the intrapulmonary bronchus (IPB) and lung. This implies an equal resistance to flow via the two pathways. The 95 % valve efficacy we observed at high flow could result from an IPB:lung resistance distribution of 19:1. Because, during laminar flow, IPB resistance (RIPB) varies as the inverse fourth power of the diameter (d), it follows that:
dIPB,high flow4 1 –––––––––––– = –––– ,
dIPB,low flow4 19 or
dhigh flow 1 –––––––––– ≈–– .
dlow flow 2
The high valving efficacy observed at high flows could thus be achieved by halving the diameter of the intrapulmonary bronchus. The pressure drop from caudal thoracic air sac to cranial intrapulmonary bronchus has been determined to be 0.05 cmH2O (4.9 kPa) during artificial ventilation at low (42 ml s21) expiratory flow velocities (Banzett et al. 1991). Although the in situ compliance of the intrapulmonary bronchus is unknown, its membranous wall suggests that dynamic compression is possible.
reversed, would have a relatively large diameter, thus reducing the downstream pressure loss and promoting an adequate channel for the inspiratory flow profiles.
Birds, although they have no anatomical valves in their respiratory system, have a highly effective expiratory valve that assists in maintaining the unidirectional flow of air through their lungs; the efficacy of this valve is sensitive to flow velocity but not to gas density.
In conclusion, the mechanism responsible for producing expiratory valving in the avian lung is unclear. We consider two possibilities that might explain our findings, both of which rely on changes in airway caliber. (1) Expiratory valving may be a mechanism governed by convective inertia. In these experiments, the effect of gas density on valving may have been masked by changes in airway caliber secondary to changes in gas composition and local or central variations in PCO∑ or PO∑. If such changes occur, V·AO will not accurately reflect local velocity within the expiratory valve. (2) Dynamic compression of the intrapulmonary bronchus during expiration could produce an expiratory valve sensitive to flow velocity but not directly to gas density.
We thank Dr Roger Fedde, Department of Anatomy and Physiology, Kansas State University, and Dr Jeff Fredberg, Harvard School of Public Health, for discussions and review of this manuscript.
References
BANZETT, R. B., BUTLER, J. P., NATIONS, C. S., BARNAS, G. M., LEHR,
J. L. AND JONES, J. (1987). Inspiratory aerodynamic valving in
goose lungs depends on gas density and velocity. Respir. Physiol.
70, 287–300.
BANZETT, R. B., NATIONS, C. S., WANG, N., FREDBERG, J. J. AND
BUTLER, J. P. (1991). Pressure profiles show features essential to
aerodynamic valving in geese. Respir. Physiol. 84, 295–309. BERGER, M., HART, J. S. ANDROY, O. Z. (1970). Respiration, oxygen
consumption and heart rate in some birds during rest and flight. Z. vergl. Physiol. 66, 210–214.
BOUVEROT, P. ANDDEJOURS, P. (1971). Pathway of respired gas in the air-sac compartment of fowl and ducks. Respir. Physiol. 13, 330–342.
BRACKENBURY, J. H. (1971). Airflow dynamics in the avian lung as determined by direct and indirect methods. Respir. Physiol. 13, 319–329.
BRACKENBURY, J. (1979). Corrections to the Hazelhoff model of airflow in the avian lung. Respir. Physiol. 36, 143–154.
BRETZ, W. L. ANDSCHMIDT-NIELSEN, K. (1971). Bird respiration: flow patterns in the duck lung. J. exp. Biol. 54, 103–118.
BRETZ, W. L. ANDSCHMIDT-NIELSEN, K. (1972). The movement of gas in the respiratory system of the duck. J. exp. Biol. 56, 57–65. BUTLER, J. P., BANZETT, R. B. ANDFREDBERG, J. J. (1988). Inspiratory
valving in avian bronchi: aerodynamic considerations. Respir. Physiol. 72, 241–256.
DOTTERWEICH, H. (1936). Die Atmung der Vogel. J. vergl. Physiol.
23, 744–770.
DUNCKER, H. R. (1971). The lung air sac system of birds. A
contribution to the functional anatomy of respiratory apparatus. Adv. Anat. Embryol. Cell Biol. 45, 1–171.
HASTINGS, R. H. AND POWELL, F. L. (1986). Single breath CO2
measurements of deadspace in ducks. Respir. Physiol. 63, 139–149. HAZELHOFF, E. H. (1943). Bouw en functie van de vogellong. Versl. Gewone Vergad. Afd. Natuuk. Kon. Ned. Akad. Wet. 52, 391–400. English translation: Structure and function of the lungs of birds. Poultry Sci. 30, 3–10.
JONES, J. H., EFFMANN, E. L. AND SCHMIDT-NIELSEN, K. (1981).
Control of air flow in bird lungs: radiographic studies. Respir. Physiol. 45, 121–131.
KING, A. S. (1966). Structural and functional aspects of the avian lung and air sacs. Int. Rev. gen. exp. Zool. 2, 171–267.
KUETHE, D. O. (1988). Fluid mechanical valving of air flow in bird lungs. J. exp. Biol. 136, 1–12.
MAINA, J. N. (1989). The morphometry of the avian lung. In Form and Function in Birds, vol. 4 (ed. A. S. King and J. McLelland), pp. 307–368. London: Academic Press.
PIIPER, J. F., DREES, F. ANDSCHEID, P. (1970). Gas exchange in the domestic fowl during spontaneous breathing and artificial ventilation. Respir. Physiol. 9, 234–245.
POWELL, F. L., GEISER, J., GRATZ, R. K. AND SCHEID, P. (1981).
Airflow in the avian respiratory tract: Variations of O2and CO2
concentrations in the bronchi of the duck. Respir. Physiol. 44, 195–213.
SCHEID, P. ANDPIIPER, J. (1970). Analysis of gas exchange in the avian lung: Theory and experiments in the domestic fowl. Respir. Physiol. 9, 246–258.
SCHEID, P. ANDPIIPER, J. (1971). Direct measurement of the pathway of respired gas in duck lungs. Respir. Physiol. 11, 308–314. SCHEID, P. ANDPIIPER, J. (1987). Gas exchange and transport. In Bird
Respiration, vol. 1 (ed. T. J. Seller), pp. 97–130. Boca Raton, FL: CRC Press.
SCHEID, P., SLAMA, H. AND PIIPER, J. (1972). Mechanisms of
unidirectional flow in the parabronchi of avian lungs: measurements in duck lung preparations. Respir. Physiol. 14, 83–95.
SCHEID, P., SLAMA, H. AND WILLMER, H. (1974). Volume and ventilation of air sacs in ducks studies by inert gas wash-out. Respir. Physiol. 21, 19–36.
SCHMIDT-NIELSEN, K., KANWISHER, J., LASIEWSKI, R. C., COHN, J. E.
ANDBRETZ, W. L. (1969). Temperature regulation and respiration in the ostrich. Condor 71, 341–352.
SOUM, J. M. (1896). Recherches physiologiques sur l’appareil respiratoire des oiseaux. Annls Univ. Lyons 28, 1–130.
WANG, N., BANZETT, R. B., BUTLER, J. P. ANDFREDBERG, J. J. (1988).
Bird lung models show that convective inertia effects inspiratory aerodynamic valving. Respir. Physiol. 73, 111–124.
WANG, N., BANZETT, R. B., NATIONS, C. S. ANDJENKINS, F. A., JR
(1992). An aerodynamic valve in the avian primary bronchus. J. exp. Zool. 262, 441–445.
WILSON, T. A., RODARTE, J. R. ANDBUTLER, J. P. (1986). Wave-speed
and viscous flow limitation. In Handbook of Physiology, The Respiratory System, vol. 3(1) (ed. A. P. Fishman, P. T. Macklem, J. Mead and S. R. Geiger), pp. 55–61. Bethesda, MA: American Physiological Society.
ZEUTHEN, E. (1942). The ventilation of the respiratory tract in birds. K. danske Videnskb. Selskb. Biol. Medd. 17, 1–50.