Elevations in energy expenditure are accompanied by increments in both ventilation and cardiac output to maintain appropriate levels of gas exchange. These responses are usually assumed to be maximized only during strenuous bouts of locomotion, i.e. running, crawling, flying or swimming (Brett, 1972; Seeherman et al., 1981; Walton et al., 1990; Suarez, 1992) or during other activities involving vigorous contraction of skeletal muscle (e.g. calling by anurans; Taigen and Wells, 1985). In such cases of extreme physical exertion, the elevated cardiac output is largely devoted to skeletal muscle in order to sustain aerobic metabolism. In contrast, it has been demonstrated that Burmese pythons (Python molurus) attain maximum rates of oxygen consumption not during strenuous exercise but instead during digestion (Secor and Diamond, 1995, 1997). The increase in metabolic rate generated from the mechanical and physiological processes of digestion is referred to as ‘specific dynamic action’ (SDA) and represents the energetic cost of processing, digesting and absorbing food (Brody, 1945; Klieber, 1975). For Burmese pythons, SDA can stimulate an increase in oxygen consumption of as much as a 44-fold, an increase that far surpasses the seven- to tenfold increment they experience during vigorous crawling (Secor and Diamond, 1995) or while rapidly contracting their axial
musculature to generate heat during egg incubation (Vinegar et al., 1970).
Considerable attention has been focused on the potential limiting steps in the oxygen transport and utilization cascade. Possible limitations include the capacity of the ventilatory system to take up oxygen, the capacity of the cardiovascular system to deliver oxygen to muscle cells and the oxidative capacity of muscle mitochondria (Taylor et al., 1981; Suarez, 1996; Wagner, 1996). Because pythons experience significant increases in metabolic rate during both movement and digestion, they provide an exemplary model in which to examine and compare potential limits in these two different elevated metabolic states. Both activity and digestion share the same ventilatory and cardiovascular pathways of oxygen intake and transport, but differ in the pathways of oxygen utilization (skeletal muscle versus gut tissues). What limits metabolism during these two conditions?
The study of these two metabolic demands, both singly and in combination, may illuminate the specific mechanisms that establish the upper limit to V.O∑max during exercise and digestion. For instance, if oxygen utilization by skeletal muscle actually sets the limit to aerobic metabolic rate during exercise, the true functional capacity of other components (ventilatory and cardiovascular) may be revealed in studies on digesting Printed in Great Britain © The Company of Biologists Limited 2000
JEB2847
To investigate the potential limiting steps of peak metabolic rates, we examined gas exchange rates (V.O∑,V
.
CO∑), respiratory exchange ratio (RER), breathing
frequency, tidal volume, minute ventilation volume (V.E) as well as the heart rate, systemic blood flow and stroke volume of Burmese pythons (Python molurus) while fasting at rest, exercising, digesting and exercising while digesting. All measured variables increased significantly during exercise (crawling at 0.4 km h−1and at V.
O∑max), highlighted
by a 17-fold increase in V.CO∑and a 24-fold increase in V
.
E. During the digestion of a meal equivalent to 25 % of the snake’s body mass, pythons responded with increases in V.O∑ and heart rate similar to those experienced during
exercise, along with a 4.5-fold increase in systemic blood flow. Interestingly, pythons hyperventilated while exercising, whereas they hypoventilated during digestion. The combined demands of exercise and digestion resulted in significantly higher V.O∑, V
.
CO∑, breathing frequency
and heart rate than during either exercise or digestion alone. Evidently, the capacities of the ventilatory and cardiovascular systems to transport oxygen to locomotor muscles are not a limiting factor in the attainment of peak metabolic rates during exercise in pythons
Key words: reptile, snake, Python molurus, exercise, digestion, gas exchange, ventilation, cardiac output, specific dynamic action. Summary
Introduction
VENTILATORY AND CARDIOVASCULAR RESPONSES OF A PYTHON (PYTHON
MOLURUS) TO EXERCISE AND DIGESTION
STEPHEN M. SECOR1,*, JAMES W. HICKS2 ANDALBERT F. BENNETT2
1Department of Physiology, University of California at Los Angeles School of Medicine, Los Angeles, CA
90095-1751, USA and 2Department of Ecology and Evolutionary Biology, University of California at Irvine, Irvine, CA 92697-2525, USA
*Present address: Department of Biology, PO Box 1848, University of Mississippi, MS 38677-1848, USA (e-mail: [email protected])
and/or exercising pythons. The goals of this study were (i) to evaluate for Burmese pythons the increase in gas exchange and cardiopulmonary performance during strenuous exercise alone, (ii) to document the time course and magnitude of these variables in pythons digesting at rest, and (iii) to assess the responses of these variables in pythons exercising while digesting.
Materials and methods
Experimental animals
We used six juvenile (2-year-old) Burmese pythons (Python
molurus L.) with an average mass of 1380±60 g (mean ±S.E.M.; range 1160–1600 g). All snakes were purchased as hatchlings from a commercial breeder (Captive Bred Reptiles, Oklahoma City, OK, USA) and maintained at UCLA prior to their transportation and study at UC Irvine. Pythons were housed individually in plastic cages under a light:dark photoperiod of 12 h:12 h, provided with water weekly, and fed laboratory rats once every 2 weeks. Prior to this study, snakes were fasted for 1 month to ensure that they became post-digestive (digestion is usually completed within 14 days after feeding; Secor and Diamond, 1995). Python care and research were carried out under UCLA Animal Research Committee Protocol Number 93-204 and UCI Animal Research Committee Protocol Number 96-1549.
Blood flow probes and mask attachment
To measure gas exchange, ventilation and cardiac performance simultaneously, we surgically implanted perivascular flow probes (model 2R, Transonic Systems Inc., Ithaca, NY, USA) around the right and left systemic arteries of each snake and attached a sealed plastic mask around its head. For the surgery, we initially anesthetized each snake by placing it within a sealed 4 l container containing a cloth soaked with halothane (Halocarbon Laboratories, River Edge, NJ, USA). Once a snake became completely anesthetized (flaccid body tone), we laid it on its dorsum and scrubbed the ventral and lateral scales in the region of the heart (determined by observing the heart palpating against the ventral scales) with topical antiseptic (Betadine solution, Purdue Frederick Co., Norwalk, CT, USA). To maintain anesthesia during surgery, we continuously administered halothane using a vaporizer (2–3 % halothane mixture) attached to a mask held around the snake’s head. We then made an 8 cm incision several centimeters distal from the heart between the ventral and first row of dorsal scales on the snake’s right side. The incision was retracted, and the right and left systemic vessels were located and isolated. We attached a flow probe to each vessel and passed their wire leads through a small incision made through the body wall and skin approximately 10 cm distal to the flow probes. The leads and their terminal connectors were sutured to the dorsal scales at several locations to minimize any snagging or twisting of the leads. We closed the incisions with an inner (muscular layer) and outer (scales) set of interrupted sutures (3-0 Vicryl, Ethicon Inc., Somerville, NJ, USA) and a
thin application of cyanoacrylate tissue glue (Nexaband, S/C-TriPoint Medical, Raleigh, NC, USA) to the outer wound. Following surgery, each snake was administered intramuscularly 0.5 mg kg−1 of an analgesic (Flunixin meglamine, Phoenix Pharmaceutical Inc., St Joseph, MO, USA) and 3 mg kg−1 of an antibiotic (Baytril, Bayer Corporation, Shawnee Mission, KS, USA). Snakes typically recovered from anesthesia within 1–2 h.
On the day following surgery, we attached a lightweight plastic mask (mass 6.8±0.2 g, volume 63±1 ml; means ±S.E.M., N=6) around the head of each snake. Each mask was fashioned from thin (0.2 mm thick) pieces of clear plastic and had two ports attached to the dorsal surface of the mask for connecting with incurrent and excurrent air lines. We used 5 min epoxy resin to seal the seams of the masks and to attach the mask to the snake’s head. Enough epoxy resin was inserted between the scales and the back edge of the mask to form an airtight seal. We tested each seal by attaching air hoses to the ports, submerging the snake’s head under water in a bucket and forcing air into the masks from one of the air hoses. If air leaked out from the seams or edge of the mask (noted by emerging bubbles), it was coated with another application of epoxy. All masks were eventually found to be airtight. Following the attachment of masks, snakes were allowed to rest for 1 day prior to measurements.
Measurements of gas exchange, ventilation and cardiovascular performance
We measured the following seven variables: the rate of oxygen consumption (V.O∑as ml kg−1min−1), the rate of carbon dioxide production (V.CO∑ as ml kg−1min−1), breathing frequency (breaths min−1), tidal volume (ml kg−1), minute ventilation volume (V.E as ml kg−1min−1), heart rate (beats min−1) and blood flow through the right and left systemic arteries (ml kg−1min−1). Air lines were attached to the ports of the mask, and we pumped air through the mask at 500 ml min−1. Changes in airflow representing inhalation and exhalation volumes were measured using a calibrated pneumtachograph (8421, series 0-5 LPM, H. Rudolph, Inc., MO, USA) connected to a differential pressure transducer (Validyne MP 45-1-871). A subsample of the excurrent air was continuously pulled through an oxygen analyzer (S-3A, Applied Electrochemistry, Pittsburgh, PE, USA) and a carbon dioxide analyzer (CD-3A, Applied Electrochemistry, Pittsburgh, PE, USA) in series, to measure O2and CO2concentrations.
Experimental protocol
We simultaneously recorded each variable from fasting pythons at rest over a 3 day period. Twice daily (morning and afternoon), we continuously recorded variables from each snake as it rested in its cage for a minimum of 2 h. Following the 3 day set of resting measurements, each snake was removed from its cage and placed on a motorized treadmill. We increased tread speed to 0.4 km h−1, at which pythons
reached V.O∑max(see Results), and recorded variables while
the snake crawled at 0.4 km h−1. These measurements were
terminated after the snake had maintained a steady rate of crawling for several minutes. We then removed each snake’s mask and returned it to its cage. On the following day, each snake consumed a rat meal equivalent to approximately 25 % of the snake’s body mass. Within 2 h after each snake had swallowed its rat, we reattached and sealed its mask. For the next 72 h, we measured all variables at 8 h intervals (for a minimum of 1 h) from each snake as it rested quietly digesting its meal. Immediately following the 72 h recordings, we removed each snake from its cage, placed it back on the treadmill and recorded variables as before as each snake was digesting and crawling at 0.4 km h−1.
Statistical analyses
We reviewed the sets of continuously recorded data and selected and averaged five 1 min intervals from segments of stable readings. We quantified each variable using the software program AcqKnowledge (Biopac Systems, Inc., Santa Barbara, CA, USA). V.O∑, V
.
CO∑and the tidal volume of single breaths
were determined as the area below or above the baseline signal for each gas. The relationships between this area and V.O∑and V.CO∑ were determined by simulating exhalations with
injections of known gas compositions into a sealed mask attached to the air lines. Expired tidal volume was similarly determined from the integrated flow signal from the differential pressure transducer in response to injections of a range of gas volumes into the mask. These calibrations procedures produced very tight correlations between injected gas volumes and integrated flow signal (all r2>0.98) and were conducted
before, during and after experiments.
We used a repeated-design analysis of variance (ANOVA) to test for a significant treatment effect (time) on post-feeding measurements at rest and separately for significant differences among four sets of data: resting while fasted, crawling while fasted, peak rates while digesting, and crawling while digesting at 72 h post-feeding. In conjunction with ANOVAs, we made some pairwise mean comparisons between sampling periods or sets of data. We also undertook paired and unpaired t-tests when appropriate. In the text, we report the results of our analyses in terms of their P values. We set P<0.05 as the level of statistical significance and present our results as means ±1
S.E.M. Sample size (N) for all variables was six, unless otherwise noted. All statistical analyses were performed using the microcomputer version of SAS (version 7, SAS Institute, Inc., Cary, NC, USA).
Results
Exercise
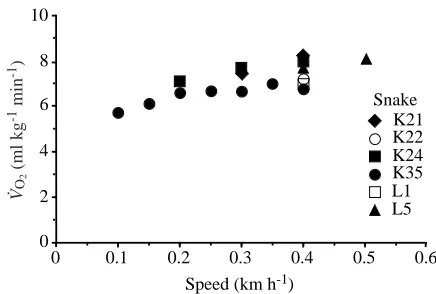
On the treadmill, pythons performed lateral undulations to maintain speed. Over the range of measured speeds (0.1–0.5 km h−1; not all snakes were measured over the entire
range), the available data suggest that V.O∑increases over the
lower speeds and plateaus at around 0.3 km h−1(Fig. 1). We
found no significant difference (unpaired t-test, P=0.36) in V.O∑
measured at 0.3 and at 0.4 km h−1. Therefore, when crawling
at 0.4 km h−1, pythons are apparently experiencing V.
O∑max. This
allows us to compare cardiopulmonary responses of pythons at
V.O∑maxduring exercise with those during digestion.
Gas exchange V.O∑and V
.
CO∑of exercising fasted pythons increased rapidly
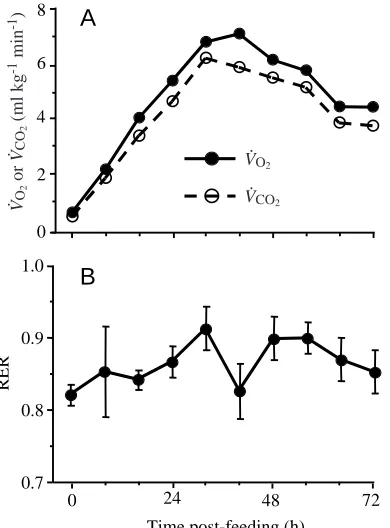
to peak at rates 10 and 16.5 times, respectively, resting values (Table 1). During digestion, pythons experienced significant (all P<0.001) increments in both V.O∑ and V
.
CO∑ during each
8 h interval after feeding until 32 h post-feeding (Fig. 2). Peaks in V.O∑and V
.
CO∑during digestion were attained at 40 h
and 32 h post-feeding, respectively, at values 9 and 9.8 times fasting values (Fig. 2). Both V.O∑and V
.
CO∑had declined from
peak values by 72 h post-feeding, but still remained significantly above fasting rates. Whereas V.O∑did not differ
between its peak during digestion and that experienced during exercise, V.CO∑ was significantly greater during exercise
(Table 1). Therefore, a similar demand for oxygen exchange occurred during these two metabolic states, facilitating comparisons of the patterns of cardiopulmonary support. When digesting pythons exercised, they achieved the highest levels of V.O∑and V
.
CO∑measured, rising to 11.7 and 23.7 times
resting values, respectively (Table 1). These levels of gas exchange significantly exceed those observed during either exercise or digestion (Table 1). The post-feeding increment in respiratory exchange ratio (RER, calculated as V.CO∑/V
.
[image:3.609.334.552.521.668.2]O∑)
Fig. 1. Rates of oxygen consumption (V.O∑) as a function of crawling
speed for six juvenile Python molurus (mass 1380±60 g, mean ±
S.E.M.). Not all pythons were tested at each speed, but all were tested at 0.4 km h−1. Note the apparent plateau of V.O∑at speeds greater than
0.3 km h−1. We therefore assume that V.O∑max during locomotion is
being achieved at 0.4 km h−1. 0
2 4 6 8 10
0 0.1 0.2 0.3 0.4 0.5 0.6 Speed (km h-1)
K21 K22 K24 K35 L1 L5 Snake
VO
2
(ml kg
-1 min -1)
was not significant, whereas fasting exercise and digesting exercise each induced a significant (both P<0.002) increase in RER to 1.34 and 1.65, respectively (Table 1).
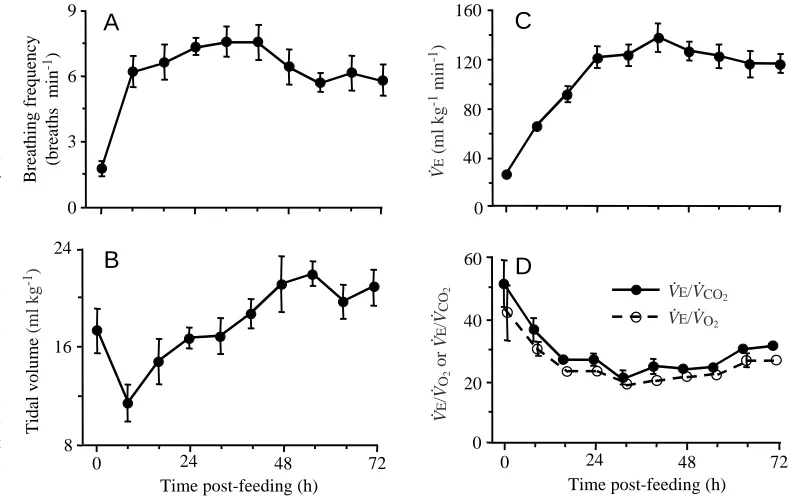
Ventilation
During exercise (fasted), breathing frequency, tidal volume and V.E increased by a factor of 8.2-, 2.5- and 24-fold,
respectively, over resting values (Table 1). After feeding, all three of these variables also changed significantly (all P<0.003) within 8 h (Fig. 3) compared with resting values. Whereas breathing frequency did not change significantly thereafter for the next 2 days of digestion, V.E increased significantly (all P<0.001) during each of the two subsequent 8 h periods. Both
breathing frequency and V.Epeaked at 40 h post-feeding, at rates
4.3 and 5.1 times fasting values, respectively. Tidal volume initially decreased, then returned to fasting levels (16–40 h post-feeding), and later increased to a maximum at 56 h post-feeding (Fig. 3B). By 72 h post-feeding, both breathing frequency and
V.E had significantly (both P<0.027) declined from the 40 h
values. During exercise at 72 h post-feeding, V.Eincreased above
[image:4.609.49.560.125.331.2]peak digestion values and was not significantly different from that during fasting exercise.
Table 1. Comparison of gas exchange (V˙O2, V˙CO2), respiratory exchange ratio (RER), breathing frequency, tidal volume, minute
ventilation (V˙E), heart rate, blood flow through the right and left systemic arteries, cardiac output (Q˙sys*), stroke volume (Vs*),
O2extraction and CO2carriage of juvenile Burmese pythons Python molurus (mean mass 1380±60 g) resting while fasted,
exercising while fasted, peak during digestion and exercising at 72 h post-feeding
Exercising Resting Exercising Peak during at 72 h Variable N while fasted while fasted digestion post-feeding
V˙O2(ml kg−1min−1) 6 0.76±0.10a 7.6±0.2b 7.2±0.2b 8.9±0.4c
V˙CO2(ml kg−1min−1) 6 0.62±0.08a 10.3±1.0c 6.7±0.3b 14.7±1.2d
RER (V˙CO2/V˙O2) 6 0.82±0.01a 1.34±0.10b 0.98±0.01a 1.65±0.14c
Breathing frequency (breaths min−1) 6 1.8±0.3a 14.7±0.8c 8.9±0.6b 18.0±0.8d
Tidal volume (ml kg−1) 6 17.4±1.8a 44.1±2.8d 24.3±1.2b 33.0±2.4c V˙E(ml kg−1min−1) 6 27.8±2.1a 660±51c 143±12b 587±38c V˙E/V˙O2 6 41.8±9.1b 86.8±5.5d 19.4±1.7a 66.6±5.1c
V˙E/V˙CO2 6 50.9±11.4b,c 69.4±5.7c 20.2±2.1a 41.9±4.9ab
Heart rate (beats min−1) 6 24.7±1.4a 56.9±1.4b 59.8±0.9b 65.6±1.9c
Left systemic blood flow (ml kg−1min−1) 6 10.8±0.8a 31.8±1.9b 42.9±2.3d 37.4±0.6c
Right systemic blood flow (ml kg−1min−1) 5 7.8±1.9a 21.2±2.5b 43.2±3.4c 24.7±1.0b Q.sys* (ml kg−1min−1) 5 18.9±2.3a 54.9±2.1b 84.5±5.5c 62.0±1.4b Vs* (ml kg−1) 5 0.74±0.06a 0.95±0.04b 1.49±0.10c 0.95±0.03b
O2extraction (ml O2ml−1Q
.
sys*) 5 0.04±0.01a 0.13±0.01c 0.09±0.01b 0.14±0.01c
CO2carriage (ml CO2ml−1Q
.
sys*) 5 0.03±0.01a 0.18±0.02c 0.09±0.01b 0.24±0.02c
Values are presented as means ± 1 S.E.M.; N refers to the number of individual pythons.
For each variable, superscript letters that are shared denote non-significant (P>0.05) differences between means as determined from planned pair-wise comparisons.
Air convection requirements (V˙E/V˙O2, V˙E/V˙CO2) listed under ‘Peak during digestion’ were calculated at the time of maximum gas exchange.
Time post-feeding (h)
RER
0 8
4
0.7 0.8 0.9 1.0
0 24 48 72
2 6
A
B
VO2
.
VCO2
. VO
2
or
VCO
2
(ml kg
-1 min -1)
..
Fig. 2. (A) Rates of oxygen consumption (V.O∑) and carbon dioxide production (V.CO∑) and (B) respiratory exchange ratio (RER) for six juvenile Python molurus prior to (0 h) and up to 72 h after consuming a rat meal equivalent in mass to 25 % of the snake’s body mass. Vertical bars represent ±1 S.E.M., but bars are omitted if they are smaller than the symbol for the mean value. Note the significant nine- to tenfold increases in V.O∑and V
.
[image:4.609.67.262.473.737.2]Pythons hyperventilated during fasting exercise: air convection requirements more than doubled for V.O∑(V.E/V.O∑) and
increased by 36 % for V.CO∑ (V.E/V.CO∑) over resting values
(Table 1). During digestion, however, pythons hypoventilated: air convection requirements for V.O∑and V.CO∑decreased to levels
46 % and 40 %, respectively, of rested fasting values (Fig. 3). With exercise, the air convection requirements of digesting snakes compared with resting fasted snakes, increased significantly by 150 % and 35 %, respectively, for V.E/V.O∑ and V.E/V.CO∑, but the levels reached were significantly less than those
experienced during fasting exercise (Table 1).
Cardiovascular performance
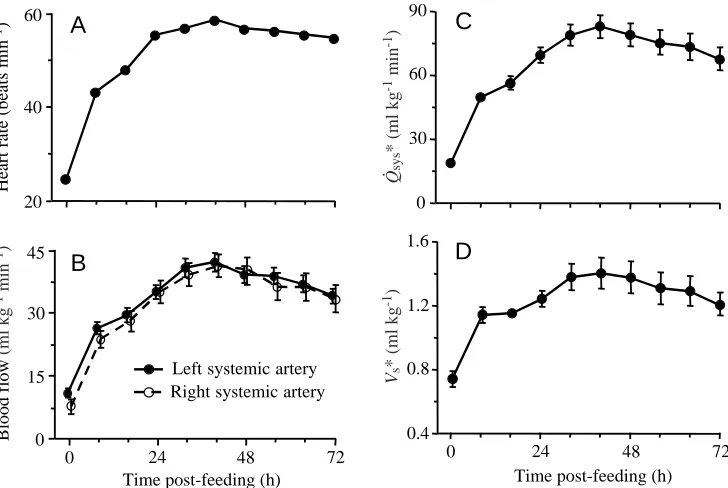
Resting and fasted pythons responded to exercise and to digestion with more than a doubling of heart rate (Table 1; Fig. 4). When induced to crawl at 72 h post-feeding, heart rate rose to a level that was 2.7 times rested fasting levels and significantly greater than rates attained during either fasting exercise or digestion (Table 1).
During exercise, blood flow through the right and left systemic arteries increased by 172 % and 194 %, respectively, above resting rates (Table 1). Ingestion induced significant (all
P<0.0001) increases in blood flow within 8 h, with rates
peaking at 40 h post-feeding at 5.3 and 3.9 times fasting values, respectively, for the right and left vessels (Fig. 4). In response to the joint demands of digestion and exercise, blood flow was actually less than the peaks reached during digestion alone (Table 1).
The combined flow through the right and left systemic arteries provides an approximation of cardiac systemic output (Q.sys). This underestimates true Q
.
sys (and is therefore
designated Q.sys*) because it does not include the blood
entering the carotid, vertebral and coronary vessels that exit the
systemic vessels prior to the positions of the flow probes. We found Q.sys* to increase by 2.9-, 4.5- and 3.3-fold above fasted
resting values during fasting exercise, digestion and digesting exercise, respectively (Fig. 4; Table 1). Stroke volume (Vs*,
calculated as Q.sys* divided by heart rate) increased by 30 %
during exercise and by 90 % during digestion (Table 1; Fig. 4). While exercising and digesting, Vs* returned to the same level
experienced during exercising alone (Table 1).
Discussion
Pythons exhibit a marked increase in cardiopulmonary performance during both exercise and digestion. Although these two activities shared similar rates heart rates and rates of O2
utilization, they differed in V.CO∑, RER, ventilation and cardiac
output, indicating that patterns of cardiopulmonary support are distinct, even at equal elevated rates of metabolism. In this study, pulmonary performance capacity (i.e. minute volume, V.E) was
greater during exercise, whereas cardiac performance peaked during digestion. The combined demands of exercise and digestion induced further increases (significantly above values for either exercise or digestion alone) in V.O∑, V.CO∑, RER,
breathing frequency and heart rate. In the ensuing discussion, we shall discuss the python’s response to these sources of metabolic demand separately and in combination.
Cardiopulmonary support during fasted exercise
Pythons responded to exercise with significant increases in gas exchange, ventilation and cardiac output. Crawling at 0.4 km h−1, pythons attained V.
O∑max, evident from the asymptote
in V.O∑ with increasing speed (Fig. 1), a dramatic increase in
blood lactate levels (S. Secor and J. Diamond, unpublished data) and the very short duration of their crawling endurance (no more
0 20 40 60 0 40 80 120 160
8 16 24
Tidal volume
(ml kg
-1) 0 3 6 9
Breathing frequency
(breaths min
-1)
A
B
D
C
Time post-feeding (h)
0 24 48 72
Time post-feeding (h)
0 24 48 72
V
E
(ml kg
-1 min -1)
.
V
E
/V
O2
or
V
E
/V
CO
2
.
.
..
VE/VO2
. .
VE/VCO2
. .
Fig. 3. (A) Breathing frequency, (B) tidal volume, (C) minute ventilation (V.E), and (D) air
convection requirements (V.E/V.O∑, V.E/V
.
CO∑) for six juvenile Python molurus prior to (0 h) and up to
72 h after consuming a rat meal equivalent in mass to 25 % of the snake’s body mass. Vertical bars represent ±1 S.E.M., but bars are omitted if they are smaller than the symbol for the mean value. Note the significant increases in breathing frequency, tidal volume and V.E and the significant
[image:5.609.170.565.75.324.2]than 10 min at that speed). With exercise, V.CO∑increased more
than V.O∑, resulting in a significant increase in RER that exceeded
a value of 1.0, suggesting that exercise induces a state of metabolic acidosis for pythons. The astonishing 24-fold increase in V.E during exercise is a product primarily of the 8.2-fold increase in breathing frequency and secondarily the 2.5-fold increase in tidal volume. Joined by the 10-fold increase in V.O∑,
air convection requirements (V.E/V.O∑) doubled during exercise,
indicating that compared with rest, pythons hyperventilate during exercise. The lizard Varanus exanthematicus (Wang et al., 1997) and several mammalian species (Wasserman et al., 1980; Pan et al., 1984; Longworth et al., 1989) have also been observed to hyperventilate during exercise. The exercise-induced increase in systemic output for pythons is the product of a 130 % increase in heart rate and a 30 % increase in calculated stroke volume. Apparently, during activity, oxygen and carbon dioxide transport in the cardiovascular system becomes much efficient: oxygen extraction (ml O2ml−1Q
.
sys*) more than triples
and carbon dioxide carriage (ml CO2ml−1Q
.
sys*) increases
sixfold (Table 1).
Cardiopulmonary support during digestion
After feeding, pythons responded with the characteristic postprandial increase in metabolic rate (specific dynamic action). For pythons, the magnitude of this metabolic response is closely correlated with relative meal size, and for the meal size of 25 % of snake body mass, the peak V.O∑measured in this
study was equivalent to that observed in previous studies (Secor and Diamond, 1995, 1997). The greater than 400 % increase in V.Eexperienced during digestion is the product of a large increase in breathing frequency (by 360 %) and a much smaller increase in tidal volume (by 40 %). These ventilatory increments experienced during digestion were significantly smaller than those experienced during fasting exercise, even
though V.O∑levels were equal. Thus, the resultant air convection
requirement (V.E/V.O∑) at peak digestive V
.
O∑was less than half
of that experienced at rest. In contrast to hyperventilating during exercise, pythons hypoventilated during digestion. Because these snakes have ingested a relatively large meal, the postprandial hypoventilation may simply be the result of the distended stomach constraining lung expansion. However, this is not supported by the observation that V.E can increase substantially during postprandial exercise. It is more likely that the postprandial hypoventilation represents a change in ventilatory control, potentially resulting from the elevation in plasma [HCO3−] that occurs in pythons during digestion (Secor
and Diamond, 1995).
Concurrent with their postprandial increase in gas exchange, pythons also experience a noted increase in cardiac output.
Q.sys*, an approximation of cardiac output, rose by 350 %
during digestion, as a result of relatively equal increases in heart rate (by 140 %) and stroke volume (by 100 %). The significantly higher Q.sys* that pythons attained during
digestion compared with during fasting exercise is largely attributable to the significantly greater Vs* during digestion.
This greater Vs* can partially be explained by the postprandial
increase in heart mass (as much as 50 %) that pythons experience (Secor and Diamond, 1995). Oxygen and carbon dioxide transport efficiencies increased above resting levels during digestion, but were significantly less than those observed during activity (Table 1).
Cardiopulmonary support during postprandial exercise
Studies on the individual and paired demands of exercise and digestion have largely focused on humans. For humans, levels of moderate exercise while fasted induce an increase in V.O∑of
300–350 %, whereas digestion alone causes a more modest 30 % increase in V.O∑ (Segal and Gutin, 1983; Welle, 1984). When 20
40 60
0 30 60 90
0.4 0.8 1.2 1.6
0 15 30 45
Right systemic artery Left systemic artery
Blood flow
(ml kg
-1 min -1)
Heart rate (beats min
-1)
A
B
D
C
Time post-feeding (h)
0 24 48 72
Time post-feeding (h)
0 24 48 72
Qsys
* (ml kg
-1 min -1)
.
Vs
* (ml kg
-1) Fig. 4. (A) Heart rate, (B) blood flow
though the left and right systemic arteries, (C) systemic cardiac output (Q.sys*) and (D) stroke volume (Vs*)
for six juvenile Python molurus prior to (0 h) and up to 72 h after consuming a rat meal equivalent to 25 % of the snake’s body mass. Vertical bars represent ±1 S.E.M., but
[image:6.609.194.558.72.316.2]occurring together, these demands result in a 16–54 % further increase in V.O∑ over exercise-only values. It is uncertain for
humans whether the response to digestion is simply additive to that of exercise. Metabolic responses to both activities have been found to be less than (Welle, 1984), equal to (Belko et al., 1986) or greater than (Segal and Gutin, 1983) that predicted on the basis of summing the individual responses of exercise and digestion. For exercising and digesting pythons, we asked (i) whether the response of one metabolic demand was dominant over that of the other, and (ii) whether the responses were additive.
During postprandial exercise (at 72 h post-feeding), V.O∑
and V.CO∑rose to levels significantly greater than those during
either exercise or digestion alone (Tables 1, 2). With activity,
V.O∑ and V
.
CO∑ of digesting pythons had risen by 95 % and
280 %, respectively (Table 2). If the response to exercise and digestion were additive (i.e. the sum of the two independent responses), then V.O∑ and V
.
CO∑of exercising pythons at 72 h
post-feeding would be predicted to increase to 11.3 and 13.5 ml kg−1min−1, respectively (Table 2, calculation of
predicted values is explained in the footnote). The observed
V.O∑was 80 % of the predicted value, whereas the observed V.CO∑was 105 % of that predicted (Table 2). Apparently, the
response in V.O∑ is nearly additive, whereas the response in V.CO∑ is fully additive of the separate responses to exercise
and digestion. For pythons exercising and digesting, the larger increase in V.CO∑relative to the increase in V
.
O∑resulted
in a significantly greater RER than observed during either exercise or digestion alone (Table 1).
The breathing frequency of pythons during digesting exercise was significantly greater than that during either fasting exercise or resting at 72 h post-feeding (Tables 1, 2), and did not differ from that predicted for an additive effect of these two metabolic demands (Tables 1, 2). In contrast, tidal volume during exercise and digestion was significantly less than that during exercise alone. There was, therefore, was no additive relationship between exercise and digestion for tidal volume (Tables 1, 2). Minute ventilation during exercising at 72 h post-feeding, statistically equivalent to that during exercise alone, did not differ from the predicted value assuming an additive relationship (Table 2). Ventilatory convection requirements suggest that the postprandial exercise response is dominated by exercise rather than digestion: V.E/V.O∑ and V
.
E/V.CO∑ both
increase significantly (both P<0.03) with exercise above 72 h post-feeding values, and the magnitude of V.E/V.O∑, in
comparison with that of resting fasted animals, is suggestive of hyperventilation (Table 1).
During postprandial exercise, heart rates increased by 17 % and 20 % (both P<0.002), respectively, over fasting exercise and resting 72 h post-feeding rates, but these increases were not enough to demonstrate an additive response (Tables 1, 2). Pythons did not significantly increase their Q.sys* with
[image:7.609.50.566.425.644.2]exercise at 72 h post-feeding, indicating that cardiac output
Table 2. Two sets of paired comparisons of ventilatory and cardiovasculatory variables from juvenile Burmese pythons (Python molurus) at 72 h post-feeding
Paired t-test: resting Paired t-test: actual at 72 h post-feeding Predicted versus predicted
Resting at Exercising at versus exercising at exercising at exercising at Variable N 72 h post-feeding 72 h post-feeding 72 h post-feeding P 72 h post-feeding 72 h post-feeding P
V˙O2(ml kg−1min−1) 5 4.5±0.1 9.0±0.4 <0.0001 11.3±0.4 0.045
V˙CO2(ml kg−1min−1) 5 3.8±0.2 14.2±1.4 0.002 13.5±1.1 0.76
Breathing frequency 5 6.0±0.8 18.1±1.0 <0.0001 18.9±1.1 0.46 (breaths min−1)
Tidal volume (ml kg−1) 5 20.2±1.6 33.7±2.8 0.003 47.8±2.9 0.026
V˙E(ml kg−1min−1) 5 118±9 604±41 0.0002 750±56 0.14
Heart rate (beats min−1) 5 55.8±1.5 66.6±2.1 0.0016 87.4±1.0 0.0011 Left systemic blood flow 5 34.4±2.0 37.3±0.8 0.21 55.1±1.7 0.0001
(ml kg−1min−1)
Right systemic blood flow 4 31.7±4.2 24.0±1.5 0.22 45.7±4.5 0.025 (ml kg−1min−1)
Q.sys* (ml kg−1min−1) 4 58.9±2.2 61.9±3.8 0.65 95.7±2.6 0.006 Vs* (ml kg−1) 4 1.18±0.08 0.95±0.038 0.084 1.38±0.06 0.008
O2extraction (ml O2ml−1Q
.
sys*) 4 0.07±0.01 0.15±0.01 0.003 0.17±0.01 0.40
CO2carriage (ml CO2ml−1Q
.
sys*) 4 0.06±0.01 0.22±0.03 0.005 0.21±0.02 0.74
The first set compares measurements made of snakes resting at 72 h post-feeding with exercising at 72 h post-feeding.
The second set compares the actual measured values during exercise at 72 h post-feeding with the predicted values based upon an additive relationship of responses to exercising fasted and digesting at 72 h post-feeding.
Predicted values for exercising at 72 h feeding for each snakes were calculated as: (exercise while fasted) plus (resting at 772 h post-feeding minus resting while fasted) (see Table 1).
Values are presented as means ± 1 S.E.M.; N refers to the number of individual snakes.
Results of paired t-tests are presented as P values.
had already reached a maximum during digestion alone (Table 2). Stroke volume of digesting snakes did not change significantly with exercise, and was the same as that experienced during exercise alone (Table 1). Gas transport efficiencies increased significantly (all P<0.005) when digesting pythons exercised: oxygen extraction doubled and carbon dioxide carriage more than tripled from the resting 72 h post-feeding values (Table 2).
Cardiopulmonary limits to metabolism
Studies on mammals, birds and fishes have usually shown that
V.O∑maxis attained during locomotion (Brett, 1972; Seeherman et
al., 1981; Suarez, 1992). In contrast, some frogs and snakes have demonstrated higher V.O∑and higher endurance at elevated V
.
O∑
during non-locomotor activities. Male treefrogs Hyla versicolor achieve higher V.O∑ during calling than during locomotion
(Taigen and Wells, 1985). Whereas in the present study the V.O∑
of pythons during digestion of meals equal to 25 % of body mass did not differ from locomotor V.O∑max, V
.
O∑during the digestion
of larger meals (⭓35 % of body mass) can exceed locomotor V.O∑max by as much as 200 % (Secor and Diamond, 1997). In addition, pythons are able to maintain locomotor V.O∑maxfor only approximately 10 min, whereas during digestion they can sustain a minimum V.O∑of 7.6 ml kg−1min−1(locomotor V
.
O∑maxof this study) for three consecutive days (Secor and Diamond, 1997).
Assuming that maximal rates of aerobic metabolism (V.O∑max) are attained only during strenuous locomotor activities, the design of the pulmonary, cardiovascular and/or skeletal muscular system has been scrutinized for the limiting step (or steps) of aerobic metabolism (Taylor et al., 1981; Suarez, 1996; Wagner, 1996). The recent findings for pythons and previously for frogs indicate that maximal levels of gas transport and cardiopulmonary function (including breathing rate, heart rate, Vs* and Q
.
sys*) may not be attained during locomotor activity. Therefore, cardiopulmonary factors cannot be asserted to limit (or co-limit) oxygen consumption or gas exchange during locomotor activity in these animals. For pythons, locomotor V.O∑max is apparently not set by cardiopulmonary limits but is possibly dictated by the oxygen diffusion and/or aerobic capacity of the skeletal muscle. Likewise, during digestion, pulmonary ventilation cannot be asserted to be a limiting factor, since postprandial exercise results in a rapid and marked increase in both breathing frequency and tidal volume. When postprandial animals begin exercising, cardiac output does not increase, but the efficiency of cardiovascular gas transport does increase. Therefore, either cardiac capacity and/or peripheral oxygen diffusion or utilization in the gut may limit digestive V.O∑max. Finally, as is now clear, locomotor activity does not elicit V.O∑max in these pythons or in certain species of anurans. Therefore, the hypothesis of symmorphosis (Taylor et al., 1981) cannot be adequately examined or tested in ectothermic vertebrates in general by observations during locomotor activity alone.
This study was financially supported by a NSF Grant (IBN-9727762) to J.W.H. and A.F.B. and by a NIH grant (GM-14772) to Dr Jared Diamond. We are grateful to Dr Colleen
Farmer for technical assistance in this project and to Dr Jared Diamond for his helpful comments.
References
Belko, A. Z., Barbieri, T. F. and Wong, E. C. (1986). Effect of energy and protein intake and exercise intensity on the thermic effect of food. Am. J. Clin. Nutrit. 43, 863–869.
Brett, J. R. (1972). The metabolic demand for oxygen in fish, particularily salmonids and a comparison with other vertebrates.
Respir. Physiol. 14, 151–170.
Brody, S. (1945). Bioenergetics and Growth. New York: Reinhold Publ. Co.
Klieber, M. (1975). The Fire of Life. New York: Krieger.
Longworth, K. E., Jones, J. H., Bicudo, J. E. P. W., Taylor, C. R. and Weibel, W. R. (1989). High rate of O2 consumption in exercising foxes: large PO∑difference drives diffusion across the
lung. Respir. Physiol. 77, 263–276.
Pan, L. G., Forster, H. V., Bisgard, G. E., Dorsey, S. M. and Busch, M. A. (1984). Cardiodynamic variables and ventilation during treadmill exercise in ponies. J. Appl. Physiol. 57, 753–759. Secor, S. M. and Diamond, J. (1995). Adaptive responses to feeding in Burmese pythons: pay before pumping. J. Exp. Biol. 198, 1313–1325.
Secor, S. M. and Diamond, J. (1997). Determinants of the post-feeding metabolic response of Burmese pythons, Python molurus.
Physiol. Zool. 70, 202–212.
Seeherman, H. J., Taylor, C. R., Maloiy, G. M. O. and Armstrong, R. B. (1981). Design of the mammalian respiratory system. II. Measuring maximum aerobic capacity. Respir. Physiol. 44, 11–23. Segal, K. R. and Gutin, B. (1983). Thermal effects of food and
exercise in lean and obese women. Metabolism 32, 581–589. Suarez, R. K. (1992). Hummingbird flight: Sustaining the highest
mass-specific metabolic rates among vertebrates. Experientia 48, 565–570.
Suarez, R. K. (1996). Upper limits to mass-specific metabolic rates.
Annu. Rev. Physiol. 58, 583–605.
Taigen, T. L. and Wells, K. D. (1985). Energetics of vocalization by an anuran amphibian (Hyla versicolor). J. Comp. Physiol. B 155, 163–170.
Taylor, R., Maloiy, G. M. O., Weibel, E. R., Langman, V. A., Kamau, J. M. Z., Seeherman, H. J. and Heglund, N. C. (1981). Design of the mammalian respiratory system. III. Scaling maximum aerobic capacity to body mass: wild and domestic mammals. Respir. Physiol. 44, 25–37.
Vinegar, A., Hutchison, V. H. and Dowling, H. G. (1970). Metabolism, energetics and thermoregulation during brooding of snakes of the genus Python (Reptilia, Boidae). Zoologica 55, 19–48. Wagner, P. D. (1996). Determinants of maximal oxygen transport
and utilization. Annu. Rev. Physiol. 58, 21–50.
Walton, M., Jayne, B. C. and Bennett, A. F. (1990). The energetic cost of limbless locomotion. Science 249, 524–527.
Wang, T., Carrier, D. R. and Hicks, J. W. (1997). Ventilation and gas exchange in lizards during treadmill exercise. J. Exp. Biol. 200, 2629–2639.
Wasserman, K., Whipp, B. J., Casburi, R. and Oren, A. (1980). Coupling of ventilation to metabolism during exercise. In Exercise
Bioenergetics and Gas Exchange (ed. P. Cerretelli and B. Whipp),
pp. 159–173. Amsterdam: Elsevier/North-Holland.