1711
Reliability of Functional MR Imaging with
Word-Generation Tasks for Mapping
Broca’s Area
John H. Brannen, Behnam Badie, Chad H. Moritz, Michelle Quigley,
M. Elizabeth Meyerand, and Victor M. Haughton
BACKGROUND AND PURPOSE: Functional MR (fMR) imaging of word generation has
been used to map Broca’s area in some patients selected for craniotomy. The purpose of this
study was to measure the reliability, precision, and accuracy of word-generation tasks to
iden-tify Broca’s area.
METHODS: The Brodmann areas activated during performance of word-generation tasks
were tabulated in 34 consecutive patients referred for fMR imaging mapping of language areas.
In patients performing two iterations of the letter word-generation tasks, test-retest reliability
was quantified by using the concurrence ratio (CR), or the number of voxels activated by each
iteration in proportion to the average number of voxels activated from both iterations of the
task. Among patients who also underwent category or antonym word generation or both, the
similarity of the activation from each task was assessed with the CR. In patients who underwent
electrocortical stimulation (ECS) mapping of speech function during craniotomy while awake,
the sites with speech function were compared with the locations of activation found during
fMR imaging of word generation.
RESULTS: In 31 of 34 patients, activation was identified in the inferior frontal gyri or middle
frontal gyri or both in Brodmann areas 9, 44, 45, or 46, unilaterally or bilaterally, with one
or more of the tasks. Activation was noted in the same gyri when the patient performed a
second iteration of the letter word-generation task or second task. The CR for pixel precision
in a single section averaged 49%. In patients who underwent craniotomy while awake, speech
areas located with ECS coincided with areas of the brain activated during a word-generation
task.
CONCLUSION: fMR imaging with word-generation tasks produces technically satisfactory
maps of Broca’s area, which localize the area accurately and reliably.
Functional MR (fMR) imaging is used to map
el-oquent brain regions before craniotomy because it
depicts these regions more reliably and accurately
than do anatomic landmarks visualized on MR
im-ages (1, 2). According to one report, fMR imaging
shows a ‘‘high degree of promise for language
lo-cation for presurgical planning’’ (3). In previous
reports, many different language tasks have been
used, and activation in multiple lobes of the brain
has been identified. For the identification of Broca’s
Received December 6, 2000; accepted after revision May 13, 2001.
From the Departments of Radiology (J.H.B., C.H.M., V.M.H.), Neurosurgery (B.B.), and Medical Physics (M.Q., M.E.M.), University of Wisconsin, Madison.
Address reprint requests to Victor Haughton, MD, Department of Radiology, Clinical Sciences Center, Module E3, 600 Highland Avenue, Madison, WI 53792.
qAmerican Society of Neuroradiology
area in the frontal lobe, language tasks, such as
covert word generation from letters, categories, or
antonyms, have seemed to be effective. To our
knowledge, the reliability and precision of these
tasks in a large series of patients have not been
reported. The purpose of this study was to
deter-mine the reliability, test-retest precision, and
ac-curacy of the standard word-generation paradigms
for fMR imaging. For precision, we used a
con-currence ratio (CR) between the first and second
iterations of the task; for accuracy, we compared
the results of functional imaging with those of
in-traoperative mapping.
Methods
Patients
per-formed one or more covert word-generation tasks. For each patient, we tabulated the location of activation from a word-generation task. For those who performed more than one lan-guage task, we also measured the agreement between iterations of the task. Finally, we also studied the agreement with results of electrocortical stimulation (ECS) mapping from subsequent craniotomy, obtained while the patient was awake, if available.
Analysis of Activation
In the tabulation of activation from word-generation tasks, five contiguous coronal sections encompassing the middle and inferior frontal gyri were examined. A threshold was chosen for each study, which provided 10–14 activated voxels within the selected sections. In all patients but one, the threshold cho-sen had an uncorrected P value of .001. For patient 28, the threshold chosen had a P value of .005. In patients 3, 5, and 19, in whom no activation was identified at a threshold of P 5.001, multiple thresholds were used without the identifica-tion of activaidentifica-tion. In each case, we assigned the locaidentifica-tion of activation to Brodmann areas 9, 44, 45, and/or 46, on the basis of standard parcellation methods and standard texts (4). Brod-mann area 9 was defined as the middle frontal gyrus superior to the pars opercularis of the inferior frontal gyrus; Brodmann area 44, as the pars opercularis of the inferior frontal gyrus; Brodmann area 45, as the pars triangularis of the inferior fron-tal gyrus; and Brodmann area 46, as the middle fronfron-tal gyrus superior to and the inferior frontal sulcus anterior to the pars triangularis. Activation encompassing the inferior frontal sul-cus was assigned to the Brodmann area with which it was most closely associated. If the activation was equally distributed be-tween the middle and inferior frontal gyri, the activation was assigned to both bordering Brodmann areas. If the activation was outside of the Brodmann areas 9, 44, 45 and 46, it was not tabulated.
Test-retest precision was calculated for the patients who per-formed more than one iteration of the letter word-generation (LWG) task. For this analysis, we set the threshold for the five contiguous coronal sections encompassing the inferior frontal gyrus at P5.001. The number of voxels activated both in the first and second iterations of the task was determined, and these voxels were displayed as the intersect map. The number of pixels in the intersect map was divided by the average num-ber of pixels on each map. This product was defined as the CR (5). The CR was determined for each case and averaged for all cases with two iterations of the task. We also determined the CR for the single section in each case with the greatest amount of activation.
The similarity of activation patterns between different ver-sions of the word-generation task was analyzed in all patients who underwent category word-generation (CWG) and/or an-tonym word-generation (AWG) tasks in addition to LWG tasks. We set a threshold of P5.001 for the functional maps for each task. The intersect map and CR were determined as just described.
Operative records were reviewed to identify patients who also underwent ECS mapping of speech function assessed dur-ing craniotomy while awake. ECS had been performed as de-scribed by Berger and Ojemann (6). Briefly, after craniotomy and opening of the dura, the cortex was stimulated with a bi-polar probe with a 3–5-s train of square-wave pulses (500 ms/ phase at 50 Hz). The intensity of the stimulus gradually was increased by increments of 2 mA (to 14.5 mA) until speech arrest or after-discharges occurred. Both receptive and expres-sive language functions were assessed by evaluating repetition, command following, and confrontation naming. If cortical stimulation led to speech arrest, then the region of the brain was marked as a speech region. The neurosurgeon determined the location of this region at the time of ECS without reference to the fMR images. After mapping, the surface of the brain was photographed to record the positions of the speech areas. The same parcellation techniques used to localize the fMR
imaging activation also were used to describe the sites of func-tion identified intraoperatively. We determined the agreement between the ECS and fMR imaging localizations by comparing the Brodmann areas assigned for each method.
Each patient underwent fMR imaging performed with a 1.5-T commercial imager equipped with high-speed gradients, with techniques previously reported (7). Preliminary anatomic images were obtained with multisection, spin-echo sequences. Single-shot echo-planar images were acquired in the coronal plane every other second for 228 s. Technical parameters for these images included the acquisition of 114 images, 20 section locations, a 64 364 matrix, a flip angle of 858, 2/40 (TR/TE), a field of view of 24 cm, a section thickness of 6 mm with a gap of 1 mm, and a bandwidth662.5 kHz.
For each of the three word-generation tasks, patients were asked to lie motionless in the imager. Each task consisted of five 20-s blocks of task performance interspersed with 20-s rest peri-ods during which patients were instructed to refrain from gener-ating words and from cognitive effort as much as possible. During the task period, the patients were instructed to covertly generate as many words as possible when cued. In the LWG task, the patient was verbally cued with a letter from the alphabet at the beginning of each task period and asked to think of as many words as possible that begin with that letter. The patients were given a different letter for each of the five task periods. The au-ditory cues were presented though earphones by means of an intercom. In the CWG task, a different category was verbally given to the patient at the beginning of each task period, and the patient was instructed to think of words that belonged to that category for 20 s. Categories such as ‘‘animals’’ and ‘‘things found in a house’’ were used. In the AWG task, the patient was shown a series of 10 words (presentation rate, one word every 2 s) in each 20-s task cycle and instructed to think of antonyms for each word. The visual cues were projected onto a screen that the patient viewed through prism mirrors.
For postprocessing of the fMR images, echo-planar raw data were low-pass filtered in the spatial frequency domain by using a Hamming filter (8). The data were then reconstructed into in-dividual section-location time courses. These reconstructed time-course files then were checked for patient head motion and re-aligned by using a 3D spatial-registration algorithm (9). A signal-to-noise threshold was applied to mask background voxels from further analysis. The time course plots from each unmasked echo-planar image voxel were compared with reference functions by using a generalized least-squares-fitting algorithm, fitting the observed data on a voxel-by-voxel basis to sets of user-defined functions. The fitted functions included a constant (baseline signal level), a ramp (to allow for possible linear signal drift), a temporal smoothing filter (to compensate for the differences in image-ac-quisition times within each 2-s TR), and a smoothed boxcar ref-erence function that modeled the presumed stimulus responses.
Results
Findings were reviewed for 34 patients who were
examined between February 1999 and July 2000. For
31 of the 34 patients, we obtained activation maps of
good technical quality with one or more
word-gen-eration tasks. In two of the patients who lacked
good-quality maps, motion had corrupted the data; in the
third, no motion was evident, and poor task
compli-ance was assumed to be responsible for the technical
failure.
FIG1. Sagittal (top right), axial (left), and coronal (bottom right) fMR images in patients performing word-generation tasks.
A, Activation is evident in the pars triangularis and pars opercularis of the left inferior frontal gyrus (Brodmann areas 44 and 45) in a patient performing an LWG task.
B, Activation also is evident in Brodmann areas 44 and 45 in a patient with an arteriovenous malformation in the right hemisphere who is performing an LWG task.
C, Activation appears in Brodmann areas 9 and 46 in a patient with a tumor involving the inferior left frontal lobe who is performing a CWG task.
9 in 44%, or Brodmann area 45 in 39% (Fig 1). In
the 10 patients with activation of both frontal lobes,
the activation was in the left Brodmann area 44 in
60% of patients, left Brodmann area 46 in 50%, left
Brodmann area 45 in 30%, or left Brodmann area 9
in 10%. These same 10 patients also had activation
in right Brodmann area 44 (20% of patients), right
Brodmann area 45 (20%), right Brodmann area 46
(70%), or right Brodmann area 9 (40%). In the three
patients with right hemispheric activation alone, the
activation was in Brodmann area 44 (67% of
pa-tients), Brodmann area 45 (67%), Brodmann area 9
(67%), or Brodmann area 46 (33%) (Table 1) (Fig
2).
Twelve patients underwent two iterations of the
LWG task. The activation from the first and second
iteration of the task was located in the same
Brod-mann areas (Fig 3). The maps for the first and second
iterations of the task were similar (Fig 4). The CR
(ie, the number of voxels shared by the five sections
in the two activation maps divided by the average of
the total number of active voxels in both maps)
ranged from 17% to 57%. The mean CR for the
group was 37% (Table 2). In the patients with the
lowest CRs (17% and 22%), one iteration of the task
appeared to have a high noise level or poor task
per-formance. The CRs of matched individual sections
ranged up to 74%. The mean CR for all patients for
a single section was 49% (Table 3).
In nine patients who underwent CWG and/or
AWG in addition to LWG, activation was in the same
Brodmann locations for each task (Figs 5 and 6).
Four patients underwent both LWG and AWG tasks;
three patients underwent both CWG and LWG tasks;
and two patients underwent LWG, AWG, and CWG
tasks. Six comparisons were made between LWG and
AWG tasks, four were made between CWG and
LWG tasks, and two were made between AWG and
CWG tasks. The CRs for the five-section locations
for the AWG-to-CWG comparisons ranged from
39% to 44% with a mean of 42%. The CRs for the
five sections for CWG-to-LWG comparisons ranged
from 9% to 60%, with a mean of 42%. The CRs for
the five sections for the LWG-to-CWG comparisons
ranged from 33% to 44% with a mean of 37%. The
mean CR for all of the five-section location
compar-isons was 39% (Table 4). For a single section, the
CRs were as high as 65%. The mean CR for the
single sections was 51% (Table 5). In the patient with
the lowest CR (single section CR, 21%), both the
LWG and CWG tasks appeared to have high noise
level or poor task performance.
lan-TABLE 1: Location of activation, threshold for fMR images, word-generation paradigm, and clinical diagnosis in the 31 patients with activation
Patient No.
Area of Activation
Left Right Paradigm Disease
1 2 3 4 5 6 7 8 9 10 44, 46 44, 46 None 44, 46 None 44 9, 45, 46
9, 44, 46 46 9, 44, 45
44, 46 44, 45 None None None None None None None None LWG LWG LWG LWG LWG LWG LWG LWG LWG LWG
L temporoparietal tumor L frontoparietal AVM
L middle cerebral artery malformation L frontal glioma
R frontal tumor, partial motor seizures L frontal anaplastic astrocytoma
L medial frontal, superior-middle temporal diffuse oligodendroglioma
L middle cerebral AVM L temporal oligodendroglioma L parietal AVM
11 12 13 14 15 16 17 18 19 20 44, 45 9, 44 44, 45 44, 45 44 9, 46 None 9, 46 None None None None None 46 45, 46 None 9, 44 None None 9, 44, 45
LWG LWG LWG LWG LWG LWG LWG LWG AWG LWG
R parasylvian AVM L parietal cavernous angioma L basal ganglia tumor
R posterior temporal glioblastoma multiforme L posterior parietal AVM
L temporooccipital AVM L frontal tumor L frontal glioma L basal ganglia tumor L posterior frontal tumor 21 22 23 24 25 26 27 28 29 30 46 44, 45, 46
9 46 9, 44, 46 44, 45, 46 44, 45 45, 46 44, 45 None 9, 46 46, 9 9 None None None None 9 None 46 LWG LWG LWG LWG LWG LWG LWG LWG LWG LWG
R frontal parietal tumor L frontal fibrillary astrocytoma L frontal glioma
L frontal glioma R parasagittal meningioma R frontal glioma R temporal AVM L frontal tumor R frontal parietal AVM L frontal tumor 31 32 33 34 9, 46 44 None 44, 46 None 46 45, 46 None AWG LWG LWG LWG
R parietal tumor
L frontal lobe, low-grade glioma L frontal temporal glioma L frontal tumor
Note.—AVM indicates arteriovenous malformation; L, left; R, right.
FIG2. Sagittal (top right), axial (left), and coronal (bottom right) fMR images in a patient with a large left frontal tumor who is performing an LWG task. Activation is identified primarily in the right inferior frontal gyrus (Brodmann area 45).
guage activation not identified by the ECS. These
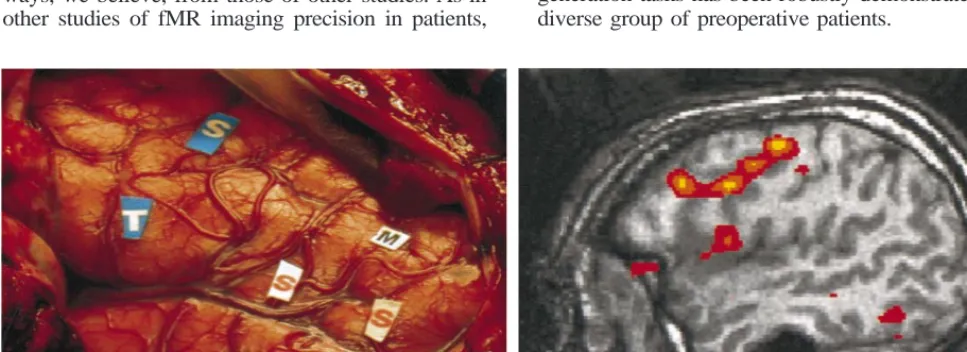
were located in Brodmann area 9 (43% of patients)
and Brodmann area 46 (43% of patients). These areas
had not been studied at ECS because of the limited
surgical exposure.
Discussion
In this study, word-generation tasks activated
Brodmann areas 44, 46, or both in most patients in
the series. Brodmann areas 9 and 45 also were
acti-vated frequently. These areas were actiacti-vated whether
language dominance was left, right, or mixed. Most
areas activated in one iteration or one version of a
task were activated if a second iteration or version
was performed. The language activation was accurate
rate compared with intraoperative mapping in the
seven patients who underwent both fMR imaging and
ECS.
[image:4.612.49.529.85.474.2] [image:4.612.47.278.566.701.2]FIG3. Sagittal (top right), axial (left), and coronal (bottom right) activation images in two iterations of an LWG task.
A and B, Patient with a left frontal tumor. Activation occurs in the same gyri between iterations, although with slightly different patterns.
C and D, Patient with a left frontal tumor and right hemispheric activation.
FIG4. Coronal fMR imaging images of two
iterations of an LWG task in a patient with a left middle cerebral arteriovenous malfor-mation.
A, Activation in the first iteration. B, Activation in the second iteration, show-ing similar activation compared withA.
[image:5.612.53.513.59.427.2]C, Intersect map shows the voxels acti-vated in the two iterations. The proportion of voxels in the intersect map compared with the average number of voxels inA and B (the CR) is 45%.
TABLE 2: CRs for five-section comparisons in patients performing two iterations of an LWG task
Patient No.
CR (%)
6 8 9 13 14 15 17 18 20 21 22 23 Mean
[image:5.612.298.529.471.634.2]37 28 56 34 51 57 25 45 33 17 42 22 37
TABLE 3: CRs for single-section comparisons in patients perform-ing two iterations of an LWG task
Patient No.
CR (%)
6 8 9 13 14 15 17 18 20 21 22 23 Mean
45 45 63 47 59 74 38 60 41 20 50 48 49
that of previous reports. FitzGerald et al (3) reported
that in 85% of comparisons in 11 patients performing
visual verb generation, performing auditory verb
gen-eration, listening to narrated text, listening to words,
or reading words, activation was found to register to
within 1 cm of the site of ECS language function. In
their study, the accuracy for Broca’s area alone was
not tabulated separately from the accuracy for other
regions. In our study, the Brodmann area in which
activation was identified corresponded in each of
sev-en cases to the area in which language function was
found with ECS.
[image:5.612.49.278.472.633.2]FIG 5. Sagittal (top right), axial (left), and coronal (bottom right) projections in a patient with a right frontal tumor.
A, Activation from a CWG task. B, Activation from an LWG task.
FIG6. Coronal images in a patient with a
right frontoparietal arteriovenous malforma-tion.
A, Activation from an AWG task B, Activation from a CWG task. The acti-vation patterns from the two variations of the word-generation task are similar.
[image:6.612.47.276.347.589.2]C, Intersect map shows the voxels acti-vated by both versions of the task. The CR was 52%.
TABLE 4: CRs for five-section comparisons in patients performing two or more versions of the language task
Task Comparison and Patient No.
CR (%)
LWG vs AWG 24
29 32 30 34 33 Mean
44 38 34 33 34 36 37
CWG vs LWG 24
26 33 28 Mean
55 60 42 9 42
AWG vs CWG 24
33 Mean
44 39 42
[image:6.612.299.528.348.589.2]All, mean 39
TABLE 5: CRs for single-section comparisons in patients perform-ing two iterations of the language task
Task Comparison and Patient No.
CR (%)
LWG vs AWG 24
29 32 30 34 33 Mean
55 52 55 48 56 41 51
CWG vs LWG 24
26 33 28 Mean
63 65 46 21 49
AWG vs CWG 24
33 Mean
54 53 54
All, mean 51
test-retest precision, we used the intersect map and
the CR developed by Quigley et al (5). Both
single-and multiple-section comparisons were made. In the
comparison of the fMR imaging activation with
in-traoperative localization of function, we elected not
to register planar fMR images with photos of the
brain surface or to use the navigational workstation,
as others have (3, 10, 11). Photos of the brain surface
with embedded functional information cannot be
pre-cisely coregistered with the planar images at fMR
imaging. The surgeon did not have functional data
TABLE 6: Brodmann area of speech function in patients under-going both ECS and fMR imaging
Patient No.
Brodmann Area at ECS
Brodmann Area at fMR Imaging
1 6 13 18 22 23 24
44 44 44,45
44 45 44, 45
45
44 44 44, 45 44, 46, 9 45, 46, 44 Inferior frontal gyrus, 9
45, 9, 46
FIG7. Comparison of intraoperative localization of speech function (ECS) and activation from the word-generation task (fMR imaging) in a
patient with a left frontal-lobe glioma. Both activation and intraoperative localization of the speech mapping were classified as belonging to Brodmann areas 44 and 45.M indicates motor cortex; S, speech areas; T, tumor.
Brodmann areas was activated may have been
slight-ly overestimated.
Our gross anatomic comparison has advantages
compared with graphic techniques. It is less affected
by geometric distortion, and it overcomes the
diffi-culty in determining criteria for perfect coregistration.
We controlled for reader bias by having different
in-vestigators localize the eloquent cortex with fMR
im-aging and ECS. The likelihood that the surgeon was
biased by the fMR images in identifying the language
area seems small, because exact speech mapping is
crucial for optimizing surgical results. The volume of
a region in which function is identified with ECS is
estimated to be on the order of 1 cm (3).
We found that the single-section test-retest
preci-sion for LWG was 49% and precipreci-sion values were
similar if two versions of the word-generation task
were performed. For motor, sensory, and visual tasks,
precision measurements of 57%, 57%, and 74%,
re-spectively, have been reported with similar
tech-niques (12, 13). Some of the differences between the
precision for language tasks versus visual tasks may
be explained by variation in fMR imaging and
image-processing techniques. However, the fMR imaging
techniques that we used did not differ in important
ways, we believe, from those of other studies. As in
other studies of fMR imaging precision in patients,
we used a threshold that produced equivalent
amounts of activation in each patient, rather than a
fixed threshold, which would have produced
exces-sive interindividual variations in the amount of
acti-vation. Differences in the patient’s performance in the
first and second iterations of the word-generation task
likely explain the lower test-retest precision scores.
We did not attempt to identify areas of language
activation outside the frontal lobe, to use a battery of
language tasks, or to determine hemispheric
domi-nance for language, which was the focus of other
reports (3, 14, 15). Activation has been reported in
Broca’s area, the left middle temporal gyrus, the left
superior temporal gyrus, and Wernicke’s area in
pa-tients performing various language tasks (3). The
fo-cus of this study was the word-generation task and
Broca’s area.
The fraction of patients with mixed and right
hemi-spheric activation was larger than the proportion of
right hemispheric dominance in the normal
popula-tion. We found that 10% of the patients had right
hemispheric activation, and 32% had bilateral
acti-vation. Reasons for such a difference have been
dis-cussed previously (3). The difference between our
patient group and the normal population probably is
attributable to bias in the selection of patients for
clinical referral, brain plasticity induced by nearby
cerebral lesions, or both.
Conclusion
[image:7.612.51.535.532.708.2]References
1. Yetkin FZ, Papke RA, Daniels DL, Mueller WM, Haughton VM. Location of the sensorimotor cortex: functional and conventional MR compared. AJNR Am J Neuroradiol 1995;16:2109–2113 2. Sobel DF, Gallen CC, Schwartz BJ, et al. Locating the central
sul-cus: comparison of MR anatomic and magnetoencephalographic methods. AJNR Am J Neuroradiol 1993;4:915–925
3. FitzGerald DB, Cosgrove GR, Ronner S, et al. Location of language in the cortex: a comparison between functional MR imaging and electrocortical stimulation. AJNR Am J Neuroradiol 1997;19: 1529–1539
4. Talairach J, Tournoux P. Co-planar stereotaxic atlas of the human brain. In: 3-Dimensional Proportional System: An Approach to
Ce-rebral Imaging. New York, NY: Thieme Medical Publishers; 1988
5. Quigley M, Cordes D, Wendt G, et al. Effect of focal and non-focal cerebral lesions on functional connectivity studied with MR. AJNR
Am J Neuroradiol 2001;(in press)
6. Berger MS, Ojemann GA. Techniques of functional localization during removal of tumors involving the cerebral hemispheres. In: Loftus CM, Traynelis VC, eds. Intraoperative Monitoring Techniques
in Neurosurgery. New York, NY: McGraw-Hill; 1994;113–127
7. Lowe MJ, Sorenson JA. Spatially filtering functional magnetic res-onance imaging data. Magn Reson Med 1997;37:723–739
8. Lowe MJ, Russell DP. Treatment of baseline drifts in fMRI time series analysis. J Comput Assist Tomogr 1999;23:463–473 9. Cox. RW AFNI: software for analysis and visualization of
func-tional magnetic resonance neuroimages. Comput Biomed Res 1996; 29:162–173
10. Jack C Jr, Thompson RM, Butts RK, et al. Sensory motor cortex: correlation of presurgical mapping with functional MR imaging and invasive cortical mapping. Radiology 1994;190:85–92 11. Holodny AI, Schulder M, Liu WC, Wolki J, Maldjian JA, Kalnin AJ.
The effect of brain tumors on BOLD functional MR imaging ac-tivation in the adjacent motor cortex: implications for image-guid-ed neurosurgery. AJNR Am J Neuroradiol 2000;21:1415–1422 12. Yetkin FZ, McAuliffe TL, Cox R, Haughton VM. Test-retest
pre-cision of functional MR in sensory and motor task activation.
AJNR Am J Neuroradiol 1996;17:579–584
13. Rombouts SA, Barkhof F, Hoogenraad FG, Sprenger M, Scheltens P. Within-subject reproducibility of visual activation patterns with functional magnetic resonance imaging using multislice echo pla-nar imaging. Magn Reson Imaging 1998;16:105–113
14. Benson RR, FitzGerald DB, LeSeur LL, et al. Language dominance determined by whole brain functional MRI in patients with brain lesions. Neurology 1999;52:798–809