Moshe Graif1 Graeme M. Bydder 1 Robert E. Steiner1 Peter Niendorf David G. T. Thomas3
Ian R. Young4
Received March 6. 1985; accepted after revision June 12,1985.
This work was supported in part by Schering A.G., Berlin (Gd DPTA), and Medical Research Council, Department 01 Health and Social Security. , Department 01 Diagnostic Radiology, Royal Postgraduate Medical School, Hammersmith Hos-pital, Du Cane Rd., London W12 OHS, United King-dom. Address reprint requests to M. Grail, NMR Unit.
2 Schering AG, Berlin, West Germany.
3 Department 01 Neurosurgery, Maida Vale Hos-pital, Maida Vale, London W9, United Kingdom.
• Picker International, Hirst Research Centre, Wembley, Middlesex, United Kingdom.
AJNR 6:855-862, November/December 1985 0195-6108/85/0606-0855
© American Roentgen Ray Society
Contrast-Enhanced MR
Imaging of Malignant Brain
Tumors
855
Magnetic resonance (MR) imaging was performed before and serially after intravenous injection of 1 mmol/kg gadolinium-DTPA (Schering) in 17 patients with clinical and histologic diagnoses of malignant cerebral tumors. There was a decrease of 1% in T1 and 10% in T2 in normal white matter and a decrease of 8% in T1 and 14% in T2 in normal gray matter. Contrast enhancement was observed in 16 of the 17 tumors. In the region of maximal enhancement a mean decrease of 16% in T1 was observed in low-grade gliomas, a mean decrease in T1 of 29% was seen in high-malignancy gliomas, and a mean decrease in T1 of 33% was observed in metastases. The decreases in T1 persisted for at least 50 min. In one case the central cystic region of the tumor displayed a decrease in T1 and T2. Measurements of signal intensity displayed maximal contrast enhancement with an IR 1500/500/44 sequence, much less with SE 1500/44, and least with SE 1500/80. Edema was observed on precontrast images in 14 cases, but satisfac-tory definition of the tumor-edema margin was only possible in four cases. After contrast enhancement this margin was defined in 10 cases. In four of the 17 cases areas of apparent "edema" seen before administration of Gd-DTPA displayed significant contrast enhancement and probably represented tumor infiltration. Comparison with CT showed a greater degree of contrast enhancement on MR images in eight cases, an equal degree in eight cases, and greater enhancement on CT in one case. Definition of the tumor-edema interface was better with MR in six cases and equal to CT in four cases. No significant toxic effects were found with the contrast agent. Gd-DTPA provided significant additional information over unenhanced MR imaging and enhanced CT.
The value of contrast enhancement was recognized soon after the introduction of cranial CT [1, 2]. The situation with magnetic resonance (MR) imaging is more
complex. A greater level of soft-tissue contrast is available without contrast enhancement, and, unlike CT, no contrast agents suitable for parenteral use were available when the technique was first introduced. Nevertheless, particular situa-tions have been defined, such as differentiation between tumor and edema, where contrast enhancement might be useful [3, 4], and recently the paramagnetic contrast agent gadolinium-DTPA has been tested in animals [5, 6] and used in clinical pilot studies [7-9]. In this report we extend our earlier clinical studies by
examining the time course of enhancement produced by Gd-DTPA, comparing the degree of enhancement seen with different pulse sequences, monitoring side
effects, and assessing the overall clinical efficacy relative to CT.
Subjects and Methods
Permission for the study was obtained from the Royal Postgraduate Medical School Research Ethics Committee, and permission for the use of Gd-DTPA was obtained from the Department of Health and Social Security, medicine division. Informed consent was obtained from each patient.
TABLE 1: Clinical Diagnoses in Patients Studied with Contrast-Enhanced MR Imaging
Category of Lesion: Ctinical Diagnosis
Low-grade primary lesions: Glioma I.
Astrocytoma I and II .. . . . . . . . . . . . . .. Oligodendroglioma
High-grade primary lesions: Astrocytoma III
Glioblastoma . . . .
Malignant ependymoma. .. ... ..
Metastatic lesions:
Small cell carcinoma of lung. . ... .
Oat cell carcinoma of lung ... . Carcinoma of lung.
Adenocarcinoma of unknown origin ... .
Suspected primary tumor (no histology) Total ..
No. of Patients
3 3 1 2 1 1 1 1 1 1 1 --:;-'7
TABLE 2: Pulse Sequences Used in Contrast-Enhanced MR Imaging of Malignant Brain Tumors
Pulse Sequence
IR 1500/500/44 SE 1500/44 SE 1500/80 .
TR
1500 1500 1500
Interval (msec)
TI 500 TE 44 44 80
Note.-TR = repetition time; TI = inversion time; TE = echo time; IR = inversion recovery; SE = spin echo.
lesion in the brain (amelanotic melanoma in one case and adenocar-cinoma of unknown origin in the other). Two other patients had histologically proven lung carcinomas with multiple brain lesions consistent with metastatic spread, although the cerebral lesions were not biopsied. The diagnoses are summarized in table 1.
The MR imager used for this study has been described [10]. It operates at 0.15 T, and in this study one inversion-recovery (IR) sequence and two spin-echo (SE) sequences were used (table 2). Preenhancement scans were obtained using these three sequences, which were repeated serially after injection of Gd-DTPA. The time of injection and that of subsequent scans were recorded.
Gd-DTPA was injected in a dose of 0.1 mmol/kg after determination of baseline values of blood urea, creatinine, electrolytes (Na+, K+, HC03 -), liver function tests (bilirubin, aspartate transaminase, alkaline phosphatase, total protein), serum iron, blood screen (hemoglobin, red blood cell count, platelets), and coagulation studies. The same tests were repeated 2 and 24 hr after injection of Gd-DTPA.
Signal intensity measurements were obtained directly from the images. Computed T1 and T2 maps were produced by numeric solutions of the equations published elsewhere [10] using the three sequences listed in table 2. Regions of interest (ROls) were obtained for normal white and gray matter as well as the region of maximal enhancement of the tumor and the central region of the tumor. ROls were also placed in regions of apparent edema surrounding the tumor. Four measurements were taken in each case, and the mean was used in these studies. The mean time for T1 determination was 17 min for the first cycle and 45 min for the second one. Determination of T2 values were obtained at 37 and 60 min after injection. Since the T2 maps reflecting the T2 values were calculated from two different T2 images of the same slice with the same TR, there was a
1 00
l--;:;;;:;;:;;::~:::::;:-::;:_;
_~_=_
=
_=
..
=_:::~:::=;=~
= :: : :: :
~
010 75
Ul
w
"
co 50
> N
f-T1
"tJ 25
T2 c
co
f-20 40 60 80
Time after injection of gadolinium OTPA (min)
W
=
white matter G = g,-ay matterFig. 1.-Mean change in relaxation times of normal gray and white matter after injection of Gd-DTPA.
100
75
010 en
Q)
"
50 Iii> N
f-"tJ 25 Tl
c co
T2
f-20 40 60
Time after injection of gadolinium OTPA (min J
Fig. 2.-Mean percentage change of T1 and T2 in region of maximal contrast enhancement of malignant tumors after injection of Gd-DPTA.
time lapse between the images related to the acquisition times. The times for the T2 values, therefore, were the mean time of the different images. In the sequence comparison table each sequence was rep -resented individually with the respective time determination.
CT studies before and after enhancement were available within days of the MR scan in all cases. CT scans were obtained with a Siemens Somatom II scanner (six cases), GE 8800 scanner (four cases), and an EMI CT 1010 scanner (seven cases).
Results
Normal Brain
Contrast enhancement was apparent as a slight reduction in gray/white-matter difference after injection of Gd-DTPA. White matter displayed a mean reduction in T1 of 1 %, while gray matter showed a mean reduction of 8% in T1. The
corresponding decrease of T2 was 10% in white matter and
[image:2.612.321.556.77.255.2] [image:2.612.56.299.107.261.2] [image:2.612.322.531.312.471.2]AJNR:6. Nov/Dec 1985 CONTRAST-ENHANCED MR OF MALIGNANT BRAIN TUMORS
857
Fig. 3.-Astrocytoma grade III. Precontrast IR
(A) and T1 (8) images compared with postcontrast IR (C) and Tl (0) images. Reduction in Tl within
cystic component is clearly visible on Tl maps after enhancement (0). For comparison. no change was
observed in cerebrospinal fluid.
A
c
relaxation times is shown in figure 1. Enhancement was also observed in arteries, veins, and sinuses.
Cerebral Tumors
Contrast enhancement was observed in 16 of 17 cases; the pattern of enhancement was ring-shaped in nine cases, diffuse in seven, patchy in four, and linear in one.
Measurements in the region of maximal contrast enhance-ment displayed on the last set of scans in each case showed a mean decrease of 22% in T1 and a mean decrease of 21 %
in T2. The decrease in T1 and T2 increased with time. The time course of this enhancement is displayed in figure 2.
Measurements of T1 and T2 in the central region of the tumor showed no significant change in eight cases, but in nine cases there was a significant reduction. This included
B
o
100
. •...........• 75
50
-.
010
til
LMG OJ
25
:J
co _ HMG
> ___ mets
I-20 40 60
Time aftel- injection of gadolinium DTPA (min'
[image:3.612.224.558.85.521.2]120
100
80
.~ IR
Vl 60
c
?;
2
c 40 Vl
c
"iii 2
c 20 E
.~ SE 44
V1 "iii
a c
.~
-20 V1
20 40 60 80
120 100 80 60 40 20 a -20
20 40 60
?;
Vl
C 250
200
150
~ 100
c
ro
C .~ 50
V1
a
IR
SE 44
SE 80
-20-"---,- -- , - - - - . ---,
20 40 60 80
Time after injection gadolinium DTPA (min I Time afte.' injection gadolinium Time after injection gadolinium DTPA (mini
A
B
Fig. 5. -Comparison of signal IR 1500/500/44 (IR). SE 1500/44 (SE 44). and SE 1500/80 (SE 80) pulse sequences before and after Gd-DTPA. Baseline level (0) represents preen han cement scan; numbers along vertical axis repre-sent arbitrary signal intensity units. Comparison was carried out for low-grade
one case in which the central region of the tumor was found
to be cystic at surgery (fig. 3).
The time course of enhancement was compared for the
three groups of tumors listed in table 1 and is displayed in figures 4 and 5. The primary tumors of low-grade malignancy showed a mean decrease in T1 of 16%, the primary tumors of high-grade malignancy displayed a mean decrease in T1 of
29%, and the metastatic tumors displayed a mean decrease in T1 of 33% (fig. 4).
The changes in signal intensity in the three different se-quences in the area of maximal enhancement were compared (fig. 5). The greatest increase in signal intensity was seen
with the IR 1500/500/44 sequence, the next greatest with SE 1500/44, and least enhancement was seen with SE 1500/
80 (fig. 6).
Maximal enhancement was displayed 20-40 min after in-jection for the low-malignancy tumors, after which the signal
intensity decreased. In the other two groups (of higher
malig-nancy grade), maximal enhancement was displayed between
40 and 60 min. In all groups the decrease of signal occurred
earlier in time for the SE sequences than for the IR sequences
(fig. 5).
Peritumoral Edema
Areas with appearances consistent with peritumoral edema were seen on the preenhancement scans in 14 cases. These
were best seen on the IR 1500/500/44 sequence in eight
cases, on the SE 1500/44 in one case, and on the SE 1500/ 80 in five cases. Radiologic separation of tumor from edema was possible in four cases.
After intravenous Gd-DTPA, 10 of the patients showed no
DTPA (mini
c
malignancies (A). high-grade malignancies (B). and metastatic lesions (C).
Maximal enhancement is seen with IR 1500/500/44 sequence. "Negative enhancement" is obtained with SE 1500/80 sequence after 60 min (A); actual pixel value is lower than original value on preenhancement scan by 13 units.
change in relaxation time in the area of edema (fig. 7), but in four cases a 22%-31 % decrease in T1 and T2 was seen (figs. 8 and 9).
The increase in signal intensity was obvious on the IR 1500/500/44 scans, but the SE 1500/44 and SE 1500/80 scans did not show significant change in signal intensity. It
was thought likely that the areas of apparent edema in these four cases probably represented tumor infiltration.
Comparison with CT
Comparison with CT was limited by the fact that seven of the CT scans were obtained with a second-generation scan-ner (EMI CT 1010). On overall subjective assessment the degree of enhancement was greater with MR in eight cases and equal to CT in eight cases. In one case (tiny metastatic lesions of small-cell lung cancer), the lesions enhanced better on the CT scan. Separation of tumor from edema was better with MR in six cases, equal in four cases, and better with CT in no cases. The four regions of apparent edema subsequently
thought to be infiltrating tumor with MRI did not display contrast enhancement with CT. Additional metastases were seen with MR in one of the cases of metastatic tumor.
Side Effects
One patient noted a transient metallic taste and another
felt faint immediately after injection of Gd-DTPA. These
symp-toms lasted about 1-2 min. No significant change was noted in any of the biochemical or hematologic parameters, except
[image:4.612.59.559.75.297.2]AJNR:6. Nov/Dec 1985 CONTRAST-ENHANCED MR OF MALIGNANT BRAIN TUMORS 859
o
E
F
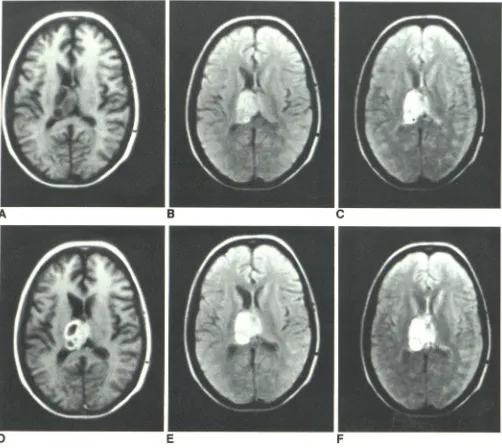
Fig. 6.-Grade III astrocytoma. Pre- (A-C) and post- (O-F) enhancement IR 1500/500/44 (A and 0). SE 1500/44 (8 and E). and SE 1500/80 (C and F) images. Maximal enhancement is seen between A and O.
two patients. The serum iron returned to normal in both patients within 24 hr.
Discussion
. Gd-DTPA is-an etfeeti.e eORtrast agent producing consist-ent reduction in tumor Tl and T2 It is distributed within the vascular compartment and excreted unchanged by glomerular filtration through the kidneys with 80% eliminated within 3 hr. More detail about its pharmacology has been published [5, 6, 8).
The high molecular weight of Gd-DTPA (590) is similar to that of diatrizoate, commonly used with CT, and its marked hydrophilic properties probably account for the fact that it
does not ap ear to cross the normal blood-brain barrier. In t e presence of pathology, Gd-DTPA appears
abnorma 00 - rain arrier
scn ed for iodinated contrast agents [5]
-==
I he contrast enhancement continued for up to 60 min. This can also occur with CT, where prolonged enhancement of brain lesions has been described in conditions in which blood-brain barrier breakdown was associated with extravasculari-zation of iodinated contrast material into the lesion [11]. [image:5.612.57.559.83.531.2]A
B
o
G
H
c
F
Fig. 7.-Transverse images of metastatic carci
-noma. Separation of tumor from edema in preen
-hancement CT scan (A) and IR 1500/500/44 (8),
AJNR:6. Nov/Dec 1985 CONTRAST-ENHANCED MR OF MALIGNANT BRAIN TUMORS 861
Fig. 8.-Preenhancement CT image (A) of lesion
secondary to lung carcinoma. IR scan (B) shows more extensive abnormality (arrows). suggestive of edema. After enhancement. no change is observed
in this area (except ring enhancement) on CT (C).
while enhancement causing isointensity is clearly visible on MR (0).
100
75
010 50
Vl QJ ~ ro 25
>
I-'~'':''.:'''''.''''''''''''''''''''''.
---true edema
AME
pseudoedema
20 40
A
c
60
Time after injection of gadolinium DTPA (min)
A
Fig. g.-Graphic representation of T1 (A) and T2 (B) changes after injection of contrast material. Minimal or no change was observed in true edematous area. significant decrease of T1 and T2 values was seen in pseudoedematous
100
75
50
01° Vl QJ
~ 25
ro
>
N
I-8
8
o
true edema
AME
pseudoedema
20 40 60
Time after injection gadolinium DTPA (min'
80
region. almost to same degree as in area of maximal enhancement (AME) of
lesion. (AME and edema T1 and T2 values reflect only the four cases in which
diffused into this compartment, as happens with CT [15].
Sequence comparison showed that the IR 1500/500/44
was significantly better than the two SE sequences in
dem-onstrating contrast enhancement. While long TR/long TE SE
sequences are sensitive to pathologic differences, they are
relatively insensitive to contrast enhancement. If a tumor is detected with this latter type of sequence, minimal additional
information is likely to be obtained by repeating the same
sequence alone after intravenous Gd-DTPA.
Another important feature is that signal intensity (fig. 5)
initially increases and later decreases while the concentration
of Gd-DTPA (as expressed by the reduction of relaxation
times) is still increasing (fig. 4). The peak and the following decrease in signal intensity is reached at a lower level with
the two SE sequences than with the IR sequence. Our
experimental results are consistent with the theoretic results
described by Gadian et al. [16], indicating that for low
con-centrations of Gd-DTPA (below 1 mmol), the shortening of T1
gives a signal increase that eventually is negated by the reduction in T2 at high concentrations. The optimal concen-tration for the SE sequences used was achieved at 20-60 min. The IR sequence, having greater T1 dependence, results in continuing higher signal intensity with the increase of con-trast concentration. Since the time course for the IR sequence in our clinical study lasted on average less than 50 min, its optimal time of examination was not determined.
The results in peritumoral edema are of particular interest. Definition of the margin between tumor and edema was better after contrast enhancement. In general edema did not en-hance, as found in a canine model studied by Brasch et al.
[6]. The enhancement seen in areas thought to be edema in
four cases probably indicates areas of tumor infiltration. Comparison with CT has to be treated with caution because
seven of the 17 cases were examined with a
second-gener-ation scanner rather than a third- or fourth-genersecond-gener-ation one. Nevertheless, equal or greater enhancement was seen with MR in all cases; better definition of the margin between tumor
and edema was also observed, and the four areas of "edema"
enhancement (probably representing tumor) were not
de-tected with CT.
In conclusion, Gd-DTPA is an effective contrast agent, and
enhancement persists for at least 50-80 min. The IR
se-quence is most sensitive to contrast enhancement, with SE sequences much less sensitive. The results compare favora-bly with CT, and the principal clinical application appears to
be the identification of areas of tumor and edema. Toxicity
appears low.
REFERENCES
1. Ambrose J. Computerized transverse axial scanning (tomogra-phy). Part 2: clinical application. Br J Radio/1973;46: 1 023-1047
2. Ambrose J. Sodium iothalamate as an aid to diagnosis of
intra-cranial lesions by computerized transverse axial scanning. Lancet
1975;2:669-674
3. Bydder GM, Steiner RE, Young IR, et al. Clinical NMR imaging of the brain: 140 cases. AJNR 1982;3:459-480, AJR
1982;139:215-236
4. Bydder GM, Pennock JM, Steiner RE, Orr JS, Bailes DR, Young
IR. The NMR diagnosis of cerebral tumors. J Magnetic Reso-nance Med 1984;1 :5-29
5. Weinmann H-J, Brasch RC, Press WR, Wesbey GE. Character-istics of gadolinium-DTPA complex: a potential NMR contrast agent. AJR 1984;142:619-624
6. Brasch RC, Weinmann H-J, Wesbey GE. Contrast enhanced NMR imaging: animal studies using gadolinium-DTPA complex.
AJR 1984;142:625-630
7. Carr DH, Brown J, Bydder GM, et al. Intravenous chelated gadolinium as a contrast agent in NMR imaging of brain cerebral tumours. Lancet 1984;1 :484-486
8. Schonner VW, Felix R, Laniado M, et al. Prung des Kernspinto-mographischen Kontrastmittleas Gadolinium-DTPA am Menchen. ROFO 1984;140:495-500
9. Carr DH, Brown J, Bydder GM, et al. Gadolinium-DTPA as a
contrast agent in MRI: initial clinical experience in 20 patients.
AJR 1984;143:215-224
10. Young IR, Bailes DR, Burl M, et al. Initial clinical evaluation of an NMR tomograph. J Comput Assist Tomogr 1982;5:1-18
11. Kramer RA, Janetos GP, Perlstein G. An approach to contrast enhancement in computed tomography of the brain. Radiology
1975;117:589-593
12. Sage MR. Review. Blood-brain barrier: phenomenon of increas-ing importance to the imagincreas-ing clinician. AJNR 1982;3: 127 -138,
AJR 1982;138: 887 -898
13. Caille JM, Guibert-Tranier F, Calabet A, Billerey J, Piton J. Abnormal enhancement after contrast injection. In: Caille JM,
Salamon G, eds. Computerized tomography. Berlin: Springer, 1980: 166-171
14. Gado MH, Phelps ME, Coleman ER. An extravascular compo-nent of contrast enhancement in cranial computed tomography.
Radiology 1975; 117: 589-593
15. du Boulay GH, Isherwood I, Kendall B, Moseley I. Computerized tomography of the head. In: du Boulay GH, ed. Textbook of radiological diagnosis, vol 1. London: Lewis, 1984:98
16. Gadian DG, Payne JA, Bryant DJ, Young IR, Carr DH, Bydder GM. Gadolinium-DTPA as a contrast agent in MRI-theoretical projections and practical observations. J Comput Assist Tomogr