Sclerosis: Correlative Findings of Active versus Irreversible Plaque
Disease
Hirohiko Kimura, Robert I. Grossman, Robert E. Lenkinski, and Francisco Gonzalez-Scarano
PURPOSE: To characterize plaques of multiple sclerosis (MS) using both proton MR spectroscopy and magnetization transfer (MT) imaging. METHODS: The magnetization transfer ratio (MTR) was calculated from two series of three-dimensional gradient-recalled acquisition in the steady state (GRASS) images obtained with and without an MT saturation pulse. Proton spectra were acquired using the point-resolved spectroscopy (PRESS) sequence with a voxel size of 1.531.531.5 cm3. A total of 28 spectra were obtained in 13 patients who had clinically definitive MS. The spectra were analyzed together with the MTR. RESULTS: A positive relationship was found between theN -acetylaspartate (NAA)/creatine (Cr) ratio and the MTR in MS plaques, whereas no significant correlation was found between the metabolite ratios and the signal intensity on fast spin-echo T2-weighted MR images. CONCLUSION: Small changes in the MTR of MS plaques relative to the MTR of normal white matter may reflect inflammatory changes and edema, whereas larger changes in MTR correlate with decreased NAA/Cr ratio and therefore suggest demyelination and irreversible damage from chronic MS plaques.
Index terms: Magnetic resonance, magnetization transfer; Magnetic resonance, spectroscopy; Sclerosis, multiple
AJNR Am J Neuroradiol17:1539 –1547, September 1996
Multiple sclerosis (MS) is a relapsing-remit-ting disease in the central nervous system that forms plaques in various stages of the demyeli-nating process. Magnetic resonance (MR) im-aging has been used extensively as one of the
diagnostic procedures to demonstrate MS
plaques. Although MR imaging has excellent sensitivity in detecting the lesions, it still lacks the specificity for characterizing the precise stage of the demyelinating process.
Magnetization transfer (MT) imaging is a rel-atively new technique that modifies the image contrast by means of selective saturation of
re-stricted protons in macromolecules and associ-ated water protons (1, 2). In previous studies, the measurement of magnetization transfer ra-tio (MTR) has proved useful for the differentia-tion of primarily demyelinating lesions from those that are mainly edematous in MS plaques (3). MT imaging also has the advantage of be-ing able to detect wallerian degeneration in vi-sual pathways (4). It is clear that the MTR re-flects changes in the amount and type of
macromolecules present in white matter.
Therefore, MT imaging may provide a method for the assessment of myelin integrity.
Like MR imaging, proton MR spectroscopy has shown potential in diagnosing MS and in monitoring the progression of treatment (5). In addition, it provides further characterization of MS plaques that is based on the biochemical composition of the plaque volume. Proton MR spectroscopy along with MR imaging may be helpful for differentiating those early lesions from late irreversible gliotic lesions (6). Be-causeN-acetylaspartate (NAA) is thought to be specifically located in neurons in gray matter Received July 12, 1995; accepted after revision February 26, 1996.
Supported in part by grant NS 29029 (to R.I.G.) from the National Institutes of Health.
From the Departments of Radiology (H.K., R.I.G., R.E.L.) and Neurol-ogy (F.G-S.), Hospital of the University of Pennsylvania, Philadelphia; and the Department of Radiology, Fukui (Japan) Medical School (H.K.).
Address reprint requests to Robert I. Grossman, MD, Department of Radiology, Hospital of the University of Pennsylvania, 3400 Spruce St, Philadelphia, PA 19104.
AJNR 17:1539–1547, Sep 1996 0195-6108/96/1708 –1539
qAmerican Society of Neuroradiology
and in axonal processes in white matter (7, 8), there is an emerging consensus that the level of NAA detected with proton MR spectroscopy is an index of neuronal viability in brain tissue.
We hypothesized that the combined use of MT imaging and MR spectroscopy may provide information about the relationship between my-elin damage and the metabolite changes de-tected by proton MR spectroscopy and thus pro-vide a means for staging plaques. To test this thesis, we measured both the MTR and the NAA/creatine (Cr) ratio from the same brain region in order to determine whether myelin damage detected with MT imaging correlates with neuronal loss detected with MR spectros-copy.
Subjects and Methods
Thirteen patients (nine women and four men, 23 to 50 years old) with clinically definitive MS were studied with both MT imaging and MR spectroscopy. The known dura-tion of the disease varied from 2 to 21 years. All the MT imaging and MR spectroscopy studies were performed after informed consent was obtained from patients. Twenty studies were obtained from the 13 patients. Seven patients had follow-up examinations 5 to 7 months after the first examination. In all seven of these patients the location of MR spectroscopy voxels was different on the original and the follow-up examinations. Two separate locations were assessed in eight of 20 examinations, and, in total, 28 proton spectra were analyzed along with the MTR mea-surements. The analysis and the selection of the regions of interest (ROIs) were done by the same observer.
Twelve healthy control subjects (27 to 43 years old) were examined with MR spectroscopy and six control sub-jects (28 to 45 years old) were examined with MT imaging. In the MR spectroscopy group, one location was studied for each subject; in the MT imaging group, two locations were studied for each of the six subjects.
All MT imaging and MR spectroscopy studies were per-formed on a 1.5-T MR imager. The MR imaging protocol consisted of sagittal T1-weighted 600/17/1 (repetition time/echo time/excitations) sequences with a 5-mm sec-tion thickness and a 2563192 matrix; axial fast spin-echo T2-weighted 2700/17,85/1 sequences with a 3-mm sec-tion thickness and a 2563 192 matrix; and axial three-dimensional gradient-recalled acquisition in the steady state (GRASS) images, 106/5/1, with a 5-mm section thickness, a 2563128328 matrix, and a 128flip angle. The last images were obtained with and without an MT saturation pulse during the same series, holding all pres-can parameters constant. MT saturation was achieved by a prolonged, off-resonance, preexcitation radio frequency pulse (19-millisecond single-cycle sinc-shaped, 2 KHz off-resonance from water, averaged B1intensity 3.673102
6
T) (9). The formula used for the calculation of MTR was as
follows: (MT02MTsat)/MT03100%, where MT0is signal intensity before the MT pulse has been applied, and MTsat is signal intensity after the MT pulse has been applied. MTR map images were constructed from the two sets of 3-D GRASS images with and without an MT saturation pulse. Image data were transferred to a workstation for compu-tation of pixel-by-pixel MTR maps. Misregistration be-tween the two series of images was corrected by shifting appropriate numbers of pixels in each image on the com-puter screen interactively, as necessary. The mean value of the MTR was obtained simply by averaging pixel values in the ROI on the MTR map. To demonstrate the distribu-tion of abnormal MTR pixels on the MTR map, we calcu-lated subtraction MTR images, on which the pixels with lower MTR values were replaced with the value of 0, so that abnormal pixels could be seen as areas of signal void.
Water-suppressed localized proton MR spectroscopy studies were acquired by using the PRESS sequence with a solvent suppression scheme in the preparation period. Water suppression was achieved by three repeated chem-ical selective saturation pulses (50-Hz bandwidth), each followed by a dephasing gradient. A spectrum was ob-tained from the voxel of 1.53 1.5 3 1.5 cm3 using the following parameters: 2000/25/256, 1250-Hz sweep width, 2048 data points, and an eight-step phase cycle. Postacquisitional water suppression was performed by subtracting the low-frequency component from the origi-nal free-induction decay in the time domain data, if needed, to avoid baseline elevation toward the residual water peak (10). Data processing included zero filling to 4K data points, 1-Hz exponential line broadening, Fourier transformation, and zero-order phase correction. Peak ar-eas were determined by Lorentian curve fitting.
images, because this level can be confidently recognized as high-signal-intensity lesions on visual inspection of T2-weighted images. Using this plaque intensity threshold, we calculated the percentage of volume of MS plaques rela-tive to the whole MR spectroscopy voxel: (the number of pixels with higher than normalized 55% value)/(the total number of pixels in the MR spectroscopy voxel) 3 100. This value was used as validation that MS plaques occu-pied a large enough volume to compare metabolite ratios obtained from a given MR spectroscopy voxel.
To categorize lesions with the same type of disease, we classified lesions into three groups depending on their appearance on T2-weighted images at the site of the MR spectroscopy voxel: group 1 was normal-appearing white matter (n55); group 2, diffuse hyperintense lesions (n5 4); and group 3, focal lesions of high intensity (n519). Normal-appearing white matter was defined as white mat-ter without abnormal high signal in MR spectroscopy vox-els on T2-weighted images; diffuse hyperintensity lesions were those that showed diffuse high signal extending throughout the MR spectroscopy voxel; and focal lesions of high intensity were patchy plaquelike foci of high signal intensity confined inside the MR spectroscopy voxel. The metabolite ratios and the MTR in each group were com-pared with those obtained from the MR spectroscopy and MT imaging control groups using an unpaired ttest. For the linear correlative analysis between the NAA/Cr and the MTR in the group of focal lesions of high intensity, we excluded five small MS plaques that occupied a limited volume in the MR spectroscopy voxel (fewer than 50% of pixels) to minimize partial volume effects from surround-ing normal-appearsurround-ing white matter. In total, 14 spectra along with the value of the MTR were analyzed in the test of linear regression parameters. The corresponding signal intensity on T2-weighted images was also correlated with the ratio of NAA/Cr.
Results
Control White Matter
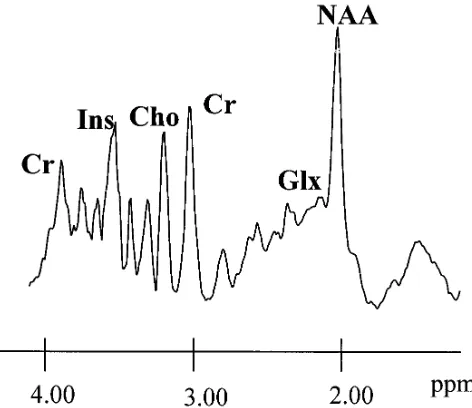
A proton spectrum of white matter of a healthy volunteer (a 31-year-old man) is shown in Figure 1 for comparison. Resonances in pro-ton spectra of brain tissue are assigned to NAA (methyl singlet at 2.01 ppm); coupled multip-lets of glutamate and glutamine (Glx, at 2.1 to 2.4 ppm); creatine and phosphocreatine (Cr, at
3.02 ppm); choline-containing compounds
(Cho, at 3.20 ppm); and myo-inositol (Ins, at 3.56 ppm). The results of quantitative analysis of proton spectra from healthy control subjects are summarized in Table 1 as metabolite area ratios. Figure 2 shows the control T2-weighted images at the level of the lateral ventricle and the MTR map images of the same brain sec-tions.
Normal-Appearing White Matter
The metabolite ratios obtained by MR spec-troscopy revealed no significant difference from those of healthy control subjects (Table 1). Al-though the average value of the MTR in the MR spectroscopy voxel showed no significant dif-ference from that of the control value, the num-ber of pixels with a decreased MTR was slightly increased (Table 2). In fact, the pixels with de-creased MTR values appeared to be scattered more frequently throughout the white matter on the MTR maps of one patient in this group (Fig 3).
Diffuse High-Signal-Intensity Lesions
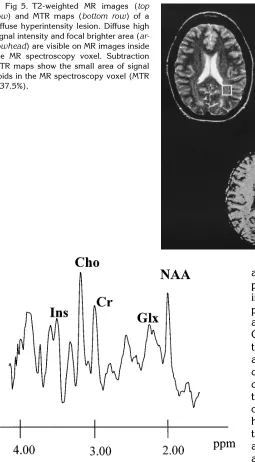
[image:3.612.309.545.90.294.2]corresponding region (Fig 5, bottom row). The metabolite pattern in this group showed high Cho/Cr ratios compared with control values us-ing an unpaired t test (P ,.05). There was no statistical difference between the NAA/Cr ratio and that of the control group (Table 1). The relative volumes with decreased MTR showed a slight but statistically significant increase (P ,
.05), whereas the signal intensity on T2-weighted images was significantly increased (P
, .0005) compared with that of control sub-jects.
Focal Lesions of High Intensity
Figure 6 shows typical proton spectra from an MS plaque in temporoparietal white matter in
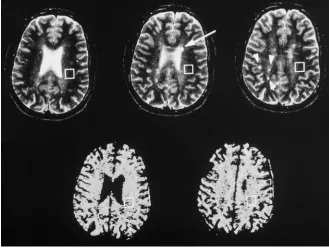
[image:4.612.44.543.102.196.2]a 36-year-old man. Decreased levels of NAA and relatively high levels of Cho are seen. No resonances from lactate or mobile lipids were seen in this lesion (lactate doublets, 1.32 ppm with 7-Hz splitting; broad lipid peaks, 1.2 to 1.3 and 0.8 to 0.9 ppm). High signal intensity scat-tered throughout the periventricular white mat-ter on T2-weighted images was observed (Fig 7, top row), and abnormal pixels occupied almost all parts of the MR spectroscopy voxel on the MTR maps (Fig 7, bottom row). Both the NAA/Cr and NAA/Cho ratios were significantly decreased in these lesions compared with con-trol ratios; however, the Cho/Cr peak did not differ statistically from that of control subjects, although an increasing trend was observed in some patients (Table 2). Measurements of MTR Fig 2. Fast spin-echo T2-weighted
(2000/80) MR images (top row) and sub-traction MTR maps (.37.5%) (bottom row) of normal control white matter sec-tioned nominally at the same brain level. No abnormal white matter signal is seen on the MR images, and only several signal voids can be observed in the white matter on the MTR maps.
TABLE 1: In vivo metabolite ratios in patients with multiple sclerosis and healthy control subjects
NAA/Cr Cho/Cr NAA/Cho
Control white matter (n512) 1.6760.24 0.9660.17 1.7760.33 Normal-appearing white matter (n55) 1.4660.27 0.8260.06 1.8160.46
(NS) (NS) (NS)
Diffuse hyperintensity lesions (n54) 1.5860.41 1.2360.28 1.3560.46
(NS) (NS) (NS)
Focal lesions of high intensity (n519) 1.2860.33 1.0760.23 1.2660.42 (P,.05) (NS) (P,.05)
[image:4.612.211.544.245.509.2]in MR spectroscopy voxels revealed an appar-ent decrease of MTR values. The large fraction of pixels inside the MR spectroscopy voxel had a value of less than 35% (Table 2). The central part of the MS plaques showed lower MTR val-ues than those obtained from whole MRS voxels (31.5% 6 3.6%; see Table 2). Figure 8 shows the scatter plots of NAA/Cr ratios against the MTR or T2 intensity obtained from MS plaques. A positive linear relationship was found between the MTR and the averaged NAA/Cr ratio in the white matter– containing MS plaques. A positive linear relationship was also observed between the NAA/Cr ratio and the MTR values from the central part of the plaques (r5.55,P,.05). No significant correlation was found between the
Fig 3. Fast spin-echo T2-weighted (2000/80) MR images (top row) and subtraction MTR maps (.37.5%) ( bot-tom row) of normal-appearing white matter sectioned nominally at the same brain level. Small MS plaques can be seen as bright signal areas in the right parietooccipital region (arrowheads) and adjacent to the anterior aspect of the left lateral ventricle (arrow) on the MR images. No definitive abnormal signal in-tensity is seen in the MR spectroscopy voxels in the white matter of T2-weighted images. Scattered areas of signal voids can be seen in the white matter on the MTR maps more frequently than the ap-parent bright plaques on the MR images. Blackwithin the MR spectroscopy voxel denotes that the pixel value of the MTR was less than 37.5%.
[image:5.612.43.372.283.534.2]Fig 4. A proton MR spectrum (25/2000) obtained from the white matter of a 34-year-old patient with MS. A 15 3 15 3 15-mm3(3.4-mL) volume of interest was located in the left tem-porooccipital white matter of brain (see Fig 6). The high Cho peak is characteristic of the spectra from this group of patients. (See legend to Figure 1 for definition of abbreviations.)
TABLE 2: Magnetization transfer ratio (MTR) and signal intensity on T2-weighted MR images
Averaged MTR in MR Spectroscopy
Voxels*
Percentage of Pixels with MTR Less Than
37.5†
Percentage of Pixels with MTR Less Than
35.0†
Signal Intensity on T2-Weighted
Images‡
Control white matter (n512) 41.961.1 465 161 44.061.8 Normal-appearing white
matter (n55)
40.961.0 1061 261 44.562.6
(NS) (P,.05) (P,.05) (NS)
Diffuse hyperintensity lesions (n54)
40.860.6 1166 362 52.161.4 (NS) (P,.05) (P,.005) (P,.0005) Focal lesions of high intensity
(n519)
35.763.0 43626 30625 61.367.9 (P,.0005) (P,.0005) (P,.0005) (P,.0005)
Note.—All values are expressed as mean6SD; statistical significance was determined with unpaired Student’sttest between control white matter values and each group of multiple sclerosis. NS indicates not significant.
* Including multiple sclerosis plaques. † In MRS voxels.
[image:5.612.317.528.533.674.2]metabolite ratios and the signal intensity on T2-weighted images (Fig 9).
Discussion
In MS, the most specific and characteristic change is demyelination. However, it is likely that each plaque consists of different and het-erogeneous stages in this process. Thus,
char-acterizing individual MS lesions is of critical im-portance not only in understanding MS but also in planning treatment. Some MS lesions are purely edematous or inflammatory in nature and should respond to steroid therapy (11). Other chronic lesions that are replaced by as-trocytic gliosis most likely will not respond to any current medical treatment. Therefore, the differentiation of edematous lesions from highly demyelinated or gliotic lesions would be impor-tant to both patients and their physicians. Many of the spectroscopic studies performed in MS have addressed this point. The hypothesis is that metabolite ratios are unchanged in hyper-acute (edema only) plaques. Demyelination in acute plaques is accompanied by an increased Cho/Cr ratio (12, 13). Irreversible plaques in chronic stages have decreased NAA/Cr ratios (6, 14). Some investigators have proposed in-creased lipid peaks (15–17) or inin-creased lac-tate resonances (12, 13) as early indications of active MS plaques. Others have reported that the increased ratio of amino acid to creatine (AA/Cr) is observed as myelin is degraded in an active stage of the plaques, especially in con-trast-enhanced plaques (18). Because NAA is found almost exclusively in neuronal cells (7, 8, 19), the reduction of the NAA/Cr ratio in MS plaques has been considered to be a reflection of cumulative irreversible tissue damage and, hence, neuronal dysfunction or the loss of neu-Fig 5. T2-weighted MR images (top
[image:6.612.51.306.87.549.2]row) and MTR maps (bottom row) of a diffuse hyperintensity lesion. Diffuse high signal intensity and focal brighter area ( ar-rowhead) are visible on MR images inside the MR spectroscopy voxel. Subtraction MTR maps show the small area of signal voids in the MR spectroscopy voxel (MTR ,37.5%).
[image:6.612.220.543.87.345.2]rons in the chronic phase of a demyelinating process.
The availability of MT has provided new in-sight into the status of macromolecules in the tissue. The exchange of magnetization between free water and bound water surrounding the macromolecules will affect imaging contrast (1, 2). The main source of these macromolecules in white matter is myelin. Therefore, the loss of myelin will directly cause a reduction of the
bound water pool, which will lead to a decrease in the MT effect. In a previous study, the wide range of MTR values in MS lesions was attrib-uted to the difference in the stages of demyeli-nation, and consequently, to differences in the age of the plaque (3). Again, the reduction of MTR is consistent with the demyelinated state of plaques.
[image:7.612.41.376.89.545.2]In this study, spectra obtained from normal-appearing white matter were indistinguishable Fig 8. Two-dimensional plots of NAA/Cr ratio versus MTR of
voxels containing MS plaques. There is a significant linear rela-tionship between the NAA/Cr ratio and the MTR.
Fig 9. Two-dimensional plots of NAA/Cr ratio versus signal intensity of MS plaques on T2-weighted MR images. No significant linear relationship was found between the NAA/Cr ratio and signal intensity on T2-weighted images.
[image:7.612.306.543.380.555.2]from those obtained in healthy control subjects. A previous study has demonstrated a significant difference between the MTR in the normal-ap-pearing white matter of MS patients and that of healthy control subjects (20). In the current comparison, the mean value of the MTR was within the range of normal, probably because of the averaging of pixels with the mostly normal MTR value in the large MR spectroscopy voxel. However, the pixels with decreased MTR values appeared to be more scattered than those of control white matter on MTR map images. In this regard, our result was consistent with the previous reports (3, 20). By far the most com-mon microscopic abnormality was gliosis in macroscopically normal white matter in MS pa-tients (21). Therefore, the foci of reduced MTR shown on the subtraction MTR maps might cor-respond to microscopic lesions distributed in normal-appearing white matter, in which the myelin content is relatively reduced as a result of gliotic change.
Diffuse hyperintensity lesions also contained scattered pixels with reduced MTR as well as diffusely increased intensity on T2-weighted im-ages. Note that a large fraction of pixels in the voxel still have a normal MTR value despite the definitive high signal intensity on T2-weighted images. Although the pixels with diminished MTR may be considered the demyelinated por-tion in the MR spectroscopy voxel, the majority of pixels within MR spectroscopy voxels proba-bly had simple edematous change not accom-panied by definitive myelin change. This is also in accordance with the normal value of the NAA/Cr ratio and the high Cho/Cr ratio in this group, since the former ratio from MS plaques remains unchanged and the latter ratio is high in the acute phase of MS plaques, as reported previously (12, 13, 22). Thus, if the lesions in this group are in the acute stage with edema, the metabolite change is consistent with the MTR values in the MR spectroscopy voxel and with the hyperintensity seen on T2-weighted images.
The NAA/Cr ratio of focal lesions was signif-icantly decreased from that of the control group, whereas the Cho/Cr ratio revealed no significant difference from that of the control group. The reduction of the NAA/Cr ratio in MS plaques has been attributed to the loss of neuronal cells (6, 13). On the other hand, the increased Cho/Cr ratio has been discussed in relation to the deg-radation process of cells (12, 13), since this
peak may contain catabolic products of mem-brane metabolism, such as glycerophospho-choline. Therefore, the change in the Cho/Cr ratio may be dependent on the stage of activity of this process. The plaque with the lowered NAA/Cr ratio and the normal Cho/Cr ratio might be considered a chronic plaque with no inflammatory activity.
In this correlative study of focal plaque le-sions, we have shown a positive correlation be-tween the MTR and the NAA/Cr ratio, which supports the concept that the MT image is sen-sitive to the presence of real myelin damage, and that those lesions with lowered MTR ulti-mately evolve into an irreversible stage in the degeneration and gliosis of neuronal tissue. These plaques will also have lowered NAA/Cr ratios on proton MR spectroscopy. Although both the MTR and the NAA/Cr ratio changed along with the plaque age, the alteration of MTR may occur at an earlier stage of the demyelinat-ing process, since a recent study has shown the positive inverse correlation between MTR and AA/Cr (23). On the other hand, the NAA/Cr ratio was not well correlated with the regional intensity of the plaque on T2-weighted images. The signal intensity of T2-weighted images is not specific to the type of MS plaque, whether edema, demyelination, or gliosis, whereas the NAA/Cr ratio may be dependent on the neuro-nal density left in the plaque. This is one possi-ble explanation as to why a lack of correlation was found between the intensity on T2-weighted images and the NAA/Cr ratio.
The results of the correlative study for the group of focal lesions of high intensity should be inter-preted carefully, because MR spectroscopy data from a 1.5-cm voxel will still have considerable partial volume effects of normal-appearing white matter surrounding MS plaques. However, we note that the positive linear relationship was also observed between the MTR in the central part of the plaques and the NAA/Cr ratio. Since the mean MTR from the central part of the plaques was calculated from constant volume in MS plaques, this MTR value was not affected by the MTR value from surrounding white matter. Therefore, the MTR from the plaque itself plays a certain role in the correlation of metabolite ratios, although some partial volume effects are unavoidable un-der the current resolution of MR spectroscopy studies.
with a low MTR correlate with the finding of a low NAA/Cr ratio; therefore, they may prove to be markers of irreversible damage, because a low NAA/Cr ratio has been considered to be a sign of irreversible neuronal damage in MS plaques. If this is true, the region with a de-creased MTR will probably lose its neuronal in-tegrity or neuronal tissue in time, although serial or longitudinal studies are required to validate this. However, it is likely that a small reduction in the MTR seen in simple edematous MS le-sions may be reversible to a normal MTR range, since the small decrease in the MTR seen in a model of experimental allergic encephalomyeli-tis has been attributed to the relative dilution of macromolecular concentration and not to real myelin damage (3). Another potential signifi-cance of the current result is that, for certain studies, MT imaging may be able to substitute partly for proton MR spectroscopy, which will enable the characterization of MS plaques in the whole brain with greater spatial resolution and in less examination time.
In summary, our results suggest that the di-minished MTR detected in MS lesions may be a marker for irreversible cell damage, as evi-denced by the decreased NAA/Cr ratio ob-served in the MR spectroscopy study.
References
1. Balaban RS, Ceckler TL. Magnetization transfer contrast in mag-netic resonance imaging.Magn Reson Q1992;8:116 –137 2. Wolff SD, Balaban RS. Magnetization transfer contrast (MTC) and
tissue water proton relaxation in vivo.Magn Reson Med1989;10: 135–144
3. Dousset V, Grossman RI, Ramer KN, et al. Experimental allergic encephalomyelitis and multiple sclerosis: lesion characterization with magnetization transfer imaging.Radiology1992;182:483– 491
4. Lexa FJ, Grossman RI, Rosenquist AC. MR of wallerian degener-ation in the feline visual system: characterizdegener-ation by magnetizdegener-ation transfer rate with histopathologic correlation.AJNR Am J Neuro-radiol1994;15:201–212
5. Richards T. Proton MR spectroscopy in multiple sclerosis: value in establishing diagnosis, monitoring progression, and evaluating therapy.AJR Am J Roentgenol1991;157:1073–1078
6. Arnold D, Matthews P, Francis G, Antel J. Proton magnetic reso-nance spectroscopy of human brain in vivo in the evaluation of multiple sclerosis: assessment of the load of disease.Magn Reson Med1990;14:154 –159
7. Nadler JV, Cooper JR. N-acetyl-L-aspartic acid content of human
neural tumorous and bovine peripheral nervous tissues.J Neuro-chem1971;178:313–319
8. Koller KJ, Zaczek R, Coyle J. N-acetyl-aspartyl-glutamate: re-gional levels in rat brain and the effects of brain lesions as deter-mined by a new HPLC method.J Neurochem1984;43:1136 –1142 9. MacGowan JC, Schnall MD, Leigh JS. Magnetization transfer im-aging with pulsed off-resonance saturation: variation in contrast with saturation duty cycle.J Magn Reson Imaging1994;4:79 – 82 10. Marion D, Ikura M, Bax A. Improved solvent suppression in one-and two-dimentional NMR spectra by convolution of time-domain data.J Magn Reson1989;84:425– 430
11. Rose LM, Richards TL, Petersen R, Perterson J, Hruby S, Alvord EC. Remitting-relapsing EAE in nonhuman primates: a valid model of multiple sclerosis.Clin Immunol Immunopathol1991; 59:1–15
12. Matthews PM, Francis G, Antel J, Arnold DL. Proton magnetic resonance spectroscopy for metabolic characterization of plaques in multiple sclerosis.Neurology1991;41:1251–1256
13. Miller DH, Austin SJ, Connelly A, Youl BD, Gadian DG, McDonald WI. Proton magnetic resonance spectroscopy of an acute and chronic lesion in multiple sclerosis.Lancet1991;337:58 –59 14. Van Hecke P, Marchal G, Johannik K, et al. Human brain proton
localized NMR spectroscopy in multiple sclerosis.Magn Reson Med1991;18:199 –206
15. Narayana PA, Wolinsky JS, Jackson EF, McCarthy M. Proton MR spectroscopy of gadolinium-enhanced multiple sclerosis plaques.
J Magn Reson Imaging1992;2:263–270
16. Koopmans RA, Li DK, Zhu G, Allen PS, Penn A, Paty DW. Mag-netic resonance spectroscopy of multiple sclerosis: in-vivo detec-tion of myelin breakdown products.Lancet1993;341:631– 632 17. Davie CA, Hawkins CP, Barker GJ, et al. Detection of myelin
breakdown products by proton magnetic resonance spectros-copy.Lancet1993;341:630 – 631
18. Grossman RI, Lenkinski RE, Ramer KN, Gonzalez-Scarano F, Cohen JA. MR proton spectroscopy in multiple sclerosis.AJNR Am J Neuroradiol1992;13:1535–1543
19. Birken DL, Oldendorf WH. N-acetyl-L-aspartic acid: a literature
review of a compound prominent in1H-NMR spectroscopy studies of brain.Neurosci Biobehav Rev1989;13:23–31
20. Loevner LA, Grossman RI, Cohen JA, Lexa FJ, Kessler D, Kolson DL. Microscopic disease in normal-appearing white matter on conventional MR images in patients with multiple sclerosis: as-sessment with magnetization-transfer measurements.Radiology
1995;196:511–515
21. Allen IV, Mckeown SR. A histological, histochemical and bio-chemical of the macroscopically normal white matter in mul-tiplesclerosis.J Neurol Sci1979;41:81–91
22. Brenner RE, Munro PMG, Williams SCR, et al. The proton NMR spectrum in acute EAE: the significance of the change in the Cho:Cr ratio.Magn Reson Med1993;29:737–745