Reducing complexity costs
by
implementing a modular design
Master thesis
Some information has been left out due to confidential reasons
First supervisor Dr. Ir. E. Hofman
Assistant Professor at University of Twente Second supervisor
Dr. R. Harms
Associate Professor at University of Twente Supervisor TU Berlin
Daniel Krezdorn M.Sc. Centre of Entrepreneurship TU Berlin
Company supervisor Dr. Ir. J.J. Tiemersma
Author Nijmeijer, L.W.A.
Double degree student: Master BA and IME Student number UT: 1229036
II
Abstract
Along with the raising demand in customized products, the number of product variants
offered by companies has been rising significantly and continue to rise in the coming years.
The higher number of products within a company leads to variety-induced complexity and
consequently raising costs. In a world driven by competitiveness and profit maximization, it is
evident that these variety-induced complexity costs should be as low as possible. CEOs around
the world acknowledge the need to control this increase in complexity and react in order to
lower the costs, whereas nearly half of them do not feel ready for it.
Currently, there is no comprehending, empirically tested process that aids managers in
reducing the complexity costs that their company is facing. Hence the goal of this paper. This
paper introduces a process which has been tested in a medium-sized manufacturing company,
and with that proven its worth regarding lowering the complexity costs significantly within the
company. This process has been established through an extensive literature review and
interviews with employees throughout the organization, with as a starting point using
modularity as a way to reduce complexity costs.
It has been found that, next to saving costs directly in the way of cutting out unprofitable or
unnecessary product components, the indirect cost savings of reducing variety are higher as
they occur at multiple areas in the organization: planning, production, communication,
warehouse management etc. This means that money is saved constantly instead of only one
time. This enhances the profitability of the company.
Moreover, the process forces a company to analyse their product portfolio, consider the
wishes of their customer and think about the future. Surprisingly, unexpected results were
found such as discovering an unprofitable product line and a customer wish to reduce lead
times. Also, a potential area for new product development has been found which can be
III
Table of contents
Abstract ... II
List of figures ... V
List of tables ... VI
1. Introduction ... 7
1.1 Situation and complication ... 7
1.3 Research goal ... 10
1.4 Research lay-out ... 10
1.4.1 Research question ... 10
1.4.2 (Sub)questions ... 10
1.4.3 Academic relevance ... 10
1.4.4 Practical relevance ... 10
2. Research design ... 11
2.1 Empirical context ... 11
2.2 Data collection method ... 12
2.3 Analysis ... 13
3. Theoretical framework ... 13
3.1 Definitions ... 13
3.2 Literature review ... 15
3.2.1 Scientific background ... 16
3.2.3 Modularity as a way to reduce complexity costs ... 20
3.3 Development of the process: design for variety as modularization method ... 25
3.4 Design for variety: a modularization method ... 28
3.5 Other solutions ... 34
4. Results ... 35
4.1 Analysis of the current product portfolio ... 35
4.2 Scope ... 36
4.3 Design for variety: modularizing the product family ... 38
4.3.1 DFV step one: generate GVI and CI for the design ... 38
4.3.2 DFV step 2: order the components ... 50
4.3.3 DFV step 3: Determine where to focus ... 51
4.3.4 DFV step 4: comparison of variants ... 51
4.4 Recommendations for management: Cost and benefit analysis ... 53
IV
4.4.2 Housing ... 54
4.4.3 Limit Switch... 55
4.4.4 Shaft ... 56
4.4.5 Reduction of lead times ... 56
5. Discussion... 57
5.1 Key findings ... 57
5.2 Limitations ... 58
5.3 Future research ... 58
6. Conclusion ... 59
7. References... 61
V List of figures
Figure 1. Ishikawa-diagram ... 9
Figure 2. Modular design... 15
Figure 3. Effects of high variety (Ripperda & Krause, 2014, p.16). ... 18
Figure 4. Relationship between diversified product portfolio and complexity costs ... 21
Figure 5. Flowchart to reduce complexity costs ... 27
Figure 6 .The Whale Curve (Wilson, 2009, p.5). ... 28
Figure 7. A mixed model assembly line ... 34
Figure 8. Expected change in EM normalized target values ... 43
VI List of tables
Table 1. Comparison of different modular product families ... 23
Table 2. GVI Matrix rating system ... 30
Table 3. CI rating system for sensitivity of specification ... 32
Table 4. Key numbers of the product familty and its variants ... 37
Table 5. Markets and introduction dates ST1/ST2 ... 39
Table 6. Markets and introduction daates STB. ... 39
Table 7. GVI QFD Phase I ... 40
Table 8. GVI QFD Phase II ... 40
Table 9. QFD phase I with expected changes in customer requirements ... 41
Table 10. QFD phase I with EM target values added ... 42
Table 11. GVI calculation ... 44
Table 12. CI matrix with specification flows ... 46
Table 13. CI-S and CI-R calculated ... 48
Table 14. Ordering the components ... 49
Table 15. Ranknig the indices into high and low. ... 49
7 1. Introduction
1.1 Situation and complication
The recent increase in demand customization (Closs, Jacobs, Swink & Webb, 2007) has led
towards an increase in the number of products offered. Executives reported that their firms
offer on average an increase of 1.7 new products for every product retired (Hoole, 2006),
consequently leading towards an increase of complexity of their product portfolio (Berman &
Korsten, 2010). This means that the main source of complexity is the number of products and
the components within these products (Myrodia & Hvam, 2015). It is expected that this
megatrend continuous, resulting in more complexity.
As complexity is expected to rise, so are the costs associated with it. Nearly eight out of ten
CEOs anticipates on the complexity that lies ahead, half of the 1,500 CEOs that were
participating in this study do not feel ready for it (Berman & Korsten, 2010). “The world’s
private and public sector leaders believe that a rapid escalation of complexity is the biggest
challenge confronting them” – Samuel J. Palmisano, CEO of IBM Corporation (Berman &
Korsten, 2010, p.3). This means that finding a way to reduce complexity costs in this world
driven by profit maximization is of great value for companies. Also because managers in
general expressed their concerns that this increase in complexity undermine the future profits
of their company (Hoole, 2006; Berman & Korsten, 2010). Complexity costs are the costs that
come from offering a multitude of products (Hansen, Mortensen & Hvam, 2012).
To meet customer demand, multiple variants of products and components are necessary.
Following this reasoning, not all complexity is bad, and some complexity can be even
considered as a competitive advantage (Scheiter et al., 2007). The important task is to identify
the non-value adding complexity, and transmit this complexity into certainty. By tackling
complexity costs, organizations can reduce its cost by 15% to 30% in significant portions of
their business (Wilson, 2009). Kraft, owner of the famous triangular shaped Toblerone bar,
estimated a result of $400 million a year due to its reduction in complexity. Reducing
complexity costs is not just about reducing the level of complexity within the organization, it
is also about reducing the cost of delivering complexity (i.e. making complexity less expensive)
8 The conflict between the external pressure from customers pushing for unique applications/
and the internal standardizations due to cost reductions/ can be solved by introducing a
modular design (Martin & Ishii, 2002). A modular design standardizes different product
components, which then can be configured into a wide range of end products to meet
customer demands (Tu, Vonderembse, Ragu-Nathan T.S. & Ragu-Nathan B, 2004). By
developing the ability to produce a wide variety of products through developing standardized
modules, manufacturers can significantly reduce complexity costs (Sanchez, 2000). Thus
implementing a modular design is a way to lower complexity costs. Simon illustrated this
already in 1962 with an example, however, with the current trends (i.e. digitalization,
globalization, customization) complexity became more evident and raises the attention of
bigger companies. The example given by Simon (1962) can be found in Appendix A.
Current literature acknowledges the fact that complexity costs that comes from the diversified
customer demands can be reduced by implementing a modular design (Martin & Ishii, 2002;
Blecker & Abdelkafi, 2006; Huang, 1999). However, it lacks both empirical research and a
validated model concerning this relationship. This research aims to develop a clear and
comprehending process, which is validated and tested in a medium-sized manufacturing
company, which currently has a large product portfolio due to the diversified customer
demand. This company is hereafter referred to as the pilot company. Also, this research sheds
some light on the concept of portfolio management, combined with complexity costs and
modular design, where current literature mainly focus on the relationship between two of
these concepts.
1.2 Problem definition
The increase in diversity in customer demand results in a challenge for the companies. Not
only do they have to articulate the needs into suitable products, but they also need to have
the competences to make the products. Moreover, this has to be done as cheap as possible.
By implementing a modular design, the diversified customer needs can be met while lowering
costs (Sanchez, 2000; Tu et al., 2004; Martin & Ishii, 2002). By developing a process, a company
can follow certain steps that help to reduce complexity costs through implementing a modular
medium-9 sized manufacturing company to identify potential gaps and to validate the value of the
process.
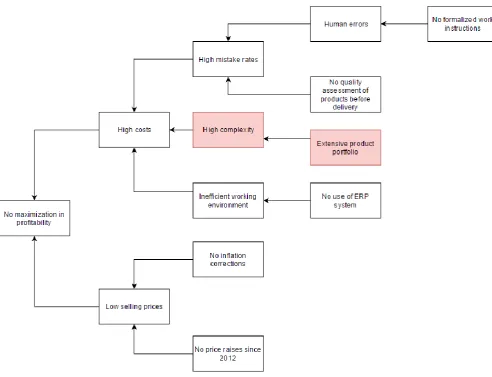
The company has no profit maximization, due to high costs and low selling prices. The high
costs results from human errors, high complexity and an inefficient working environment. The
company offers a wide range of products for its customers, resulting in an extensive product
portfolio. The expectation is that due to the diversified product portfolio and the low number
of sales of some product (groups), there is space for optimization. The scope of this research
is limited according to an analysis of their current product portfolio, considering the number
of sales and accordingly the revenue and profit. Figure 1 is a graphical representation of the
problems the company currently faces. The boxes marked in red show the problem that this
[image:9.595.53.546.340.717.2]research aims to solve.
10 1.3 Research goal
The goal of this research is to develop, validate and apply a process through which company
X can reduce its complexity costs by assessing their current product portfolio and discovering
potential fields and/or products that are suitable for modularization. The process consists of
several steps which the company can follow in order to reduce its complexity costs, while
aiming at one specific product family. The process is visualized in a flowchart.
1.4 Research lay-out
1.4.1 Research question
How can variety-induced complexity costs be reduced through modularising the product
portfolio?
1.4.2 (Sub)questions
1. What is the consequence of variety induced complexity?
2. Which modularisation methods exists?
3. Which method is most applicable for reducing variety induced complexity?
1.4.3 Academic relevance
The academic relevance of this research lies within the fact that this researches proposes a
process that is based on relevant literature and is empirically tested in a manufacturing
company. The result is that the extensive literature that is out there concerning complexity
costs is brought together in one comprehensive chart. In other words, this research combines
different methods into one comprehending process that aids a company in lowering
variety-induced complexity and with that enhances the profitability. Moreover, this research temps
to give the relationship between three concepts (i.e. product portfolio, complexity and
modularity), whereas current literature focuses mainly on the relationship between two
concepts.
1.4.4 Practical relevance
The practical relevance of this research is that the theory is transmitted into an empirically
tested process. Organizations can use this process as a way to reduce their complexity costs
11 Moreover, the process forces the organization to map out the current demand in the market.
Therefore this process is useful for companies through considering multiple important aspects
for a company, but mainly for reducing complexity costs. The reduction in complexity costs
are shown in both direct and indirect costs savings, however, the indirect cost savings contain
a multitude of the direct cost savings as this reduction in inefficiency occur over and over.
2. Research design
This study aims to develop and test a process in which complexity costs can be reduced by
influencing the product portfolio. In other words, this research entails a design oriented
research where the current product portfolio is redesigned. This process is presented in a
flowchart, which consists of different steps. Both a qualitative and quantitative study has been
conducted in order to gather the right information. This study follows a deductive approach,
where a particular situation is analysed and then used to validate the process. As a basis for
the interviews that are conducted, background information about the company and the
gained knowledge from literature review are used. Next to that, information is gathered in an
informal way. However, in order to ensure reliability of the research, written pieces are read
in order to check for inconsistencies or misinterpretations. Information as sales, revenues,
prices and product offerings are gathered through the use of the Enterprise Resource Planning
system (ERP-system) in place. The research design starts with the empirical context, and is
followed by the data collection method and an explanation on how the data. The research
design ends with a detailed description on how the different concepts are measured.
2.1 Empirical context
The pilot company is a medium-sized Dutch manufacturing company which develops and
manufactures drive systems and components for a wide range of industries within the
agricultural sector. The pilot company currently offers full-time jobs for 25 employees, with a
revenue of roughly ***€ million in 2015. The pilot company addresses both the national as
well as the international market, with operating in countries such as the Netherlands,
Germany, Belgium and the United States. Currently, the pilot company produces a wide range
of products that are specially made for the customer and therefore has an extensive product
portfolio. The pilot company changed ownership in April 2016, and consequently has a new
day-to-day management. The owners/management is aware of improvement possibilities and
12 benefit of conducting the research in a medium-sized company, is that it is easier to get a clear
and comprehending picture of the whole company which opens the opportunity to entail in
an embedded study as multiple sub-units of the company are analysed. To get a clear and
comprehending picture of the company, the researcher has been present at the company 40
hours a week in the period of April ’16 till February ‘17. Note that during this time, there was
no engineer available in the company that could aid in the design and implementation of a
modular design. The quotes throughout these reports has been disguised, in order to ensure
confidentiality.
2.2 Data collection method
The data has been collected through a combination of both qualitative and quantitative
approaches. As a qualitative approach, semi-structured interviews has been conducted with
different employees throughout the company. It is likely that, in order to ensure the reliability
and the completeness of the information, multiple interviews with the same persons are
conducted over the time period of this research. An advantage is that qualitative research, in
this case semi-structured interviews, give rise to the opportunity to gain a deep insight of the
company (Babbie, 2010). By using a semi-structured approach, the possibility arises to diverge
from the topic when interesting and valuable answers are given. No interview transcript is
added to this research due to confidentiality reasons. Different people throughout the
company will be interviewed, for example current management, salespersons and the
coordinator of manufacturing. Also, questions are asked in an informal way with people
throughout the organisation. To ensure the reliability of the research, the answers were
validated once written down.
In order to get a clear picture about the market and the customers, questions were asked to
the customer at an international fair as well as through a questionnaire via e-mail. The
information gathered from the customers is used directly in the form of quotes, and indirectly
as background information to get a profound picture of the company as well as the products
that are sold.
As a quantitative approach, a primary and secondary literature review has been conducted in
order to uncover patterns within for example the industry and the market. This succours the
13 2.3 Analysis
After the data was collected, the qualitative data has been analysed through coding. Coding
refers to “the process whereby raw data is transformed into standardized form suitable for
analysis” (Babbie, 2010, p. 338). Coding makes it easier to compare data generated from
multiple sources, or to look for inconsistencies within answers from one respondent.
As said, the quantitative data has been used to discover certain patterns and key numbers
from primary data provided by the company, which is on its turn compared with secondary
literature in order to make sense of the data. Also, quantitative data has been used to define
the scope of the research.
3. Theoretical framework
Firstly, the theoretical framework gives static definitions which has been used throughout the
report. Secondly, a systematic description is presented on how the literature review has been
conducted, followed by the literature review itself. The theoretical framework ends with the
flowchart that aids in reducing complexity costs.
3.1 Definitions
There are three central concepts embedded in this research: complexity costs, product
portfolio and modularity. By comparing and potentially combining current definitions, a
profound and comprehending definition is given regarding the three central concepts mention
earlier.
The definition of the product portfolio of a company is pretty straightforward. Throughout this
report, a product portfolio is considered as all the products offered for sale by the organization
in question (Jacobs & Swink, 2011), where a product is considered to be a physically discrete system sold as a single unit (Ulrich, 1995). Variety within the product portfolio relates to the amount of products that is offered by the organization in question. For the scope of this
research, the product portfolio only concerns the tangible products offered by the
organization. This definition has been chosen as it boils down to a simple but comprehending
definition, which is used by multiple researchers regarding several subjects (e.g. Jacobs &
14 Current literature is roughly agreeing on a definition for complexity costs. Hansen, Mortensen
& Hvam (2012) consider complexity costs as ‘a price that comes with offering a multitude of
products’ (p.1). Lechner, Klingebiel & Wagenwitz (2011) see complexity costs as ‘the number
and variety of product variants …. which influences costs and performance’ (p.2). Another
definition, given by Götzfried, (2013), states that ‘as product variety increases, companies often experience internal difficulties which lead to higher manufacturing costs, manufacturing overhead, delivery times, inventory levels and component prices (i.e. complexity costs)’ (p. 2-3). As the definitions from Götzfried (2013) encompasses the most extensive definition of
complexity costs, for example the definition includes examples of costs that come from a
higher complexity, this definition is used throughout the report. In other words, the definition
by Götzfriend (2013) encompasses the most complete definition and combines definitions
from different researchers (e.g. Hansen et al. (2012); Lechner et al. (2011).
Modularity can be considered as the standardization of components and processes in an
organization that can be configured into a wide range of end products to meet specific customer demands (Ulrich, 1995). Ulrich and Tung (1991) define modularity in terms of two characteristics of product design: 1) Similarity between the physical and functional architecture of the design and 2) Minimization of incidental interactions between physical components. Another definition of modularity is that modularity is a property of a specific view of a system (artificial or natural), where the system can be decomposed into components that have a form of independence—with respect to some properties (Bergmans, 2011, p.1). Considering the above stated definitions of modularity, they all have one thing in common:
modularity refers to the configuration of components into end products. The research from
Ulrich (1995) has been cited frequently by other scientific articles, meaning that his work has
proven its value , and therefore modularity within this research is considered as the standardization of components and processes in an organization that can be configured into a wide range of end products to meet specific customer demands.
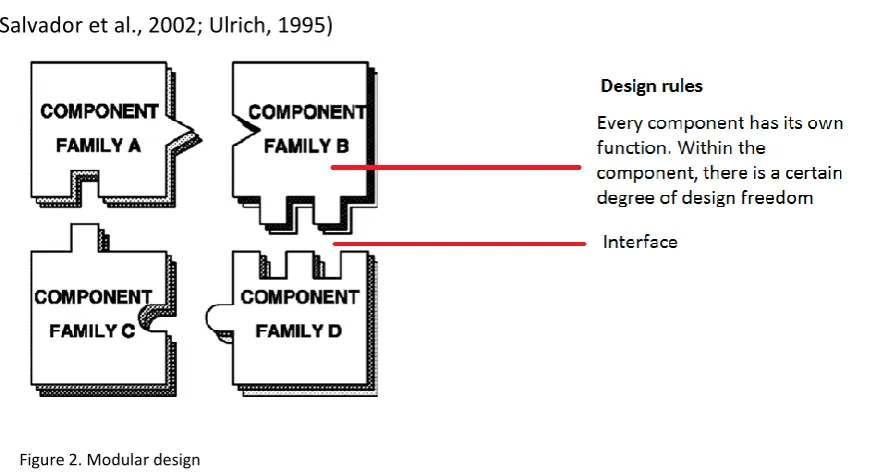
Modularity as a concept is de decoupling of product components including a one-to-one
mapping from functional elements into a physical component. For example, if you consider a
15 Figure 2 considers modular design example on a basic level. Within one component family,
there is a certain degree of design freedom. Between the components, there is an interface
meaning that not every component is suitable with another component when assembling
(Salvador et al., 2002; Ulrich, 1995)
3.2 Literature review
Over the past twenty years, the amount of published papers per year concerning the topic
complexity costs have increased more than 750%, from 369 in 1995 to 2783 in 2015 (Web of
science, sd.). This chapter considers the most relevant papers regarding the central research
question, namely how variety-induced complexity costs can be reduced through modularising
the product portfolio. Different search engines for scientific literature have been used to
discover the published literature, such as Google Scholar and Scopus. Next to that, the so called snowball sampling has been used, where citations within relevant literature give the researcher the name of another interesting study that can be helpful to compound a
comprehensive literature review (Vogt, 1999). The generated articles are then sorted by
relevance through business application field and in terms of number of citations. The number
of citations consider to what extent the scientists perceive the paper as relevant. Also, articles
that are published recently (i.e. in the last ten years) are considered of higher value as older
information may be obsolete. Around the main theme of this research, three central concepts
can be distinguished: product portfolio, complexity costs and modularity. By integrating these
concepts into relevant key words, the most important literature was found. When a scientific
[image:15.595.75.513.132.369.2]16 relevant chapters. By considering multiple articles from multiple researchers, the
trustworthiness of the data increases.
The first sub-chapter considers the relationship between the three central concepts of this
research: product portfolio, complexity costs and modularity. This chapter possesses
information about what the relationship encompasses and the direction of the relationship.
Keywords that has been for finding relevant information are “product variety complexity”,
“product portfolio complexity”, “diversified product offerings”, “organizational complexity”.,
“variety-induced complexity costs”, “value chain complexity costs”, “product variety costs”,
“measuring complexity costs” and “modular complexity”.
The second subchapter goes deeper into modularization as a potential solution for lowering
complexity costs. It considers how a company can implement a modular design. Keywords that
has been entered for finding relevant information are “modular product families”, “modular
complexity” and “modular implementation”.
3.2.1 Scientific background
The number of product variants have increased dramatically over the past few years (Hoole,
2006; Wilson, 2009). The provider of the goods or service seeks to achieve more economic
benefit and enhance the value perceived by the customer by offering a wider spectrum of
choice (ElMarghy H., Schuh, ElMaraghy W., Piller, Schönsleber, Tseng & Bernard, 2013). In
other words, due to the increased demand for customization where customers push for
unique applications of products, the number of products has risen sharply within companies
as they tempt to meet this diversified demand (Hu, Zhu, Wang & Koren, 2008; Hoole, 2006;
Closs et al., 2007).
An inverted U-shape relationship exists between product portfolio complexity and
performance (Fernhaber, 2012). At some point, the costs (e.g. coordination and
communication costs) outweigh the benefits of having a more diversified product portfolio
(Closs et al., 2008). At this point, the increase in complexity does not add any value. Identifying
this point ensures to have the necessary complexity in order to meet customer demand, but
17 Product variety can potentially increase sales volumes and revenues. However, a higher
variety of products is not always good, and may not always offer the extra perceived value
that is intended with offering a wider range of products. Evidence shows that customers can
get confused when choosing among a wide variety of products (Huffman & Kahn, 1998).
Thus defining the right range of products is an important management issue. There are hurdles
from both sides, as the customers’ needs may be latent, inherent and difficult for customers
to describe. Nevertheless, customers can act as a source of innovation. Therefore, customer
demand should be taken into account when establishing a product portfolio (Hutter, Hautz,
Füller, Mueller & Matzler, 2011). The other side, the producers, are limited by their
technological possibilities and competences. The products a company offers draw upon
organisational competences (Danneels, 2002; Prahalad & Hamel, 2006). This often results in a
mismatch between demand and supply, which leads the companies saddled with excess
inventory and unsold product variants (ElMaraghy H. et al., 2013).
The product portfolio influences the inventory an organization has. When a product has
dominant characteristics as short life cycles and high demand uncertainty, or fluctuating sales,
inventory levels are adjusted (Langenberg, Seifert & Tancrez, 2011). Consequently, while
developing a product portfolio, associated costs like storage costs of inventory have to be
taken into consideration. Having an inventory, especially for manufacturing companies, is
imperative and therefore cannot be neglected within this process. The interdependence
between these two concepts (i.e. product portfolio and inventory) offers an opportunity
within the chart to assess current inventory. Thus during the analysis of the current product
portfolio, an assessment of the current inventory can be made.
Variant multiplicity may be external or internal. External causes result from factors such as
market, competition, suppliers and the technological characteristics of product offerings.
Internal causes are organizational and technical deficiencies leading to an unnecessary
increase in product varieties, both at product- and component levels (ElMaraghy H. et al.,
2013). Schuh and company (2012) shows that both internal and external complexity causes
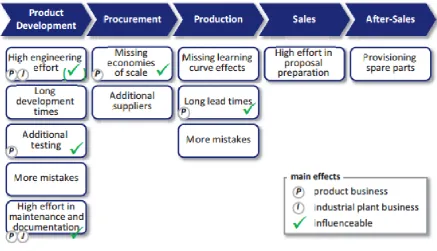
18 Figure 3 shows that the effects of high product variety throughout the different areas within
the company.
These effects are evident in the pilot company. An example is the high effort in maintenance
and documentation.
“There is no or little documentation available of the recent years. Also, the drawings of the
[image:18.595.84.522.276.527.2]different drive systems and components, are obsolete.” – Manager 1
Figure 3. Effects of high variety (Ripperda & Krause, 2014, p.16).
Another example is the missing economies of scale. Product parts are bought and supplied in
excess inventory, in order to keep the procurement price as low as possible. However, having
a product on the shelf for 2,5 years, has its price too. The lead times in the pilot company are
high as well. Of the lead time, around 90% is waiting time of the products before they can
proceed production. Also, the number of suppliers are relatively high. Only for the castings
that are needed to produce the housing of a drive system, there are 5 different suppliers.
Some of these effects are directly nfluenceable, as can be seen in figure 3, however, might
take a lot of effort and money to do so. By lowering the variety-induced complexity, these
19 by multiple authors (e.g. Hu et al., 2008; Macduffie, Sethuraman & Fisher, 1996; Fisher &
Ittner, 1999).
One of the important objectives of variety management is the reduction and management of
variety-induced complexity and its associated costs. For example, variety-induced complexity
results in human errors and influences both supply chain configuration and inventory control
policy (Hu et al., 2008). Variety-induced complexity arises due to the increased number of
variants and their features. It is expected that additional product variances raises sales and
prices. The consequential profit is often overestimated and does not weight up to the
variety-induced complexity costs (ElMaraghy H. et al., 2013). This means that an increased product
variety can have a significant negative impact on performance (Macduffie et al., 1996; Fisher
& Ittner, 1999).
Variety-induced complexity costs, as opposed to complexity, cannot be easily quantified by
traditional cost-accounting methods (Wilson, 2009). The measurement of complexity within
an organization has given more attention than complexity cost, as different models has been
developed to measure the level of complexity within a firm (e.g. Jacobs, 2013). Recent
research into the field of complexity costs stretch the need to develop quantifiable complexity
effects on costs (Ripperda & Krause, 2014). Complexity costs come from indirect activities,
and therefore cannot be directly associated to a product (Thonemann, 2000). These indirect
costs are usually equally distributed among all variants. This results in the fact that different
architecture concepts are not implemented very often due to a lack of quantification of the
exact complexity costs and the positive effects (or diminishing of negative effects) of a
different architecture concept (Hansen et al., 2012).
Established accounting systems (e.g. ERP-systems) focus on direct product costs alone (e.g.
standard unit costs), and thus neglect the indirect costs associated with the products (Hansen
et al., 2012). Due to the fact that the costs are hard to quantify, complexity costs are generally
considered as overhead costs and consequently are fixed costs (Lechner et al., 2011). Volume
effects of variants are overestimated, whereas their impacts on costs remain underestimated.
This results in the fact that the costs that are assigned to offering a wider variety of products
20 as ‘costs of doing business’ and sometimes erroneously treated as zero (Jagersma, 2008). This
increase in complexity raises costs throughout the whole value chain, from product
development to marketing & sales (Hu et al., 2008). Meaning that the indirect costs savings
will outnumber the direct costs savings as complexity costs cannot be quantified, but
nevertheless are present in every company and reduce profitability significantly. This research
focuses mainly on the increase in complexity costs at the manufacturing stage, the warehouse
& distribution stage and the engineering stage. Examples on how higher complexity increases
costs at these stages are among others: more frequent downtime, higher waste, higher WIP,
more complex production control, increased space and labor, and higher inventory levels
(also, see figure 3). However, Myrodia and Hvam (2015) introduce factors that influence
complexity costs. By measuring and altering these factors, complexity costs can be reduced.
Among these factors are setup times in production, scrap of materials in setup of machines,
sales order handling, inventories of finished goods, and freight of finished goods to
warehouses.
3.2.3 Modularity as a way to reduce complexity costs
The trade-off between variety increase and complexity cost is not static, as modular product
designs can reduce both complexity and costs. There is a negative relationship between the
implementation of a modular design and the complexity costs within an organization, i.e. the
higher the success of implementing a modular design, the lower the complexity costs (Blecker
& Abdelkafi, 2006). Volkswagen claims to save $1.7 billion annually on development and
production costs by effective management of their product architecture. This is mainly done
through the use of component commonality within products (Dahmus et al., 2001).
Nevertheless, Volkswagen still claims that their products can be effectively differentiated in
the eyes of the customer.
Multiple companies embraces product structure optimization as a way to reduce complexity
costs as a result from the increased variety in products (Chandrasegaran, Ramani, Sriram,
Horváth, Bernard, Harik & Gao, 2013). Modularization as a product structure simplifies
interactions by reducing component variation and by unifying component, product, and
process specifications (Gereffi, Humphrey & Sturgeon, 2005). Modularity can mitigate the
21 (Salvador, Forza & Rungtusanatham, 2002). This means that modularity can be considered as
a factor directly influencing the complexity costs (ElMaraghy H., 2013). Figure 4 summarizes
the relationship between a diversified product portfolio, the implementation of a modular
[image:21.595.83.563.216.375.2]design, complexity costs and its effect on the performance.
Figure 4. Relationship between diversified product portfolio and complexity costs
A diversified product portfolio has a positive relationship on the implementation of a modular
design, as the implementation of a modular design has a higher potential to be more
successful when the product portfolio is more diversified. In its way, a higher diversification in
the product portfolio results in higher complexity costs, as discussed above. The
implementation of a modular design directly influences complexity costs, and thus can reduce
the higher complexity costs coming from a diversified product portfolio. High complexity costs
leads to a lower performance.
The relationships from figure 4, as explained above, are from here on considered as a given
for the rest of this research. Meaning that implementing a modular design is a suitable way to
reduce complexity costs in the pilot company.
The development of modular product families aims for the reduction of companies’
22 2012). Thus by identifying and establishing product families, areas for complexity costs savings
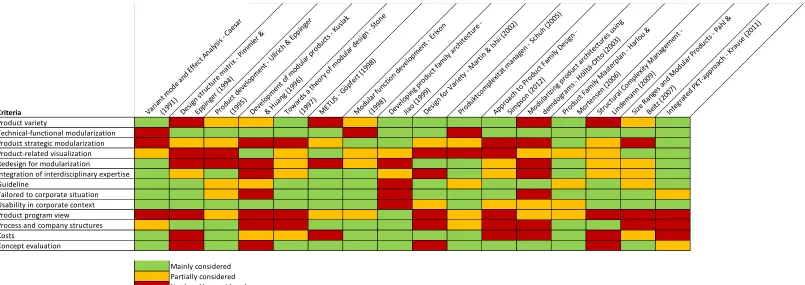
are ascertained. Krause & Ripperda (2013) characterize a selection of significant method for
supporting the development of modular product families. The authors base their selection on
relevant criteria that are deduced from literature and project experience. Table 1 shows the
different methodologies alongside the criteria. A key element in managing variety is to group
and classify similarity within a class of products. Therefore product families are important
when dealing with variants which represents individual instances in a class of similar products.
Product families help to meet the diverse customer demand, while reusing current assets such
as components, modules, processes and knowledge (ElMaraghy H. et al., 2013).
The different articles that are considered in table 1 have been, if available, reviewed. If
needed, the table has been adapted.
Different research into the implementation of a modular design has been done by Kremer &
Gupta (2012), as they reviewed and compared three well-known modularizing methodologies
in order to determine the method that generates the best modular design for a company. The
authors base their conclusion on which method offers the highest ease of assembly while
offering the variety to meet future customer needs.
The first method is the heuristic approach. Stone et al. (2000) describes a heuristic approach
to identify the modules using a function-based decomposition approach. The overall function
of the product is decomposed into sub-functions, starting with a so called black-box model
which represents the product’s overall function. The second task is to develop a chain of
sub-functions that operate on the flow. Afterwards, the three proposed heuristics (i.e. dominant
flow heuristic, branching flow heuristic and conversion-transmission heuristic) are applied on
to the functional model in order to identify the modules in the design problem (Stone, Wood
Table 1. Comparison of different modular product families (Adapted from Krause & Ripperda, 2013, p.3)
Criteria Varia
nt mo de an
d Ef fect A
nalys is - C
aesar (199 1) Design stru cture matri
x - P imml
er &
Eppi nger
(199 4)
Produ ct d
evel opmen
t - U llrich
& E ppin ger (199 5) Devel opmen
t of mo dular
produ cts
Kusia k
& Hu ang (
1996 )
Tow ards a
theo ry o
f mo dular
design - St
one
(199 7)
MET US -
Göpf ert (1
998) Mod ular func tion devel opmen
t - Eri xon
(199 8)
Devel opin
g pro duct
fami ly arc
hitec ture - Jiao (199 9) Design for V
ariet y - M
artin & Is
hii (20 02)
Produ ktco
mplex ität ma
nagen - Sc
huh (200
5)
Appro ach
to P rodu
ct Fa mily
Des ign -
Simp son (201 2) Mod ulari
zing p rodu
ct a rchitec
tures usin
g
demd ogra
ms - Höllt
ä-Ot to (2
003)
Produ ct Fa
mily Mas
terp lan -
Harlo u &
Mort ensen (200 6) Stru ctura
l Comp lexity
Man ageme
nt -
Lindema nn (2
009)
Size R anges
and Mod
ular Produ
cts Pahl & Beitz (200 7) Integ rated PKT -app roac h - K
raus e (2
011)
Product variety
Technical-functional modularization Product strategic modularization Product-related visualization Redesign for modularization
Integration of interdisciplinary expertise Guideline
Tailored to corporate situation Usability in corporate context Product program view Process and company structures Costs
Concept evaluation
The second method, the B-FES approach, builds upon the heuristic approach by Stone et al.
(2000). The B-FES approach by Zhang et al. (2006) reasons that the heuristic approach lacks a
reasoning behind the behaviour of the different components. The objective of the B-FES
approach is to look for the matching behaviour whose functional output can achieve the
desired function (Kremer & Gupta, 2012).
The third method is the decomposition approach. Huang and Kusiak (1998) developed a matrix
representation of the modularity problem, which enables the identification of the modules
even without sufficient information. Modular products are based on suitability and interaction
matrices. The suitability matrices represent to what extent the modules are suitable for the
inclusion in a module, and the interaction matrix represents the interaction among
components. Then, a decomposition approach is followed in order to transform the
interaction and suitability matrices in order to find certain types of modularity.
Based on the review by Kremer & Gupta (2012), the decomposition approach was found to be
the best of the three based on their criteria (i.e. highest ease of assembly and the extent to
which the method meets the variety in customer demand).
Dahmus et al. (2001) introduce a modularity matrix which gives a framework that can help
with designing possible modularity schemes within a company. Architectures that are
generated through this model can then be selected through different approaches such as
potential profits for a firm or through certain selection methods (Dahmus et al., 2001). The
modularity matrix consist of four different steps:
1. Develop separate function structures for each product concepts
2. Union multiple product function structures into a single family function structure
3. Construct a modularity matrix using functions from the family function structure
versus products in the family
4. Use the modularity matrix to aid in constructing different possible product and
portfolio architectures
Despite the benefits of modularization, modular product architecture has potential issues.
25 function sharing, so that they are compatible across other products which might result in
increased variable costs (Ulrich & Tung, 1991). Also, in case of high-powered mechanical
products, modularity is not always desirable. Mainly because with modularity, the product
becomes larger, heavier and less energy efficient. Also, it may become harder to control
adverse effects such as heat dissipation (Whitney, 2004).
Note that a modular design influences inventory management (Duray, 2004). Also, the
possibility for modularization is dependent upon the products a company offers through its
product portfolio (Dahmus, Gonzalez-Zugasti & Otto, 2001; Zamirowski & Otto, 1999). In other
words, not all products or not every product portfolio is suitable for modularization.
Sometimes the variety in products is necessary due to technical reasons, reasons offered by
customers or design reasons (i.e. the shape of the product does not allow standardizatoin).
Among the factors that influence the possibility to modularize the product portfolio are:
traditional market variance, usage variance and technology change (Dahmus et al., 2001).
Also, the way a customer uses the product, the extent to which variety is needed within a
product after purchase, influences the possibility for modularization (Dahmus et al., 2001).
Close interaction with the customer is of key importance when implementing a modular
design. A modularized product that have too many features may decrease customer lifetime
value (Thompson, Hamilton & Rust, 2005).
The next chapter explains which theory is chosen as a modularization method and the reason
for it. This reasoning is followed by the introduction of the flowchart.
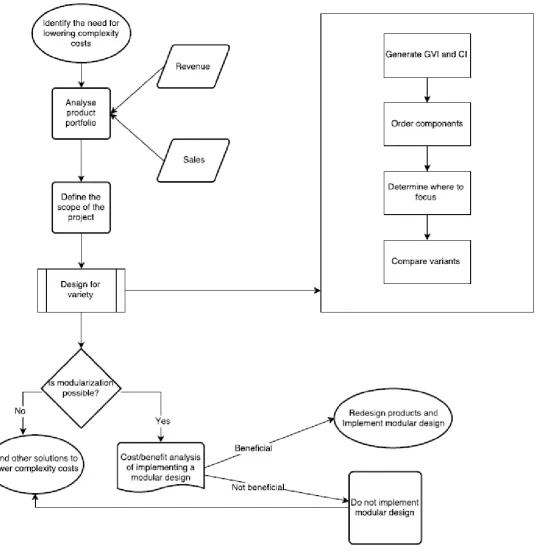
3.3 Development of the process: design for variety as modularization method
Based on the above stated literature review, a process is developed in order to lower
complexity costs through implementing a modular design.
Design for Variety is used as modularization method, as it fulfils the criteria that the method
is suitable for this research: redesign the product portfolio. Also, it fulfils the criteria set by the
pilot company, as clear guidelines are important to reproduce this research for different
product families. The associated cost aspect, which also is considered by Martin and Ishii
26 a big investment at the moment. The other method that is left after these criteria, the Variant
mode and Effect analysis by Caesar (1991), is not suitable since it does not view modularization
from a product view perspective, which is evident in this research.
Design for variety is chosen over the decomposition approach introduced by Kremer & Gupta
(2012), as the decomposition approach is the best approach fulfilling just two criteria: ease of
assembly and meeting future customer needs. The design for variety method fulfils the criteria
from Schuh and company (2012) that both internal and external environment should be taken
into account. The next subchapter gives a detailed description of the design for variety
method.
See figure 5 for an overview of the different steps within the process, presented in a flowchart.
Appendix B shows the meaning of the symbols.
After identifying the need for lowering complexity costs within an organization, an analysis is
made of the current product portfolio. This analysis is used to define the scope of the research.
Information such as number of sales and revenues are used in order to give a profound
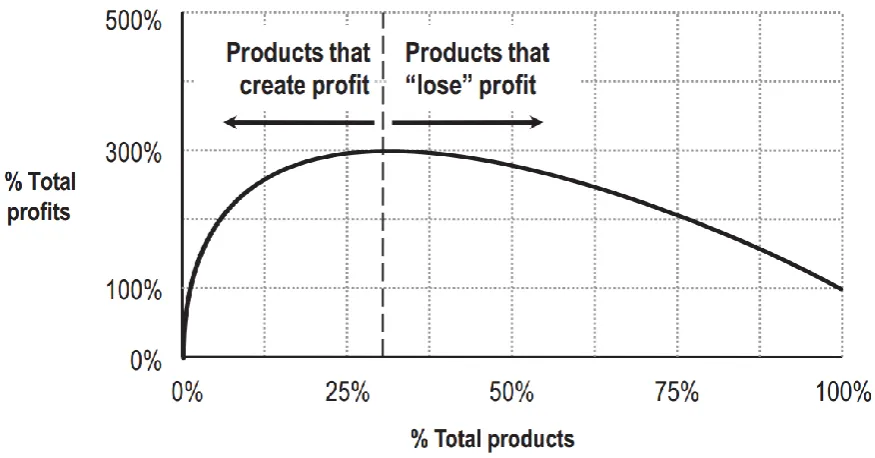
analysis of the product offerings. The so-called Whale Curve shows that the top 20% to 30%
of the product sales to customers, can generate up to 300% of the profits. As profits cannot
exceed 100%, the remaining 70% to 80% loses profits (Wilson, 2009; Kaplan & Narayanan,
2001). Unprofitable customers are customers who order custom products and require the
company to hold inventory (Kaplan & Narayanan, 2001). By using the Whale Curve, the most
profitable products of the company can be identified. In this way, a right scope for the
research has been defined in order to get efficient results (i.e. the products are targeted that
can enhance the performance the most). Figure 6 shows a graphical representation of the
28 Figure 6. The Whale Curve (Wilson, 2009, p.5).
For illustration purposes, an example is given of the usage of the whale curve. After analysing
the current product portfolio, a company can find that 21% of their product portfolio generate
350% of the profit from last year. This means that the remaining 79% of the products
destroyed 250% of the profits from last year. By removing or redesigning those 79% of the
products, profits can be improved.
The design for variety method shows whether or not modularization is possible for the current
product portfolio. If not, other ways to lower complexity costs have to be considered. If
modularization is possible, a cost and benefit analysis has to be made in order to see whether
or not implementing a modular design is beneficial. Before the implementation, a redesign is
made of the products that are influenced by the implementation of the design.
3.4 Design for variety: a modularization method
The design for variety method consists of four distinctive steps. Following these four steps
creates a foundation on where a solid and well-considered decision can be made whether or
not modularization is possible within the current product portfolio. The article by Martin and
29 Step 1: generate the generational variety index (GVI) and the Coupling indices (CI) for the design
The generational variety index, hereafter abbreviated as GVI, is an indicator of which
components are likely to change over time. The index indicates the amount of redesign that
is required for a component to meet the future market requirements (Martin & Ishii, 2002).
The GVI index is based on an estimate of required changes in components from external
factors. Changes in these factors may cause changes in components over time. To generate
the GVI index, seven different steps need to be followed. A graphical representation of these
steps can be found in Appendix C.
1. Determine market and desired life of product platform
The first step is to determine the market which the product is targeting. This market may
change over time. Also, the desired life time of which the product platform has to operate
needs to be determined. As the goal of this research is not to develop a new product platform,
this step is limited to determining the market as customer needs differ between markets.
These customer needs are listed in step two of the GVI index.
2. Create the quality function deployment (QFD) matrix
The quality function deployment (QFD) enlists two phases. The first phase lists the external
customer requirements and their relationship to engineering metrics. The second phase maps
the engineering metrics to the components used in the design. An “X” indicates a relationship
in phase one, whereas in phase two the “X” indicates that the components can affect the
engineering metric (Martin & Ishii, 2002).
3. List expected changes in customer requirements
In the table derived from phase one from the QFD matrix, a column needs to be added to
estimate (qualitatively) the range of change for the customer requirements. The range of
change is determined with high, medium or low whereas high indicates that this is a rapidly
30 4. Estimate engineering metric target values
This step determines the engineering metric target values (EMTV) for the period for the
desired lifetime of the product. The target values could be based on information from conjoint
analysis, trend analysis, expected new markets, or expected competitor introduction of
products. The estimation for this engineering metric values in this research is based on
expected market developments (i.e. what do the customers expect to change) and previous
trends (i.e. amount of products introduced over time). This information is presented in a
percentage to which the component is expected to change within the next five years for the
current market.
5. Calculate normalized target value matrix
Step five consists of normalizing the target values from step four, and plotting them to visually
represent the expected changes. Step five is an optional step within this process of
determining the GVI.
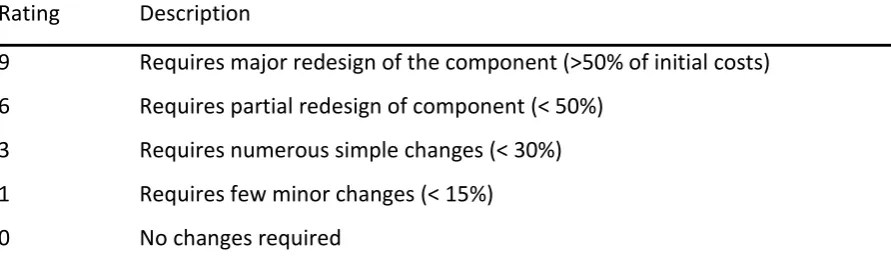
6. Create GVI matrix
The matrix is based on the QFD phase two. To determine the GVI matrix, an estimation of the
costs is made for changing the components to meet the future metric target values. The GVI
matrix uses a 9/6/3/1 rating system for these estimates (see table 2). These costs includes
design effort, tooling and testing). These costs are expressed as a percentage of the original
costs of design.
Rating Description
9 Requires major redesign of the component (>50% of initial costs)
6 Requires partial redesign of component (< 50%)
3 Requires numerous simple changes (< 30%)
1 Requires few minor changes (< 15%)
[image:30.595.72.518.558.691.2]0 No changes required
31 7. Calculate GVI
The GVI is calculated by summing up each of the columns of the GVI matrix. The GVI is an
indicator of the level of component redesign that may be required to meet the future
engineering metrics.
The second index that is calculated is the coupling index (CI). Ulrich (1995) defines coupling as
two coupled components whereas change in one component can require the other
component to change. The CI in this paper is considered as the strength of coupling between
the components in a product. The stronger the coupling, the more likely a change in one
component will require a change in the other (Martin & Ishii, 2002). The process of defining
the CI index consists of six steps. A graphical representation of these steps can be found in
appendix C.
1. Develop basic physical layout for the product
In order to generate the CI, a general layout of the product must be known. From this general
layout, linkages in components can be derived.
2. Draw control volume around components
A control volume (CV) is a boundary around a system indicating the flows into and out of that
system (Martin & Ishii, 2002). In the design for variety method, each component is considered
a control volume.
3. List specification flows required between components
For each control volume, a specifications are listed of what the control volume receives from
each of the other volumes. Also, a list is made on what the control volumes supply to other control volumes. No assumptions of precedencies among the components is made in this
stage.
4. Build a graphical representation of the specification flows
The results of step three can be visualized in a graphic manner. This step is optional, however
32 numerous specifications to other components. These control volumes should be left static, in
order to minimize redesign effort.
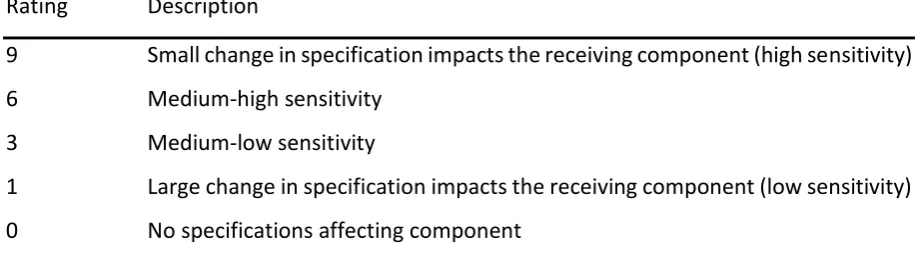
5. Estimate sensitivity of components to changes
For each specification, an estimation of the sensitivity of each component to a small change
in that specification is made. If a small change in the specification requires a change in the
component, it is listed as highly sensitive. Sensitivity is presented on a scale of 0/1/3/6/9, see
table 3. For this rating system, it is assumed that the “impact” caused by a specification change
is equivalent and linear across all components. (Martin & Ishii, 2002).
Rating Description
9 Small change in specification impacts the receiving component (high sensitivity)
6 Medium-high sensitivity
3 Medium-low sensitivity
1 Large change in specification impacts the receiving component (low sensitivity)
[image:32.595.68.527.298.428.2]0 No specifications affecting component
Table 3. CI rating system for sensitivity of specifications.
6. Calculate coupling index
From the coupling matrix, two indices are derived. The sum for a column indicates the strength
of the information supplied by that component to other components and is referred to as
coupling index-supply (CI-S). The sum of a row is information being received by that
component, hence the coupling index-receive (CI-R) (Martin & Ishii, 2002).
A high CI-S indicates that the component receives relatively a lot from other components,
therefore a change in this components probably results in a change in other components. A
high CI-R results in a greater likelihood that a change is necessary due to changes in other
33 Step 2: order the components
The first phase of step two is to rank the components according to the GVI, from highest to
lowest. These are the products that are most likely to change due to external factors (Martin
& Ishii, 2002). Both the CI-R and the CI-S are added to the list of components.
Step 3: determine where to focus efforts (i.e. where to standardize and/or modularize) In order to determine where to focus, the components are categorized into high/low
categories. A component has a relatively high/low index when compared with other
components within the same index. The categorization process is not necessary, however, it
may help visually in the ranking process. Next, an estimation of the nonrecurring engineering
(NRE) costs are determined. Up until this point, costs were not involved. However, costs can
influence the decision on where to modularize significantly.
After adding the costs, a clear picture is given about the consequences of modularizing the
different components (e.g. how it influences other components or to what extent external
drivers are likely to influence future developments) (Martin & Ishii, 2002). Based on these
consequences, a decision can be made on where to focus efforts.
Step 4: develop product platform architecture
The last step of the design for variety method is to develop a product platform architecture.
However, the goal of this research is not to develop a product platform architecture. The goal
is to consider the current product portfolio of the pilot company and point out areas that are
suitable for modularization. Step three of the design for variety method determines these
areas and its feasibility. Therefore, step four is not taken into account when applying the
design for variety approach on the product portfolio of the pilot company.
Nevertheless, the top three components that are most suitable for modularization are
compared between variants and questioned why there is a variance between them. Potential
modularization within these components between the different variants are then submitted
to a cost and benefit analysis. Therefore, the fourth step of the DFV approach is considered as
34
3.5 Other solutions
When modularization is not possible, other solutions arise to reduce complexity costs. Other
solutions aim at directly influencing the product portfolio. Meaning that by applying these
solution, the product portfolio is altered either by cutting out products, changing the assembly
process or consider the customer wishes. By considering key numbers from inventory
management, like inventory turnover and WIP, potential products can be identified that are
not as profitable as the company.
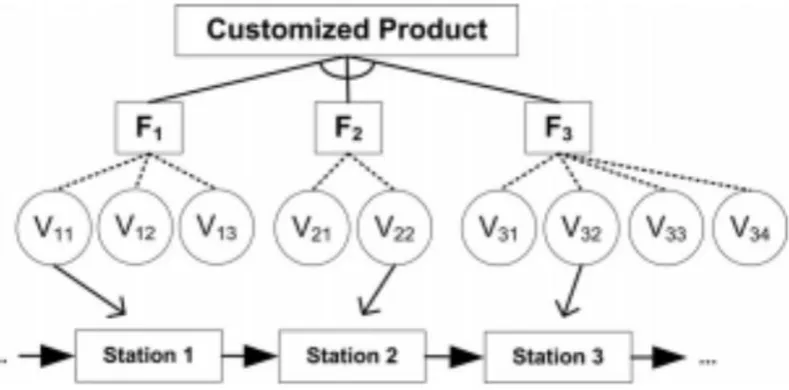
Zhu, Hu, Koren and Marin (2008) point out that a mixed model assembly line is an alternative
[image:34.595.111.506.306.501.2]to reduce complexity cost as well.
Figure 7: a mixed model assembly line
Figure 7 gives such an example of a mixed model assembly line. The customized product has
three features, each with several variants. In figure 7, the possible number of different end
products is 24 (i.e. 2 x 3 x 4). In the mixed-model assembly process, one variant is chosen from
every feature and assembled along the assembly line. Quite often, this assembly process is
accomplished manually where operates at every station must take the right choices
considering choosing the right part, tools, fixture and procedure (Zhu et al., 2008).
Companies throughout the world have embraced mass customization as a way to avoid
unnecessary costs and complexity that comes from the increasingly diverse customer needs
35 meet individual customers’ needs with near mass production efficiency (Tseng & Jiao, 1996).
Mass customization changes the design and production from stock’ to
‘made-to-order’ and thus can also improve inventory and supply chain management efficiency (Tseng &
Hu, 2014). Gilmore & Pine (1996) define four approaches to mass customization:
1. Collaborative customizers conduct a dialogue with individual customers to help them
articulate their needs, to identify the precise offering that fulfills those needs, and to
make customized products for them.
2. Adaptive customizers offer one standard, but customizable, product that is designed
so that users can alter it themselves.
3. Cosmetic customizers present a standard product differently to different customers.
4. Transparent customizers provide individual customers with unique goods or services
without letting them know explicitly that those products and services have been
customized for them.
Not choosing the right approach can lead to unnecessary costs and complexity (Gilmore &
Pine, 1996). However, mass customization is most beneficial with large quantities and also
requires certain technological capabilities (Jiao & Tseng, 1999).
4. Results
The results are structured according to the different steps as proposed in the flowchart (see
figure 5).
4.1 Analysis of the current product portfolio
The complete product list of the pilot company, including small product components and
material parts, consist of over 8000 different parts. Most of these parts are used to assemble
an end-product within the company. Overall, the majority of the revenue comes from their
own products:
36 This means that a filter needs to be added to filter the products that are assembled within the
company. Also, the list consists of all the parts the company used till date, including the ones
that are not used anymore. Moreover, materials as bolts and nuts are included in the product
list as well. Some of the products are also tailored made for customers. After narrowing down
the list, 21 mainly generic products remained. These products are all assembled within the
company, have different variants, have been sold during the last year and influences the total
revenue significantly (i.e. totally over 67% of the total revenue in 2015) (Annual report, 2015).
From these 21 products, the total revenue over 2015 and the first half of 2016 are calculated,
using updated selling prices and the number of sales over 2016 and the sales of 2016 up until
June. The average price per product differs, even within one product line (e.g. ST1, ST2, T1,
TW2), due to the fact that:
“Some products are generic (e.g. ST1, STB, T-series) with different prices for different variants. This means that the average price per product (Revenue / # of sales) may vary per month as it is dependent on which variants are sold, in what amount and to which customer due to price reductions. The ERP-system in place within the company does not allow to specify this per variant within a product line. ” – Employee 1
The results of the analysis of the sales of these 21 products can be found in appendix D.
4.2 Scope
By identifying and establishing product families, areas for complexity costs savings are
ascertained (Ripperda & Krause, 2014; Kremer & Gupta, 2012). The pilot company already
thought about several product families:
“In general, we have three product families: Group 1 consists of the ST1, ST2 and the STB. Group 2 of ST09 and ST07, whereas group 3 consists of T1, T2, T3 and T10. Then we have the W1, W2, W3 which can be seen as a group, however, they do not consist of a motor. Also, at assembly, there is one place where the ‘rest’ is made.” – Employee 1
Product family group 1 generated 36,2% of the total revenue in 2015, and 35,3% in 2016.
37 these contributions towards the revenue, product family 1 seems most appropriate for further
analysis. This is agreed upon by current management:
“Taking ST1, ST2 and STB under consideration for your research seems like a good idea to me”
– Manager 2
A name of a product variant has three parts, for example the ST1-5-3. The ‘ST1’ is named after
the market which it targets, namely the stables (‘stallenbouw’). The 5 represents the torque,
namely 50 Newton meter (Nm). At last, the ‘3’ represents the revolutions per minute. So in
short, the ST1-5-3 is the first series of a drive system that can be applied in stables, with a
torque of 50 Nm and 3 revolutions per minute.
From the ST family, including all the variants, the cost price and selling price have been
validated or recalculated. An example of a calculation of the cost price for the ST2-15-1 can
be found in appendix E. The cost price and selling price consequently lead towards a given
margin per product. Table 4 shows some key numbers regarding the product group and its
variants.
Variant Cost price Selling price Margin Sales in 2015 Sales in 2016
ST1-5-3 *** *** *** *** ***
ST1-10-3 *** *** *** *** ***
ST2-15-1 *** *** *** *** ***
ST2-25-1 *** *** *** *** ***
STB-5-3 *** *** *** *** ***
STB-10-1 *** *** *** *** ***
STB-10-3 *** *** *** *** ***
[image:37.595.79.525.466.620.2]STB-10-3-24Vdc *** *** *** *** ***
Table 4. Key numbers of the product family and its variants
Giving insights into the margins per product itself is of value for the company, as the margins
are currently unknown:
38 “Our margins are very small, some are even negative. However, I do not know the exact ones.” – Employee 1
As the selling price is given as a list that is available within the company, the missing
information regarding margins comes from the lack of a validated and reliable cost price.
Hence, the need for calculating the cost price by hand (Appendix E). This is acknowledged
within the pilot company:
“The cost price within the system are likely not up-to-date. I would not trust them” – Employee 1
The given sales prices are the standard prices. Bigger customers do have their own prices, with
a given reduction (i.e. usually between 10 and 28%). This lowers the margins even more, hence
proving the need for lowering the costs through modularization.
4.3 Design for variety: modularizing the product family
This chapter uses the modularizing method, design for variety, to analyse the product family.
It ends with recommendations for the management, based on a cost and benefit analysis.
Within this analysis, relationships has been made. For illustration, every (sub-)chapter consists
of one or two example of reasoning behind these relationships. For a full view of the reasoning
behind the tables and figures of the GVI, see appendix F.
4.3.1 DFV step one: generate GVI and CI for the design
The first step is to generate the GVI index and the CI indices. To recap, the GVI index is an
indicator of the expected amount of redesign required for a component to meet the future
market requirements. The CI indices are the likelihood that changing a component will require
redesign in other components (CI-S), and the likelihood that a component will change when
other components are redesigned (CI-R) (Martin & Ishii, 2002).
4.3.1.1 Generation of the GVI index
The first step is to determine the market where the design is operating in, as well as the future