MASTER THESIS
PREDICT TO PREVENT:
How to improve workplace safety?
Jellien Tigelaar
SEPTEMBER, 2016
FACULTY OF BEHAVIOURAL, MANAGEMENT AND SOCIAL SCIENCES MASTER COMMUNICATION STUDIES
EXAMINATION COMMITTEE
ABSTRACT
Aim of the study: Workplace accidents, injuries and illnesses continue to be a significant problem in organizations. To manage safety performance in a proactive way, there is a need to know which factors influence workplace safety - and to which extent. Therefore, this study has developed and evaluated a model of Safety Performance Behavior.
Method: A questionnaire was conducted among permanent and temporary employees of a major manufacturer of infant formula. A total of 160 employees participated in this study. To test the
hypotheses, multiple linear regression analyses were performed. Moderator analyses were performed to examine the influence of the moderators. Independent-samples t-tests and ANOVA’s were
conducted to compare scores between different groups.
Results: Safety Knowledge, Safety Motivation and Safety Leadership were found to have a significant impact on Safety Performance Behavior and Safety Compliance. Safety Knowledge and Safety
Motivation were found to have a significant influence on Safety Participation. No significant moderating variables were found. No significant differences were found between the scores from temporary workers and permanent employees on safety performance behavior, safety compliance and safety participation. However, the quantity of safety training was significantly lower assessed by temporary workers than by permanent employees.
INDEX
INTRODUCTION ... 2
1. THEORETICAL FRAMEWORK ... 3
1.1 Defining safety concepts ... 3
1.2 Predicting Safety Performance Behavior ... 3
1.3 Person-related factors ... 4
1.4 Situation-related factors ... 5
1.5 Moderators... 6
1.6 Summary ... 7
2. METHOD ... 8
2.1 Procedure ... 8
2.2 Instrument ... 8
2.2.1 Dependent variables ... 8
2.2.2 Predictors ... 9
2.3 Participants ... 9
2.4 Data analysis ... 10
3. RESULTS ... 11
3.1 Predicting Safety Performance Behavior ... 11
3.2 Predicting Safety Compliance ... 11
3.3 Predicting Safety Participation... 12
3.4 Moderators... 13
3.5 Comparison between groups... 13
3.5.1 Contract type ... 13
3.5.2 Accident history ... 14
3.5.3 Organizational tenure ... 14
3.6 Summary ... 15
4. CONCLUSION & DISCUSSION ... 17
4.1 Discussion ... 17
4.2 Implications ... 17
4.3 Limitations and future research ... 18
4.3 Conclusion ... 18
REFERENCES ... 19
APPENDIX A: QUESTIONNAIRE ... 25
INTRODUCTION
‘Man is injured in workplace accident in Waalwijk’ (Brabants Dagblad, 2016), ‘Injured person in workplace accident in Enschede, emergency helicopter at the scene’ (Algemeen Dagblad, 2016) and ‘Fatal workplace accident in Zoetermeer’ (Tubantia, 2015). Regrettably, headlines like these are no exception in Dutch newspapers. In the Netherlands, annually approximately 230,000 employees have a workplace accident, which means that on average daily more than 600 accidents occur (RIVM, 2016).
These workplace accidents and the resulting injuries and illnesses continue to be a significant problem in organizations. Therefore, researchers have devoted much effort to examining workplace safety and the importance of understanding the factors influencing safety-behavior is well-established. However, in many organizations, safety is still managed in a reactive way. When accident frequency rates increase, the management responds. Once the problem has been addressed, frequency rates are expected to decrease.
However, safety performance can be managed in a more proactive way. Parker et al. (2006) describe this proactive level of safety culture as ‘trying to anticipate problems before they arise’ (p. 555). To achieve a proactive level of safety culture, there is a need to know which factors influence workplace safety.
This case study is performed at a major manufacturer of infant formula. An organization in which safety plays an important role for both the employees and the product that is produced. The
company’s safety management wants to achieve a proactive level of safety culture in their
organization, in order to create a safe workplace by anticipating problems before they arise. Therefore, it is important to know which factors influence safety performance behavior.
For this organization is growing fast, a large number of temporary workers was hired. The safety management suspected there was a difference between temporary workers and permanent
employees in terms of safety performance behavior. Therefore, the differences between these groups are examined.
1. THEORETICAL FRAMEWORK
In this theoretical framework, safety concepts are defined. Furthermore, possible predictors of safety performance behavior are discussed. Hypotheses are formulated and the conceptual research model is shown.
1.1
Defining safety concepts
The lack of clear and consistent construct definitions and conceptualizations in safety literature (Clarke & Robertson, 2005) is problematic. Such definitions are critical to the organization as they facilitate the (further) development of safety knowledge. Therefore, a conceptualization will be provided based on contemporary safety literature.
The term safety performance can refer to two different concepts. Sometimes safety performance refers to organizational safety outcomes, such as the number of injuries per year. On the other side, safety performance can refer to ‘a metric for safety-related behaviors of individuals’ (Christian, Bradley, Wallace, & Burke, 2009, p 1104). Making the distinction between safety-related behaviors and safety outcomes is important, because they might each have different relationships with
antecedents (Christian et al., 2009). Therefore, we consider safety performance behaviors and safety outcomes to be distinct.
Safety performance behavior is defined by Burke, Sarpy, Tesluk, and Smith-Crowe (2002) as ‘actions or behaviors that individuals exhibit in almost all jobs to promote health and safety of workers, clients, the public and the environment’ (p. 432). In contrast to safety performance behaviors, ‘safety outcomes are tangible events or results such as accidents, injuries or fatalities’ (Christian et al., 2009,
p. 1104).
1.2
Predicting Safety Performance Behavior
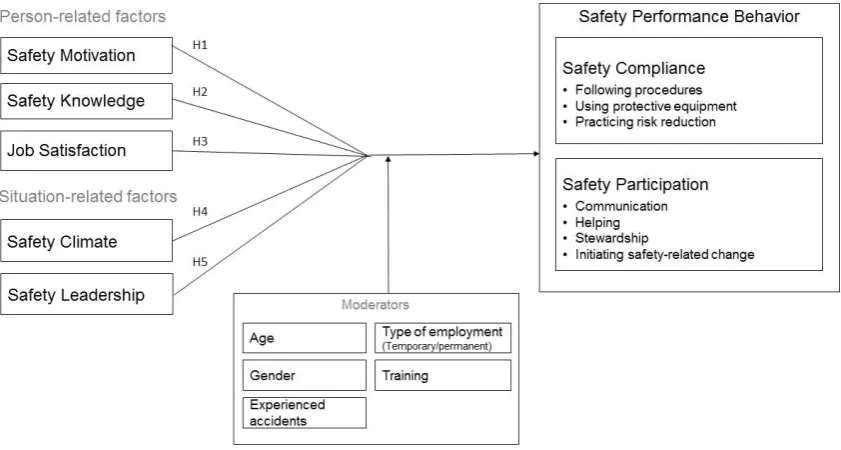
Multiple studies focusing on drivers of safety behavior found that unsafe behavior correlates with higher injury rates (i.e. Andriessen, 1978; Burke et al., 2002; Prussia, Brown & Willis, 2003). The presented (conceptual) model of the different factors influencing safety behaviors in this study is built upon the ‘integrative model of workplace safety’ of Christian et al. (2009). Their model (Figure 1) is based upon Neal & Griffin’s (2004) model of workplace safety, which is grounded in Campbell et al.’s 1993) theory of performance.
The variables predicting safety performance are classified as person-related or situation-related. The dependent variable safety performance behavior consists of the distinguished constructs safety compliance and safety participation. This distinction is similar to that between task and contextual performance in the job performance literature (Christian et al., 2009).
Safety compliance refers to activities in order to maintain workplace safety, following the
requires behavior beyond the formal work role. Therefore, safety participation is also called safety citizenship behavior (Hofmann et al., 2003), referring to the concept of organizational citizenship behavior which refers to extra-role voluntary behaviors beneficial to the organization (Bateman & Organ, 1983; Smith et al., 1983).
1.3
Person-related factors
Safety motivation is a direct determinant of performance behaviors. It is defined as ‘an individual’s willingness to exert effort to enact safety behaviors and the valence associated with those behaviors’ (Neal & Griffin, 2006, p. 947). According to Andriessen (1978), people are more careful when they recognize that safer behavior really does contribute to accident reduction. Furthermore, safety motivation is determined by group standards and group cohesion and strongly determined by leadership and safety standards of the management (c.f. Andriessen, 1978; Burk et al. 2002). Safety motivation is expected to be strongly related to safety performance behavior. In line with Neal and Griffin (2000), safety motivation is expected to be more positively related to safety participation than to safety compliance.
Hypothesis 1: Higher safety motivation will lead to higher safety performance behavior. Hypothesis 1a: Higher safety motivation will lead to higher safety compliance.
Hypothesis 1b: Higher safety motivation will lead to higher safety participation.
Hypothesis 1c: Higher safety motivation will lead to a higher score on safety participation than
on safety compliance.
[image:6.595.69.506.141.387.2]Safety knowledge is expected to be strongly related to safety performance behavior. After all, an individual must understand how to perform his or her work safely and be skilled enough to carry out the work in compliance with safety procedures. Safety knowledge is (in contrast to safety motivation) expected to be higher related to safety compliance than to safety participation (Neal & Griffin, 2000).
Hypothesis 2: Higher safety knowledge will lead to higher safety performance behavior. Hypothesis 2a: Higher safety knowledge will lead to higher safety compliance.
Hypothesis 2b: Higher safety knowledge will lead to higher safety participation.
Hypothesis 2c: Higher safety knowledge will lead to a higher score on safety compliance than
on safety performance.
Job Satisfaction is defined as “a pleasurable or positive emotional state resulting from the appraisal of one’s job or job experiences” (Locke, 1976, p. 1300). When job satisfaction is increased, on-task activities are enhanced, leading to greater attention to safety motivation, knowledge, and compliance (Probst, 2002). Therefore, job satisfaction is expected to be related to safety performance behavior.
Hypothesis 3: Higher job satisfaction will lead to higher safety performance behavior. Hypothesis 3a: Higher job satisfaction will lead to higher safety compliance.
Hypothesis 3b: Higher job satisfaction will lead to higher safety participation.
Given the weakly supported relationships between personality characteristics and safety performance behavior (Andriessen, 1978) and the scope of the research, the variable personality characteristics in not examined in this study.
1.4
Situation-related factors
Safety climate is a meaningful predictor of safety performance behaviors, in particular safety
participation (Clarke, 2006a). Psychological safety climate and group safety climate are distinguished. Psychological safety climate is defined as ‘individual perceptions of safety-related policies, practices, and procedures pertaining to safety matters that affect personal well-being at work’ (Christian et al., 2009, p. 1106). Safety behavior is also determined by group standards (Andriessen, 1978). Group-level safety climate is defined as ‘shared perceptions of work environment characteristics as they pertain to safety matters that affect a group of individuals’ (Christian et al., 2009, p. 1106).
According to Neal and Griffin (2004), safety climate includes the following factors: management commitment, human resources management practices, safety systems, supervisory support, internal group processes, boundary management, risk and work pressure.
Hypothesis 4: Higher safety climate will lead to higher safety performance behavior. Hypothesis 4a: Higher safety climate will lead to higher safety compliance.
Hypothesis 4b: Higher safety climate will lead to higher safety participation.
Hypothesis 4c: Higher safety climate will lead to a higher score on safety participation than on
safety compliance.
Leadership refers to perceptions of how a manager behaves, acts, and achieves organizational or group objectives in general (Christian et al., 2009). Employees who have positive feelings towards their leader are more likely to reciprocate when possible. Therefore, leadership quality has been found to be related to occupational safety and safety outcomes (Hofmann et al., 2003; Hofmann &
Morgeson, 1999; Zohar, 2002a; Zohar & Luria, 2003). Clarke (2013) state that a combination of both transformational and active transactional leadership styles should result in effective management of workplace safety, because it brings together leader behaviors that ensure safety through both safety compliance and the encouragement of positive engagement with safety. Safety Motivation is strongly determined by leadership and safety standards of the leader (Andriessen 1978). In line with
Andriessen, Hofmann et al. (2003) found that high-quality relationships with supervisors predicted employees’ safety-related citizenship behaviors. Therefore, Safety Leadership is expected to be more positively related to safety participation than to safety compliance.
Hypothesis 5: Higher safety leadership will lead to higher safety performance behavior. Hypothesis 5a: Higher safety leadership will lead to higher safety compliance.
Hypothesis 5b: Higher safety leadership will lead to higher safety participation.
Hypothesis 5c: Higher safety leadership will lead to a higher score on safety participation than on safety compliance.
1.5
Moderators
The moderators age, gender, perceived quality of training, type of employment and experienced accidents are included in the model.
Age is not found to be particularly related to accident rates (Siu, Philips & Leung, 2003), but safety
attitude can be related to age with older workers exhibiting more positive attitudes towards safety (Siu et al., 2003). In contrast, Salminen (2004) showed that young workers had a higher injury rate than older workers. Young men were a risk group for occupational injuries. However, the injuries of young workers were reported as less often fatal than those of older workers (Salminen, 2004). Given these different findings, it is hard to predict the moderating influence of age on safety performance behavior. Although Jensen et al. (2014) state that there is a lack of proof that gender is important in safety research, it is never been invalidated. For example, women might be less likely to have accidents due to better observance of safety precautions (Wingard, 1984).
Safety training is considered by most researchers as an important safety tool in reducing accidents
(e.g. Hinze & Harrison, 1981; Lingard & Rowlinson, 1994).
Cree and Kelloway (1997) suggested that at an individual level, a negative accident history had a significant impact on risk perceptions. These perceptions increased the willingness to participate in health and safety initiatives. Therefore, the moderator experienced accidents is also included in the model.
1.6
Summary
The aim of this research is to examine what factors contribute to a safe working environment. According to safety literature, Safety Motivation, Safety Knowledge, Job Satisfaction, Safety Climate and Safety Leadership appear to be important predictors of Safety Performance Behavior. Figure 2 and Figure 3 show the conceptual research model.
[image:9.595.69.490.249.474.2] [image:9.595.70.518.531.687.2]Figure 3. Research model B
Figure 2. Research model A
2. METHOD
To test the hypothesized relations, this study conducted a questionnaire among permanent and temporary employees of a major manufacturer of infant formula.
2.1
Procedure
Employees of the departments warehouse and production were invited to participate in this study by e-mail. In this e-mail employees were informed about the goal and the task of the study and the small reward they would receive in return for their participation. During the lunch break on five different occasions in late October and early November 2015 employees had the opportunity to fill in the hardcopy questionnaire and the informed consent form. The researcher was present so that possible questions could be answered. In order to ensure full anonymity, the questionnaire and informed consent form could be submitted in two separate boxes. After taking part in the study the respondents were thanked for their participation and there was a small reward (cake) for the respondents.
2.2
Instrument
The questionnaire (Appendix A) consisted of four parts. The first part consisted of a separate page with the introduction and the informed consent form.
The second part of the questionnaire consisted of 37 statements, five for each of the seven constructs followed by two items to measure the quantity and quality of safety training. The respondents had to answer the statements on a five-point Likert scale, ranging from “1 = strongly disagree” to “5 = strongly agree”.
Third, respondents had to answer five questions related to their perception of the safety at work (on a scale from one to ten), and four questions regarding their own accident history and the accident history of their colleagues.
The last part of the questionnaire consisted out of questions about the respondent’s demographics and provided a textbox for questions and/or remarks.
2.2.1
Dependent variables
The dependent variable in this study was Safety Performance Behavior (α = .81). A distinction was made between safety compliance and safety participation.
The construct Safety Compliance (α = .73) was evaluated by five items based on the scale used by Neal and Griffin (2006) and the safety rules implemented by the organization. Sample items include “I use all necessary safety equipment to do my job”, “I follow correct safety rules and procedures while carrying out my job” and “I ensure the highest levels of safety when I carry out my job”.
2.2.2 Predictors
Safety Knowledge (α = .61) was evaluated by five items based on the scale used by Vinodkumar and Bhasi (2010) and the safety rules implemented by the organization. Sample items were “I know how to perform my job in a safe manner”, “I know how to use safety equipments” and “I know how to reduce the risk of accidents and incidents in the workplace”.
Five items based on the scale used by Vinodkumar and Bhasi (2010) were used to assess Safety Motivation (α = .63). The item “I don’t think a safe workplace is important” was removed in order to increase the reliability of the construct. Example items are “I feel that it is important to maintain safety at all times”, “I believe that safety at workplace is a very important issue” and “I feel that it is important to encourage others to use safe practices”.
Participants’ Job Satisfaction (α = .76) was assessed by five items, partly based on the work by Barling, Iverson and Kelloway (2003). Sample items include “I am satisfied with management treatment, “This is a good place to work” and “I often think about leaving this job”.
Safety Climate (α = .71) was evaluated by five items. The items were based on the scale used by Neal and Griffin (2006). Example items are “Management places a strong emphasis on workplace health and safety”, “Safety is given a high priority by management” and “Management considers safety to be important”.
Five items based on the scale used by Lu and Yang (2010) assessed Safety Leadership (α = .75). Sample items are “My managers consider safety to be important”, “My managers stress the
importance of wearing personal protective equipment” and “My manager shows interest in the safety of workers”.
The Cronbach’s alpha of almost all of the variables exceeded the score of .70, the generally considered minimum acceptable criterion of instrument internal reliability (Cicchetti, 1994). The only exceptions to this were Safety Knowledge (α = .61) and Safety Motivation (α = .63). However, these scales were retained as a research instrument since their scores were still within the latitude of acceptance.
2.3
Participants
Permanent (n = 102) and temporary employees (n = 58) of the warehouse and production departments were asked to participate in the study. A total of 164 respondents filled in the
questionnaire. Four respondents were removed due to missing essential values, which resulted in a total of 160 valid responses.
2.4
Data analysis
After the data collection, all data were imported and analyzed in SPSS software (IBM SPSS Statistics, version23). First, four negative formulated items were rescaled. A reliability analysis was executed to test the reliability of the constructs. Based on this reliability analysis, a total of five items were removed in order to increase the reliability of the constructs Safety Knowledge, Safety Motivation, Safety Climate, Safety Participation and Safety Performance Behavior.
Descriptive statistics of the studied variables were analyzed. To test the hypotheses in the current study, multiple linear regression analyses were performed. Moderator analyses were executed to examine whether the relationship between independent variables and dependent variables was affected by moderators. Due to the low number of female respondents (n = 17), the potential
3. RESULTS
Multiple linear regression analyses were performed to test the hypotheses and the research model. An overview of the variables, their predictors and the corresponding coefficients and significances is shown in the tables below.
3.1
Predicting Safety Performance Behavior
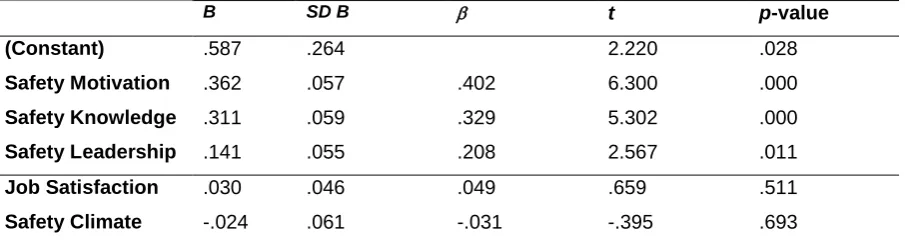
Table 1 shows coefficients of the predictors of safety performance behavior. The assumptions of independence of errors, linearity, homoscedasticity, unusual points and normality of residuals were met. Using the enter method, it was found that the predictors explain a significant amount of the variance in safety performance behavior (F(5, 154) = 33.92, p = .000, R² = .724).
[image:13.595.74.527.366.488.2]Safety Motivation (p = .000), Safety Knowledge (p = .000) and Safety Leadership (p = .011) were found to have a significant impact on Safety Performance Behavior. Therefore, the hypotheses 1, 2 and 5 were supported.
Table 1
Coefficients predictors Safety Performance Behavior
B SD B t p-value
(Constant) .587 .264 2.220 .028
Safety Motivation .362 .057 .402 6.300 .000
Safety Knowledge .311 .059 .329 5.302 .000
Safety Leadership .141 .055 .208 2.567 .011
Job Satisfaction .030 .046 .049 .659 .511
Safety Climate -.024 .061 -.031 -.395 .693
The predictors Job satisfaction and Safety Climate did not significantly predict safety performance behavior. Therefore, hypotheses 3 and 4 were not supported.
The model was retested excluding these predictors (Appendix B). It was found this model explained a slightly lower significant amount of the variance in safety performance behavior (R² = .723).
3.2
Predicting Safety Compliance
Table 2
Coefficients predictors Safety Compliance
B SD B t p-value
(Constant) .384 .301 1.278 .203
Safety Motivation .257 .065 .253 3.926 .000
Safety Knowledge .361 .067 .339 5.414 .000
Safety Leadership .187 .063 .245 2.990 .003
Job Satisfaction .079 .053 .113 1.513 .132
Safety Climate .037 .070 .042 .530 .597
The predictors Job satisfaction and Safety Climate did not significantly influence safety compliance. Therefore, the hypotheses 3a and 4a were not supported. The model was retested excluding these predictors (Appendix B). It was found this model explained a lower significant amount of the variance in safety compliance (R² = .711).
3.3
Predicting Safety Participation
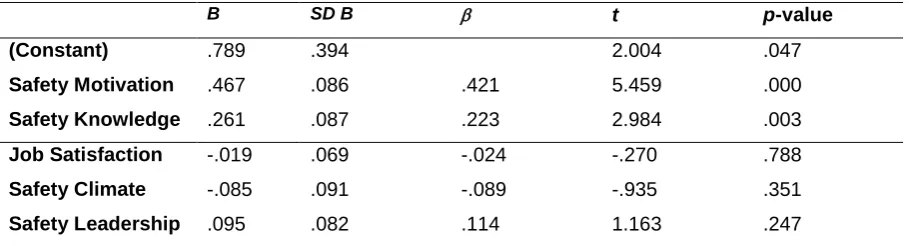
Table 3 shows coefficients of the predictors of safety participation. The assumptions of independence of errors, linearity, homoscedasticity, unusual points and normality of residuals were met. The
[image:14.595.72.527.481.604.2]predictors explained a significant amount of the variance in safety participation (F(5, 154) = 13.67, p = .000, R² = .554). Safety Motivation (p = .000) and Safety Knowledge (p = .003) were found to have a significant impact on Safety Participation. Therefore, the hypotheses 1b and 2b were supported.
Table 3
Coefficients predictors Safety Participation
B SD B t p-value
(Constant) .789 .394 2.004 .047
Safety Motivation .467 .086 .421 5.459 .000
Safety Knowledge .261 .087 .223 2.984 .003
Job Satisfaction -.019 .069 -.024 -.270 .788
Safety Climate -.085 .091 -.089 -.935 .351
Safety Leadership .095 .082 .114 1.163 .247
The predictors Job satisfaction, Safety Climate and Safety Leadership did not significantly influence safety participation. Therefore, the hypotheses 3b, 4b and 5b were not supported. The model was retested excluding these predictors (Appendix B). The predictors explained a lower significant amount of the variance in safety participation (R² = .548).
was supported. Safety Climate and Safety Leadership were not more positively related to Safety Participation than to Safety Compliance. Therefore, hypotheses 4c and 5c were not supported.
3.4
Moderators
Moderator analyses were executed to examine whether the relationship between independent
variables and dependent variables was affected by moderators. First the independent variable and the moderator were centralized in SPSS, then multiple regression analyses were performed. No
significant moderating effects were found for the hypothesized moderators age, experienced accidents, type of employment and training affecting the influence of Safety Motivation, Safety
Knowledge, Job Satisfaction, Safety Leadership and Safety Climate on Safety Performance Behavior.
3.5
Comparison between groups
Independent-samples t-tests and ANOVA’s (F-tests) were conducted to compare the scores on multiple factors between different groups of respondents, based on contract type and accident history.
3.5.1
Contract type
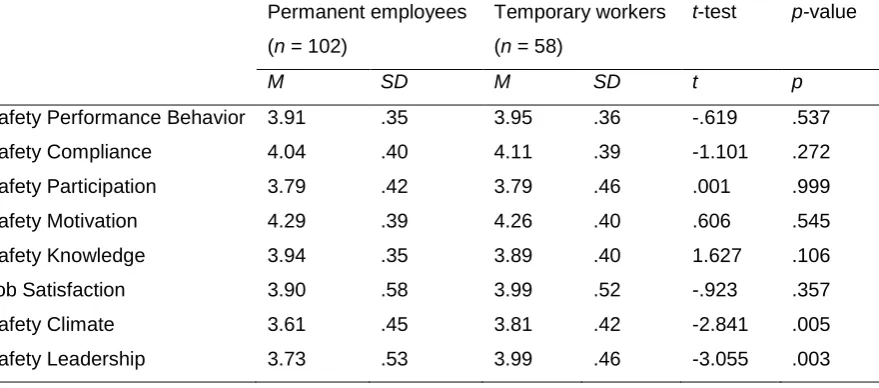
Table 4 shows the results of a t-test comparing permanent employees and temporary workers. No significant difference was found between the scores from temporary workers and permanent
[image:15.595.84.524.510.704.2]employees on safety performance behavior. Temporary workers and permanent employees did also not significantly differ in the scores on safety compliance, safety participation, safety motivation, safety knowledge and job satisfaction. However, temporary workers scored significantly higher on safety climate and safety leadership than permanent workers.
Table 4
Results comparing permanent employees and temporary workers on Safety Performance Behavior
Permanent employees (n = 102)
Temporary workers (n = 58)
t-test p-value
M SD M SD t p
Safety Performance Behavior 3.91 .35 3.95 .36 -.619 .537
Safety Compliance 4.04 .40 4.11 .39 -1.101 .272
Safety Participation 3.79 .42 3.79 .46 .001 .999
Safety Motivation 4.29 .39 4.26 .40 .606 .545
Safety Knowledge 3.94 .35 3.89 .40 1.627 .106
Job Satisfaction 3.90 .58 3.99 .52 -.923 .357
Safety Climate 3.61 .45 3.81 .42 -2.841 .005
Safety Leadership 3.73 .53 3.99 .46 -3.055 .003
temporary workers. In contrast, no significant difference was found between scores of temporary workers and permanent workers on perceived safety training quality.
Table 5
Results comparing permanent employees and temporary workers on Safety Training
Permanent employees (n = 102)
Temporary workers (n = 58)
t-test p-value
M SD M SD t p
Perceived training quantity 3.91 .69 3.43 .99 3.596 .000
Perceived training quality 3.69 .69 3.53 .88 1.207 .229
3.5.2
Accident history
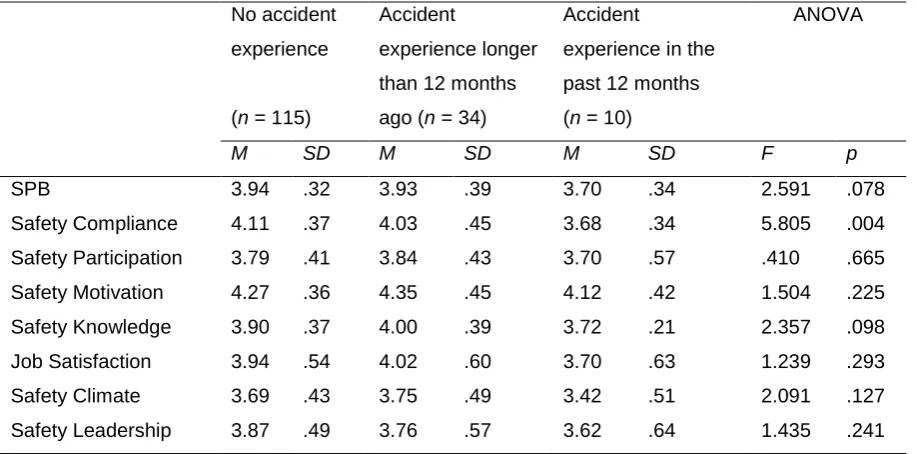
[image:16.595.71.530.342.569.2]Table 6 shows the results of an ANOVA (F-test). A significant difference between the three groups was found for safety compliance.
Table 6
Results comparing accident experiences on Safety Performance Behavior
No accident experience
(n = 115)
Accident
experience longer than 12 months ago (n = 34)
Accident
experience in the past 12 months (n = 10)
ANOVA
M SD M SD M SD F p
SPB 3.94 .32 3.93 .39 3.70 .34 2.591 .078
Safety Compliance 4.11 .37 4.03 .45 3.68 .34 5.805 .004
Safety Participation 3.79 .41 3.84 .43 3.70 .57 .410 .665
Safety Motivation 4.27 .36 4.35 .45 4.12 .42 1.504 .225
Safety Knowledge 3.90 .37 4.00 .39 3.72 .21 2.357 .098
Job Satisfaction 3.94 .54 4.02 .60 3.70 .63 1.239 .293
Safety Climate 3.69 .43 3.75 .49 3.42 .51 2.091 .127
Safety Leadership 3.87 .49 3.76 .57 3.62 .64 1.435 .241
Post hoc comparisons using the Bonferroni test indicated that the mean scores on Safety Compliance for the group without accident experience (M = 4.11, SD = .37) and the group with an accident
experience longer than 12 months ago (M = 4.03, SD = .45) were significantly higher than the mean score of the group with an accident experience in the past 12 months (M = 3.68, SD = .34).
3.5.3
Organizational tenure
No significant differences were found for the scores of different groups based on tenure in de organization on Safety Performance Behavior, Safety Compliance, Safety Participation, Safety Motivation, Safety Knowledge, Job Satisfaction and Safety Leadership.
conditions ‘less than half a year’ (n = 32) and ‘ten years or more’ (n = 48) (F = 2.301, p = .048). Post hoc comparisons using the Bonferroni test indicated that the mean score on Safety Climate for the group with a tenure of ‘less than half a year’ (M = 3.88, SD = .33) was significantly higher than the mean score of the group with a tenure of ‘ten years or more’ (M = 3.56, SD = .46).
[image:17.595.81.507.234.465.2]3.6
Summary
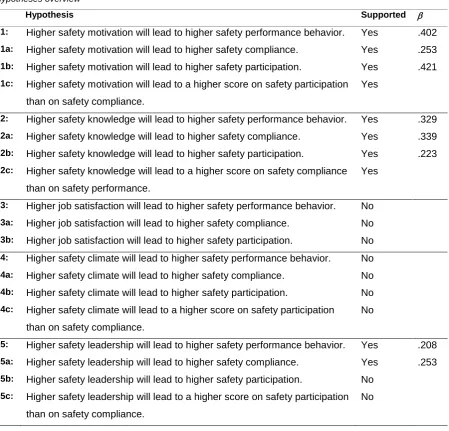
[image:17.595.80.497.525.675.2]Figure 4 and 5 provide the tested research model and its results. Table 7 provides an overview of the hypotheses and their results. A total of three out of the five main hypotheses were supported.
Figure 3. Results research model A
Table 7
Hypotheses overview
Hypothesis Supported
1: Higher safety motivation will lead to higher safety performance behavior. Yes .402
1a: Higher safety motivation will lead to higher safety compliance. Yes .253
1b: Higher safety motivation will lead to higher safety participation. Yes .421
1c: Higher safety motivation will lead to a higher score on safety participation
than on safety compliance.
Yes
2: Higher safety knowledge will lead to higher safety performance behavior. Yes .329 2a: Higher safety knowledge will lead to higher safety compliance. Yes .339
2b: Higher safety knowledge will lead to higher safety participation. Yes .223
2c: Higher safety knowledge will lead to a higher score on safety compliance than on safety performance.
Yes
3: Higher job satisfaction will lead to higher safety performance behavior. No 3a: Higher job satisfaction will lead to higher safety compliance. No 3b: Higher job satisfaction will lead to higher safety participation. No
4: Higher safety climate will lead to higher safety performance behavior. No 4a: Higher safety climate will lead to higher safety compliance. No 4b: Higher safety climate will lead to higher safety participation. No 4c: Higher safety climate will lead to a higher score on safety participation
than on safety compliance.
No
5: Higher safety leadership will lead to higher safety performance behavior. Yes .208
5a: Higher safety leadership will lead to higher safety compliance. Yes .253 5b: Higher safety leadership will lead to higher safety participation. No
5c: Higher safety leadership will lead to a higher score on safety participation
than on safety compliance.
4. CONCLUSION & DISCUSSION
This study has developed and evaluated a model of safety performance behavior, to examine what factors contribute to safety performance behavior. A total of three out of the five main hypotheses were supported.
4.1
Discussion
In line with the literature (Christian et al., 2009; Hofmann et al., 2003; Hofmann & Morgeson, 1999; Neal & Griffin, 2000), safety motivation and safety knowledge were found to have a significant impact on safety performance behavior, safety compliance and safety participation.
Safety leadership was found to have a significant influence on safety performance behavior and safety compliance, in line with literature (Christian et al., 2009; Neal & Griffin, 2000; Hofmann et al., 2003; Hofmann & Morgeson, 1999; Zohar, 2002a; Zohar & Luria, 2003). However, safety leadership did not significantly influence safety participation. This result is remarkable, because safety leadership was expected to be more positively related to safety participation than to safety compliance
(Andriessen, 1978; Christian, 2009; Hofmann et al., 2003). One explanation for the difference between this finding and the literature could be the specific organizational setting of this study, because every organization is different. It is possible that the respondents in this study were more likely to follow and listen to their supervisor in terms of compliance rather than in terms of motivational aspects.
The predictor job satisfaction did not significantly influence safety performance behavior, safety compliance and safety participation, in contrast to (Probst, 2002). According to Judge, Thoresen, Bono, and Patton (2001) the findings in literature linking job attitudes with performance are equivocal. A possible explanation might be that attitudes are a distal, indirect and imperfect predictor of behavior (Fazio & Williams, 1986).
Furthermore, the predictor safety climate did not significantly influence safety performance
behavior, safety compliance and safety participation, in contrast to the literature (Griffin & Neal, 2000; Neal, Griffin, & Hart, 2000; Rundmo, 1992). However, according to Cooper and Phillips (2004) researchers have struggled to find empirical evidence to demonstrate actual links between safety climate and safety performance. Johnson (2007) recognizes this problem and recommends the use of the Zohar Safety Climate Questionnaire (Zohar & Luria, 2005) Although the used safety climate scale in this study based on Neal and Griffin (2006) was reliable, the ZSCQ may be more reliable and valid. In line with Neal and Griffin (2000), safety knowledge was more positively related to safety
compliance than to safety participation. On the other hand, safety motivation was more positively related to safety participation than to safety compliance.
4.2
Implications
regulations (Neal & Griffin, 2002). However, this study suggests that managers should think about participation as well as compliance. Safety motivation was found to be an important predictor of safety participation. To increase employees’ safety motivation, it is important that employees realize that working safely really does help to reduce the number of accidents (Andriessen, 1978). A supervisor can contribute to this awareness. It is also important to promote the importance of safety via the group. Group discussions may for instance have the advantage that employees feel more involved in the work and feel responsible.
According to Hale (1990, p. 4), “Imposed safety rules are often seen as in conflict with other
imposed rules of a higher priority”. In this study, the employees said they found it sometimes difficult to work safely due to time constraints. If management sets safety as their priority but does not act like it, the behavior that is seen as heroic can be for instance that of production instead of safety. Safety must always be given top priority.
Training and support is important to maximize safety motivation and safety knowledge, which in turn leads to safe behaviors and fewer accidents and injuries (Christian et al., 2009). In this study, temporary workers rated the quantity of the training significantly lower than permanent employees. However, these two groups did not differ in terms of safety performance behavior.
4.3
Limitations and future research
Due to the low number of female respondents, it was not possible to examine the relationship between gender and Safety Performance Behavior. In line with Jensen et al. (2014) who addresses the lack of literature on this topic, more research on this topic is recommended. However, this might be difficult due to the low number of female employees in high-risk industries.
In this study, safety outcomes were not examined in relation to safety performance behavior. This could be a possible future research avenue. A difficult task, considering privacy and anonymity. This study didn’t examine how person- and situation-related factors interact. A possible future research avenue might be to examine how the predictors in this study’s model interact to influence safety performance behavior.
4.3
Conclusion
REFERENCES
Andriessen, J., (1978). Safe behavior and safety motivation. Journal of Occupational Accidents, 1, 363–376. doi:10.1016/0376-6349(78)90006-8
Barling, J., Iverson, R. D., & Kelloway, E., (2003). High-quality work, job satisfaction, and occupational injuries. Journal of Applied Psychology, 88(2), 2276-283. doi:10.1037/0021-9010.88.2.276
Bateman, T. S., & Organ, D. W. (1983). Job satisfaction and the good soldier: The relationship between affect and employee “citizenship”. Academic of Management Journal, 26, 587-595. doi:10.2307/255908
Burke, M. J., Sarpy, S.A., Tesluk, P. E., & Smith-Crowe, K. (2002). General safety performance: A test of a grounded theoretical model. Personnel Psychology, 55, 429-457. doi:10.1111/j.1744-
6570.2002.tb00116.x
Campbell, J. P., McCloy, R. A., Oppler, S. H., & Sager, C. E. (1993). A theory of performance. In N. Schmitt & W.C. Borman (Eds.), Personnel Selection in Organizations (p. 35-70). San Francisco: Jossey-Bass.
Cicchetti, D. V. (1994). Guidelines, criteria, and rules of thumb for evaluating normed and
standardized assessment instruments in psychology. Psychological Assessment, 6(4), 284–290. doi: 10.1037/1040-3590.6.4.284
Christian, M. S., Bradley, J. C., Wallace, J. C., & Burke, M. J. (2009). Workplace safety: A meta- analysis of the roles of person and situation factors. Journal of Applied Psychology, 94(5), 1103- 1127. doi:10.1037/a0016172
Clarke, S. (2006a). The relationship between safety climate and safety performance: A meta-analytic review. Journal of Occupational Health Psychology, 11, 315–327. doi:10.1037/1076-8998.11.4.315
Clarke, S. (2006b). Safety climate in an automobile manufacturing plant: The effects of work
environment, job communication and safety attitudes on accidents and unsafe behavior. Personnel Review, 35, 413–430. doi:10.1108/00483480610670580
Clarke, S. (2013). Safety leadership: A meta-analytic review of transformational and transactional leadership styles as antecedents of safety behaviours. Journal of Occupational and Organizational Psychology, 86(1), 22-49. doi:10.1111/j.2044-8325.2012.02064
Cooper, M. D., & Phillips, R. A. (2004). Exploratory analysis of the safety climate and safety behavior relationship. Journal of safety research, 35(5), 497-512. doi:10.1016/j.jsr.2004.08.004
Cree, T., & Kelloway, E. K. (1997). Responses to occupational hazards: Exit and participation. Journal of Occupational Health Psychology, 2, 304–311. doi:10.1037/1076-8998.2.4.304
Fazio, R. H., & Williams, C. J. (1986). Attitude accessibility as a moderator of the attitude–perception and attitude– behavior relations: An investigation of the 1984 presidential election. Journal of Personality and Social Psychology, 51, 505–514. doi:10.1037/0022-3514.51.3.505
Ford, M. T., & Tetrick, L. E. (2011). Relations among occupational hazards, attitudes, and safety performance. Journal of Occupational Health Psychology, 16(1), 48-66. doi:10.1037/a0021296
Furnham, A., Petrides, K. V., Jackson, C. J., & Cotter, T. (2002). Do personality factors predict job satisfaction? Personality and Individual Differences, 33, 1325–1342. doi:10.1016/S0191- 8869(02)00016-8
Golimbet, V., Alfimova, M., Gritsenko, I., & Ebstein, R. (2007). Relationship between dopamine system genes and extraversion and novelty seeking. Neuroscience and Behavioral Physiology, 37, 601– 606. doi:10.1007/s11055-007-0058-8
Griffin, M. A., Neal, A., (2000). Perceptions of safety at work: a framework for linking safety climate to safety performance, knowledge, and motivation. Journal of Occupational Health Psychology 5(3), 347–358. doi:10.1037/1076-8998.5.3.347
Griffin, M. A., Hu, X. (2013). How leaders differentially motivate safety compliance and safety participation: The role of monitoring, inspiring, and learning. Safety Science, 60, 196–202. doi:10.1016/j.ssci.2013.07.019
Hale, A. R. (1990). Safety rules O.K.? Possibilities and limitations in behavioural safety strategies. Journal of Occupational Accidents, 12, 3–20. doi:10.1016/0376-6349(90)90061-Y
Haydon, G. (1978). On Being Responsible. The Philosophical Quarterly, 28, 46-57. doi:10.2307/2219043
Herrero, S. G., Saldana, M. A. M., del Campo, M. A. M., & Ritzel, D. O. (2002). From the traditional concept of safety management to safety integrated with quality. Journal of Safety Research, 33(1), 1-20. doi:10.1016/S0022-4375(02)00008-7
Hinze, J., & Harrison, C. (1981). Safety Programs in Large Construction Firms. Journal of the Construction Division, 107 (3), 455-467.
Hobfoll, S. E. (1989). Conservation of resources: A new attempt at conceptualizing stress. American Psychologist, 44, 513–524. doi:10.1037/0003-066X.44.3.513
Hofmann, D. A., Morgeson, F. P., & Gerras, S.J., (2003). Climate as a moderator of the relationship between leader–member exchange and content specific citizenship: Safety climate as an exemplar. Journal of Applied Psychology 88(1), 170–178. doi:10.1037/0021-9010.88.1.170
Hofmann, D. A., & Stetzer, A. (1996). A cross-level investigation of factors influencing unsafe behaviors and accidents. Personnel Psychology, 49, 307–339. doi:10.1111/j.1744-6570.1996.tb01802.x
Iverson, R. D., & Erwin, P. J. (1997). Predicting occupational injury: The role of affectivity. Journal of Occupational and Organizational Psychology, 70, 113–128.
doi:10.1111/j.2044-8325.1997.tb00637.x
Jensen, S. Q., Kyed, M., Christensen, A. D., Bloksgaard, L., Hansen, C. D., & Nielsen, K. J. (2014). A gender perspective on work-related accidents. Safety Science, 64, 190-198.
doi:10.1016/j.ssci.2013.12.004
Jiang, L., Yu, G., Li, Y., & Li, F. (2010). Perceived colleagues' safety knowledge/behavior and safety performance: Safety climate as a moderator in a multilevel study. Accident Analysis & Prevention, 42(5), 1468-1476. doi:10.1016/j.aap.2009.08.017
Johnson, S. E. (2007). The predictive validity of safety climate. Journal of safety research, 38(5), 511- 521. doi:10.1016/j.jsr.2007.07.001
Judge, T. A., Thoresen, C. J., Bono, J. E., & Patton, G. K. (2001). The job satisfaction–job
Judge, T. A., Erez, A., Bono, J. E., & Thoresen, C. J. (2002). Are measures of self-esteem,
neuroticism, locus of control, and generalized selfefficacy indicators of a common core construct? Journal of Personality and Social Psychology, 83, 693–710. doi:10.1037/0022-3514.83.3.693
Kanfer, R., & Ackerman, P. L. (1989). Motivation and cognitive abilities: An integrative/aptitude– treatment interaction approach to skill acquisition. Journal of Applied Psychology, 74, 657–690. doi:10.1037/0021-9010.74.4.657
Khanzode, V. V., Maiti, J., & Ray, P. K. (2012). Occupational injury and accident research: A comprehensive review. Safety Science, 50(5), 1355-1367. doi:10.1016/j.ssci.2011.12.015
Lingard, H., & Rowlinson, S. (1994). Construction site safety in Hong Kong. Construction Management and Economics, 12(6), 501-510. doi:10.1080/01446199400000061
Locke, E. A. (1976). The nature and causes of job satisfaction. In M. D. Dunnette (Ed.), Handbook of industrial and organizational psychology (pp. 1297–1349). Chicago: Rand McNally.
Mathews, A., & MacLeod, C. (1985). Selective processing of threat cues in anxiety states. Behaviour Research and Therapy, 23, 563–569. doi:10.1016/0005-7967(85)90104-4
Nahrgang, J. D., Morgeson, F. P., & Hofmann, D. A. (2011). Safety at work: a meta-analytic investigation of the link between job demands, job resources, burnout, engagement, and safety outcomes. Journal of Applied Psychology, 96(1), 71-94. doi:10.1037/a0021484
Neal, A., & Griffin, M. A. (2002). Safety climate and safety behaviour. Australian journal of
management, 27(1), 67-75. doi:10.1177/031289620202701S08
Neal, A. & Griffin, M. A. (2004). Safety climate and safety at work. In J. Barling & M.R. Frone (Eds.), The psychology of workplace safety (p. 15-34). Washington, DC: American Psychological Association. doi:10.1037/10662-002
Neal, A., & Griffin, M. A. (2006). A study of the lagged relationships among safety climate, safety motivation, and accidents at the individual and group levels. Journal of Applied Psychology, 91, 946–953. doi:10.1037/0021-9010.91.4.946
Neal, A., Griffin, M. A., & Hart, P. M. (2000). The impact of organizational climate on safety climate and individual behavior. Safety Science, 33, 99-109. doi:10.1016/S0925-7535(00)00008-4
Probst, T. M. (2002). Layoffs and tradeoffs: Production, quality, and safety demands under the threat of job loss. Journal of Occupational Health Psychology, 7, 211–220 doi:10.1037/1076-8998.7.3.211
Prussia, G., Brown, K., Willis, G., (2003). Mental models of safety: Do managers and employees see eye to eye? Journal of Safety Research, 34, 143–156. doi:10.1016/S0022-4375(03)00011-2
Pun, K. F., & Hui, I. K. (2002). Integrating the safety dimension into quality management systems: a
process model. Total Quality Management, 13(3), 373-391. doi:10.1080/09544120220135246
Rundmo, T. (1992). Risk perception and safety on offshore petroleum platforms - Part II: Perceived
risk, job stress and accidents. Safety Science, 15, 53– 68. doi:10.1016/0925-7535(92)90039-3
Salminen, S., 2004. Have young workers more injuries than older ones? An international literature review. Journal of Safety Research 35, 513–521. doi:10.1016/j.jsr.2004.08.005
Siu, O., Philips, D. R., Leung, T. (2003). Age differences in safety attitudes and safety performance in Hong Kong construction workers. Journal of Safety Research, 34, 199–205. doi:10.1016/S0022 4375(02)00072-5
Smith, C. A., Organ, D. W., Near, J. P., (1983). Organizational citizenship behavior: its nature and antecedents. Journal of Applied Psychology, 68(4), 653–663. doi:10.1037/0021-9010.68.4.653
Törner, M. (2011). The “social-physiology” of safety. An integrative approach to understanding organisational psychological mechanisms behind safety performance. Safety Science, 49(8-9), 1262-1269. doi:10.1016/j.ssci.2011.04.013
Turner, N., Stride, C. B., Carter, A. J., McCaughey, D., & Carroll, A. E. (2012). Job Demands-Control- Support model and employee safety performance. Accident Analysis & Prevention, 45, 811-817. doi:10.1016/j.aap.2011.07.005
Vinodkumar, M. N., & Bhasi, M. (2010). Safety management practices and safety behaviour: Assessing the mediating role of safety knowledge and motivation. Accident Analysis and Prevention, 42, 2082-2093. doi:10.1016/j.aap.2010.06.021
Warrack, B. J., Sinha, M. N. (1999). Integrating safety and quality: Building to achieve excellence in the workplace. Total Quality Management, 10(4-5), 779-785. doi:10.1080/0954412997802
Wingard, D. L., 1984. The sex differential in morbidity, mortality and lifestyle. Annual. Rev. Public Health, 5, 433-458. doi:10.1146/annurev.pu.05.050184.002245
Zohar, D. (2000). A group level model of safety climate: Testing the effect of group climate on microaccidents in manufacturing jobs. Journal of Applied Psychology, 85, 587-596. doi:10.1037/0021-9010.85.4.587
Zohar, D., & Luria, G. (2003). The use of supervisory practices as leverage to improve safety behavior: A cross-level intervention model. Journal of Safety Research, 34, 567–577. doi:10.1016/j.jsr.2003.05.006
Zohar, D., & Luria, G. (2005). A multilevel model of safety climate: Crosslevel relationships between organization and group-level climates. Journal of Applied Psychology, 90(4), 616−628. doi: 10.1037/0021-9010.90.4.616
Website links
Algemeen Dagblad, 2016. http://www.ad.nl/enschede/gewonde-bij-bedrijfsongeval-enschede- traumahelikopter-schiet-te-hulp~a30dc6c6
Brabants Dagblad, 2016. http://www.bd.nl/regio/112-nieuws/man-gewond-bij-bedrijfsongeval-in- waalwijk-1.5860355
RIVM, 2016. http://www.rivm.nl/Onderwerpen/V/Veilig_Werken/Arbeidsongevallen_in_cijfers
Beste medewerker,
Bedankt dat u mee wilt werken aan dit onderzoek. Met de vragenlijst die voor u ligt hopen we inzicht te krijgen in veilig gedrag. Uw antwoorden helpen om de veiligheid op de werkvloer verder te verbeteren.
Het invullen van de vragenlijst duurt ongeveer 5 minuten.
Vul de vragen vooral eerlijk in, uw antwoorden blijven volledig anoniem.
Als u dit voorblad en de vragenlijst heeft ingevuld, kunnen deze worden ingeleverd in de daarvoor bestemde boxen.
Als dank voor uw medewerking staat er een gebakje voor u klaar.
Met vriendelijke groet, Jellien Tigelaar
Student Communication Studies Universiteit Twente
Instructie en voorbeeld
In deze vragenlijst leggen wij u verschillende stellingen voor. U kunt aangeven in hoeverre u het eens bent met de stelling door het antwoord aan te kruisen dat volgens u het meest van toepassing is.
Een vergissing kunt u corrigeren door een kruisje te zetten door het foute antwoord en het antwoord dat wel van toepassing is in te kleuren, zoals in onderstaand voorbeeld.
Zeer mee oneens
Mee oneens
Niet mee eens, niet mee oneens
Mee eens
Zeer mee eens
Ik houd van taart.
O
O
O
Vult u alstublieft onderstaande verklaring in.
Ik verklaar op een voor mij duidelijke wijze te zijn ingelicht over de aard, methode, en het doel van het onderzoek. Ik weet dat de gegevens en resultaten van het onderzoek volledig anoniem en vertrouwelijk behandeld zullen worden. Mijn vragen zijn naar tevredenheid beantwoord.
Ik stem geheel vrijwillig in met deelname aan dit onderzoek. Ik weet dat ik op elk moment zonder opgaaf van redenen mijn deelname aan dit onderzoek kan stoppen.
Naam deelnemer: _________________
Datum: ______-______ 2015
In hoeverre bent u het eens met de volgende stellingen?
Zeer mee oneens Mee oneens Niet mee eens, niet mee oneens Mee eens Zeer mee eensIk weet hoe ik mijn werk uitvoer op een veilige
manier.
O
O
O
O
O
Het is noodzakelijk om er alles aan te doen om de
werkomgeving veilig te houden.
O
O
O
O
O
Ik rapporteer alles dat een veilige werkomgeving
in gevaar kan brengen.
O
O
O
O
O
Het management benadrukt veiligheid.
O
O
O
O
O
Ik weet precies hoe ik mijn PBM’s (persoonlijke
beschermingsmiddelen) moet gebruiken.
O
O
O
O
O
Zeer mee oneens Mee oneens Niet mee eens, niet mee oneens Mee eens Zeer mee eens
Ik vind het belangrijk dat veiligheid voor alles
gaat.
O
O
O
O
O
Mijn manager toont geen interesse in de
veiligheid van de werknemers.
O
O
O
O
O
Ik zet me extra in om de veiligheid op mijn werk
te verbeteren.
O
O
O
O
O
Ik ken de veiligheidsregels uit mijn
hoofd.
O
O
O
O
O
Ik vind het belangrijk om anderen aan te
moedigen zich veilig te gedragen.
O
O
O
O
O
Zeer mee oneens Mee oneens Niet mee eens, niet mee oneens Mee eens Zeer mee eens
Ik draag altijd de voorgeschreven PBM’s.
O
O
O
O
O
________ is een goed bedrijf om voor te
werken.
O
O
O
O
O
Tijdens mijn werk houd ik me altijd aan de
voorgeschreven regels en procedures.
O
O
O
O
O
Ik weet hoe het risico op ongevallen op de
werkvloer verminderd kan worden.
O
O
O
O
O
Mijn manager benadrukt het belang van het
dragen van PBM’s.
O
O
O
O
O
Ik krijg voldoende trainingen op het gebied van
veiligheid.
In hoeverre bent u het eens met de volgende stellingen?
Zeer mee oneens Mee oneens Niet mee eens, niet mee oneens Mee eens Zeer mee eensIk help collega’s als ze werken onder gevaarlijke
omstandigheden.
O
O
O
O
O
Mijn collega’s vinden veiligheid belangrijk.
O
O
O
O
O
Ik ben tevreden over het management van deze
organisatie.
O
O
O
O
O
Ik neem vrijwillig taken of activiteiten op me om
veiligheid op de werkplaats te verbeteren.
O
O
O
O
O
Ik werk altijd zo veilig mogelijk.
O
O
O
O
O
Ik ben tevreden over de samenwerking met
collega’s.
O
O
O
O
O
Zeer mee oneens Mee oneens Niet mee eens, niet mee oneens Mee eens Zeer mee eens
Het management geeft hoge prioriteit aan
veiligheid.
O
O
O
O
O
Ik weet hoe ik ervoor kan zorgen dat het veilig
blijft op mijn werkplaats.
O
O
O
O
O
De veiligheidstrainingen zijn van goede kwaliteit.
O
O
O
O
O
Ik denk er vaak aan om ontslag te nemen.
O
O
O
O
O
Door tijdsdruk is het soms lastig om me aan alle
veiligheidsregels te houden.
O
O
O
O
O
Ik moedig mijn collega’s aan om veilig te werken.
O
O
O
O
O
Ik ben blij met mijn baan.
O
O
O
O
O
Zeer mee oneens Mee oneens Niet mee eens, niet mee oneens Mee eens Zeer mee eens
Mijn manager vindt veiligheid belangrijk.
O
O
O
O
O
Ik voer mijn werk uit op een veilige manier.
O
O
O
O
O
Ik wijs het management er op als de veiligheid op
de werkvloer verbeterd kan worden.
O
O
O
O
O
Ik vind een veilige werkomgeving niet belangrijk.
O
O
O
O
O
Mijn manager houdt zich zelf aan alle
veiligheidsregels.
O
O
O
O
O
Het management vindt veiligheid belangrijk.
O
O
O
O
O
Ik vind de moeite waard om me in te zetten voor
een veilige werkomgeving.
O
O
O
O
O
Geef alstublieft antwoord op de volgende vragen.
1.
Welk cijfer geeft u de veiligheid op uw werk, op een schaal van één tot tien?
_______
2.
Heeft u ooit een ongeluk gehad op uw werk met letsel tot gevolg?
(omcirkel wat van toepassing is)ja / nee
Zoja, hoe ernstig was dit?
Helemaalniet ernstig
Niet ernstig Een beetje ernstig Ernstig Heel ernstig
O O O O O
3.
Heeft u in de afgelopen 12 maanden een ongeluk gehad op uw werk met letsel tot
gevolg?
(omcirkel wat van toepassing is)
ja / nee
Zoja, hoe ernstig was dit?
Helemaalniet ernstig
Niet ernstig Een beetje ernstig Ernstig Heel ernstig
O O O O O
4.
Heeft één van uw directe collega’s ooit een ongeluk gehad op uw werk met letsel tot
gevolg?
(omcirkel wat van toepassing is)
ja / nee
Zoja, hoe ernstig was dit?
Helemaalniet ernstig
Niet ernstig Een beetje ernstig Ernstig Heel ernstig
O O O O O
5.
Heeft één van uw directe collega’s in de afgelopen 12 maanden een ongeluk gehad op
uw werk met letsel tot gevolg?
(omcirkel wat van toepassing is)
ja / nee
Zoja, hoe ernstig was dit?
Helemaal niet ernstig
Tot slot volgen enkele algemene vragen.
Dit is het einde van de vragenlijst.
Hartelijk bedankt voor uw medewerking!
Als er nog andere zaken belangrijk zijn op het gebied van veiligheid maar niet in de vragenlijst
aan bod zijn gekomen, dan kun je ze hieronder invullen:
Bent u:
O man
O vrouw
Wat is uw leeftijd?
_____
jaar
Wat is uw hoogst voltooide opleiding?
Ο
Lager onderwijs (basisschool)
Ο
Lager beroepsonderwijs
Ο
Middelbare school: MAVO/KL/TL
Ο
Middelbare school: HAVO
Ο
Middelbare school: VWO
Ο
Middelbaar beroepsonderwijs (MBO)
Ο
Hoger beroepsonderwijs (HBO)
Ο
Wetenschappelijk onderwijs (WO)
Bent u vaste medewerker of uitzendkracht?
O Vaste medewerker
O Uitzendkracht
Hoe lang werkt u al bij _______?
O korter dan een half jaar
O een half jaar tot een jaar
O 1 - 3 jaar
O 3 - 4 jaar
O 5 - 10 jaar
O 10 jaar of langer
Wat is uw functie bij ________ ?
O operator
APPENDIX B: ALTERNATIVE MODELS
Alternative model predicting Safety Performance Behavior
[image:33.595.71.530.268.356.2]The predictors Job satisfaction and Safety Climate did not significantly predict safety performance behavior. Therefore, the model was retested excluding these predictors. It was found that the predictors explain a significant amount of the variance in safety performance behavior (F(3, 156) = 56.93, p = .000, R² = .723). Table 8 shows coefficients of the predictors of Safety Performance Behavior.
Table 8
Coefficients predictors Safety Performance Behavior – model 2
B SD B t sig.
(Constant) .583 .258 2.262 .025
Safety Knowledge .306 .057 .324 5.334 .000
Safety Motivation .370 .056 .412 6.658 .000
Safety Leadership .146 .041 .215 3.566 .000
Alternative model predicting Safety Compliance
The predictors Job satisfaction and Safety Climate did not significantly influence safety compliance. Therefore, the model was retested excluding these predictors. The predictors explained a significant amount of the variance in safety compliance (F(3, 156) = 53.15, p = .000, R² = .711). Table 9 shows coefficients of the predictors of safety compliance.
Table 9
Coefficients predictors Safety Compliance – model 2
B SD B t sig.
(Constant) .461 .296 1.559 .121
Safety Knowledge .366 .066 .343 5.547 .000
Safety Motivation .281 .064 .277 4.400 .000
[image:33.595.70.525.516.604.2]Alternative model predicting Safety Participation
[image:34.595.76.524.204.275.2]The predictors Job satisfaction, Safety Climate and Safety Leadership did not significantly influence safety participation. Therefore, the model was retested excluding these predictors. The predictors explained a significant amount of the variance in safety participation (F(2, 157) = 33.70, p = .000, R² = .548). Table 10 shows coefficients of the predictors of safety participation.
Table 10
Coefficients predictors Safety Participation – model 2
B SD B t sig.
(Constant) .751 .377 1.991 0,48
Safety Knowledge .258 .084 .221 3.068 .003