A Thesis Submitted for the Degree of PhD at the University of Warwick
http://go.warwick.ac.uk/wrap/34682
This thesis is made available online and is protected by original copyright. Please scroll down to view the document itself.
High Resolution Characterisation of
Microcapsule Structure, Adhesion and
Release Properties
by
Isabel R. Lee
A thesis submitted for the degree of
Doctor of Philosophy
Department of Chemistry, University of Warwick
Table of Contents
List of Figures .
List of tables .
Acknowledgements .
Declaration ..
Abstract .
Abbreviations .
Chapter 1 - Introduction
1.1Controlled release systems ..
1.1.1 Microencapsulation ..
1.1.1. 1 Physical methods .
1.1.1.2 Phase separation methods .
1.1.1.3 Polyelectrolyte multilayer methods .
1.1.1.4 Interfacial polymerisation reaction methods . 1.1.2 Preparation of Microcapsules used in this project . 1.1.3 Microcapsules - Current knowledge and reasons for study .
1.2Self-Assembled Monolayers .
1.3 High resolution force microscopy .
1.3.1 Atomic force microscopy (AFM) .
1.3.2 Chemical force microscopy (CFM) .
1.3.3 AFM studies of polymeric microcapsules .
1.4 Fluorescence microscopy .
1.5 Confocal laser scanning microscopy (CLSM) .
1.5.1 CLSM in the study of microcapsules .
1.6 Aims of thesis .
1.7 References .
Chapter 2 - Experimental Section
2.1 Force measurements .
2.1.1 Instrumentation .
. . I .
2.1.2 Mlcromanlpu ation .
2.1.3 Spring constants .
2.2.1 Self-assembled monolayers of alkylthiols on gold... 49
2.2.2 Cuticle substrate formation. ... .. ... ... ... .. .. .. .. .. .. ... ... ... . .. . ... .. 51
2.3 Confocal microscopy. .. .. ... . ... ... ... . ... . .. .. .. ... .. . ... ... ... . . ... ... . ... 51
2.3.1 Instrumentation... 51
2.3.2 Experimental procedures... 52
2.3.2.1 Microcapsule release into solution... 52
2.3.2.2 Microcapsule release in the dry state... 53
2.3.2.3 Combined CLSM and electrochemical studies... 54
2.4 Electrochemical techniques... 55
2.4.1 Ultramicroelectrode fabrication... 55
2.4.2 Electrochemical Measurements... 57
2.5 Chemicals and solutions... 58
2.5.1 Preparation of buffer solutions ,. 59 2.5.2 Preparation of solutions used in electrochemical measurements... 59
2.6 References... 60
Chapter 3 - Investigation into the adhesion properties of functionalised microcapsules to different substrates 3.1 Introduction... 61
3.2 Experimental. ... ... ... ... ... ... 63
3.2.1 Formation of functionalised microcapsules... 63
3.2.2 Experimental procedure for force measurements... 64
3.3 Results and discussion. .... .... ... ... .. ... . .. ... .... ... .. ... .. ... .... .. .... .. ... .. 65
3.3.1 Characterisation of SAMs... 65
3.3.2 Characterisation of spring constants... 68
3.3.3 SEMs of microcapsules attached to AFM cantilevers... 71
3.3.4 Force measurements between functionalised microcapsules and an-OR terminated SAM. . . . .. . .. .... .. ... .. .. ... .. ... . .. .. ... . ... . ... . ... . ... ... . ... 72
3.3.5 Force measurements between functionalised microcapsules and SAMs of differing functionality... ... 81
3.4 Conclusions... 87
3.5 References... 88
Chapter 4 - Investigations into the release of pesticide from microcapsules under solution 4.1 Introduction... 91
4.2 Theory ,.. .. . . .. .. . . .. .. . . .. . .. ... .. . ... 93
4.3 Experimental, ,... 95
4.4 Results and discussion , , , ,... 97
4.4.1 Preliminary studies... 97
4.4.2 Release studies into ethanolic solution... 100
4.4.2.1 Concentration of ethanolic solution used. . . .. . . .. .. . . .. .. . . .. . .. ... . .. .... 101
4.4.2.2 Investigation of the effect of wall thickness and cross linking density on the permeability of microcapsules. 103 4.4.2.3 Calculation of the product of the mass transfer coefficients of lambda cyhalothrin across the microcapsule wall and the solubility coefficients of the pesticide in the polymer wall 108 4.5 Conclusions , , .. . . .. . . . ... ... ... III 4.6 References. .. . .. .. . .. . .. . . .. ... .. . .. . .. . .. . .. .. . . . .. . .. . .. . .. . . .. . . .. .. . .. . . .. ... .. . ... III Chapter 5 - Studies into the release of pesticide in the dry state 5.1 Introduction ,., ,.., 113
5.2 Experimental , , , , .. . ... . .. 115
5.2.1 Leaf, caterpillar and microcapsule selection ,... 115
5.2.2 Confocal measurements... .... 116
5.3 Results and discussion , . , ,.. 118
5.3.1 High resolution imaging ofPrunus laurocerasus... 118
5.3.2 Release studies of emamectin benzoate and lambda cyhalothrin capsules.. 122
5.3.3 High resolution imaging of caterpillars... 130
5.4 Conclusions... 134
5.6 References ,... 135
detection of heavy metal ions
6.1Introduction... ... 137
6.1.1 Stripping Voltammetry. . . .. . .. . .. . .. . . .. .. . . .. . . . .. . .. . . .. . . . .. . . .. .. .. . .. 137
6.1.2 Fluorescence detection of metal ions... 140
6.2 Experimental... 143
6.3 Results and discussion... 145
6.3.1 Mercury hemisphere ultramicroelectrode growth... 145
6.3.2 Hg UME Stripping Voltammetry ofCd(II). 146 6.3.3 Current-time studies ofCd2+release from Hg... 148
6.3.4 Combined ASV and CLSM studies for the detection ofCd2+... 150
6.4 Conclusions. . . .. . . . .. ... ... ... .. . ... . . .. .. . . . .. . .. . . .. .. . .. . . .. . .. . .. ... . .. .. 160
6.5 References. . . .. . . .. . . .. . .. . .. . .. .. . . .. . .. . .. . .. . . .. .. . . .. . . .. .. . .. . .. . ... . .. ... 160
List of Figures
Chapter 1 - Introduction
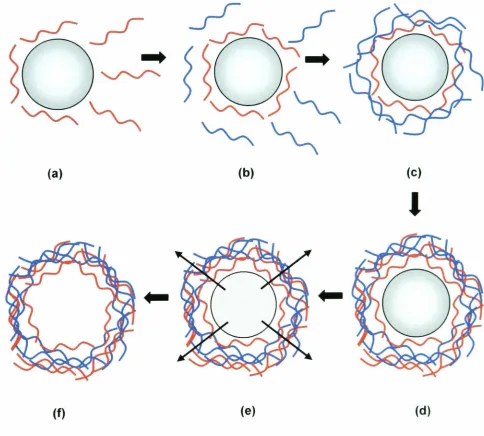
Figure 1.1 Figure 1.2 Figure 1.3 Figure 1.4 Figure 1.5 Figure 1.6 Figure 1.7 Figure 1.8 Figure 1.9 Figure 1.10 Figure 1.11 Figure 1.12 Figure 1.13 Figure 1.14 Figure 1.15 Figure 1.16Schematic illustrations of the polyelectrolyte deposition process and of subsequent core decomposition. Initial steps (a-d) involve stepwise film formation by repeated exposure of the colloids to polyelectrolytes of alternating charge with excess polyelectrolyte removed by washing and centrifugation. The coated particles are then exposed to 100 mM HCI whereupon the core immediately decomposes (e-f).
Interfacial condensation polymerisation processes.
Process steps in interfacial condensation polymerization.
Monomers used in the polyfunctional isocyanate microcapsule system. Wall forming reaction for the polyfunctional isocyanate microcapsule system.
Butylated urea-formaldehyde polymer used in the aminoplast pre-polymer microcapsule.
Wall-forming reaction for the aminoplast pre-polymer microcapsule system.
Cross linking mechanism used in the formation of the microcapsule wall in the aminoplast prepolymer system, showing the structure of the crosslinker pentaerythritol tetrakis(3-mercaptopropionate) (HSR).
Artificially broken microcapsule made using the polyfunctional isocyanate microcapsule system - Magnification: 5200
Schematic representation of microcapsule demonstrating parameters included in the release rate equation 1.1.
Schematic representation of some of the supramolecular structures possible with SAMs of thiols on gold.
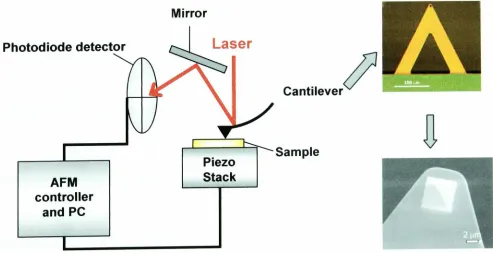
Graph showing the comparison between mole fraction of thiol in an original solution with a methyl terminated thiol (XPsolution) and the corresponding mole fraction of the thiol in the monolayer (XPsurface). A schematic 0 f a typical AFM experimental apparatus showing a V-shaped silicon nitride cantilever with a close up of the pyramidal tip. Schematic representation of an AFM force-distance (approach) curve. Scheme for the chemical modification of tips and sample substrates. In this case the tip a nd substrate have been modified with thiols which have end groups which are capable of hydrogen bonding with one another leading to enhanced interaction.
(a) Representative force distance curves in ethanol recorded for COOH/COOH, CH3/CH3 and CH3/COOH tip-sample functionalisation (tip radius - 60 nm). (b) Image of patterned CH3 I COOH SAM determined from friction measurements using CFM with a methyl-terminated tip.
agarose bead, shown here partially blocked with avidin.
Figure 1.18 (a) schematic demonstrating the sequential unfolding of individual titin immunoglobulin domains with the associated force distance curve. (b) an example of the characteristic sawtooth pattern of unfolding observed in these measurements.
Figure 1.19 Jablonski diagram illustrating the processes involved in the creation of an excited electronic singlet state by optical absorption and subsequent emission of fluorescence.
Figure 1.20 The excitation and emission spectra of a fluorescent molecule showing the change in wavelength between absorption and emission.
Figure 1.21 The optical path in a typical epi-illumination fluorescence microscope. Figure 1.22 A comparison of the illumination experienced by the specimen during
(a) full field illumination in a conventional fluorescence microscope and (b) Single point illumination in a CLSM.
Figure 1.23 The principles of confocal laser scanning microscopy. Solid red lines indicate light from the focal plane, black dashed lines indicate light above and below the focal plane that is prevented from being detected by the confocal aperture.
Figure 1.24 (a) Schematic for the FRAP experiment. CLSM images 0 f capsules: (b) before bleaching; (c) after bleaching inside the capsule; (d) fluorescence recovery; (e) fluorescence intensity from a fixed area within the capsule as a function of time.
Chapter 2 - Experimental Section
Figure 2.1 Figure 2.2 Figure 2.3 Figure 2.4 Figure 2.5 Figure 2.6 Figure 2.7Photograph of the micromanipulation set up used in this project.
Optical micrographs from the optical microscope (magnification x 200) of etched 250 um diameter tungsten wires.
Schematic representation of micromanipulation rig used in this project. Schematic representation of the procedure for the formation of SAMs of alkyl thiols on a gold surface.
Molecular structure of the pyrethroid insecticide Lambda Cyhalothrin. Molecular structure of the pesticide Emamectin Benzoate
Images from the optical microscope of the finished UME (a) Side view of the U ME (b) Top v iew of the UME defining t he terms for calculating RG.
Chapter 3 - Investigation into the adhesion properties of functionalised
microcapsules to different substrates
Figure 3.2 Figure 3.3 Figure 3.4 Figure 3.5 Figure 3.6 Figure 3.7 Figure 3.8 Figure 3.9 Figure 3.10 Figure 3.11 Figure 3.12 Figure 3.13 Figure 3.14 Figure 3.15
Schematic representation of the experimental set-up for force measurements between microcapsule and substrate.
AFM images of (a) non-annealed gold surface and (b) a gold substrate annealed at 350°C for 6 hours. Scan size 111m x 111m.
Images captured during enlargement of water droplet on (a) 100% -COOH terminated SAM, (b) 50% -COOH and 50% -CH3 terminated SAM, (e) 100% -CH3 terminated SAM. (8 = contact angle of droplet to surface)
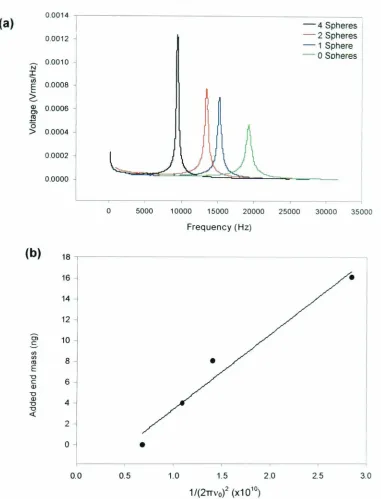
(a) The sequential frequency response of a silicon nitride cantilever with the addition of4 borosilicate spheres. (b) The added mass of the spheres is plotted as a function of the resonance frequency to allow the determination of the spring constant and cantilever mass.
Graph showing the fit of equation 3.1 to the experimental thermal resonance peak obtained from a long thick silicon nitride cantilever.
SEMs of microcapsule attached to silicon nitride AFM cantilevers using 5-minute epoxy.
Schematic of the functional groups investigated in force measurements: (a) sulfonate modified microcapsule; (b) alkyl modified microcapsule; (e) anionic modified microcapsule; (d) cationic modified microcapsule.
(a) Examples of force-distance curves for an alkyl modified microcapsule to an OH-terminated SAM at different pHs. (b) Examples of force-distance curves for a sulfonate-modified microcapsule to an OH-terminated SAM at different pHs.
Schematic representation of hydrogen bonding between ethylene oxide and propylene oxide groups present in modifier molecules on the surface of sulfonate and alkyl modified microcapsules with an OH-terminated SAM.
Force titration showing adhesion forces normalised with respect to the radius of microcapsule to an OH-terminated SAM for an alkyl (e), sulfonate (.) and an unmodified (.) microcapsule.
(a) Monomers used in the polyfunctional isocyanate system (b) Representative portion of microcapsule wall structure.
Force titration showing 'jump to contact' forces observed in adhesion measurements normalised with respect to the radius of microcapsule to an OH-terminated SAM for an alkyl (e) and a sulfonate (.).
Force titration showing adhesion forces normalised with respect to the radius of microcapsule to an OH-terminated SAM for a cationic (e), anionic (.) and an unmodified (.) microcapsule.
(a) Force titration showing adhesion forces normalised with respect to the radius of a sulfonate modified microcapsule to an OH-terminated SAM (.) and a CH3 terminated SAM (e). (b) Force titration showing adhesion forces normalised with respect to the radius of an alkyl modified microcapsule to an OH-terminated SAM (.) and a CH 3 terminated SAM (e).
microcapsule to an Cllj-terminated SAM (a) and a mixed 70:30 CH3:COOH terminated SAM (e). (b) Force titration showing adhesion forces for an alkyl modified microcapsule to an CH 3-terminated SAM (.) and a mixed 70:30 CH3:COOH terminated SAM (e).
Figure 3.17 Examples of force distance curves for (a) a sulfonate modified microcapsule and (b) an alkyl modified microcapsule to a 70:30 CH3 : COOH mixed SAM at 3 different sites on the surface of the SAM.
Figure 3.18 Force titration showing adhesion forces normalised with respect to the radius of microcapsule to a cuticle of the prunus laurocerasus leaf for an alkyl (e), sulfonate (.) cationic(.) and an unmodified ( ... )microcapsule. Figure 3.19 Examples of force distance curves of an alkyl modified microcapsule to a
leaf cuticle all measured at the same pH at 4 different locations on the cuticle surface.
Figure 3.20 (a) Force titration showing adhesion forces normalised with respect to the radius 0 f a sulfonate modified microcapsule to a leaf cuticle (a) and a mixed 70:30 CH3:COOH terminated SAM (e). (b) Force titration showing adhesion forces normalised with respect to the radius of an alkyl modified microcapsule to a leaf cuticle (.) and a mixed 70:30 CH3:COOH terminated SAM (e).
Chapter 4 - Investigations into the release of pesticide from microcapsules
under solution
Figure 4.1 Figure 4.2 Figure 4.3 Figure 4.4 Figure 4.5 Figure 4.6 Figure 4.7 Figure 4.8Schematic representation of the parameters described in equation 4.1 Experimental set up for studying the release of active ingredient from microcapsule into solution.
3D projection images of polyurea microcapsules filled with the dye Nile Red.
Slice through the centre of a group of microcapsules containing the dye Nile Red at (a) 0 min, (b) 30 min, (e) 60 min, (d) 90 min (e) 120 min (f)
180 min.
Slices through the centre of polyurea microcapsules containing (a) the pesticide lambda cyhalothrin and the solvent Solvesso and (b) the solvent Solvesso alone.
Series of images taken through the centre of a lambda cyhalothrin filled microcapsule showing the release of the pesticide over time. The time scale between each image was 2 minutes with the first being taken at 0 minutes.
Plots of(10-It)/It vs time showing the release of lambda cyhalothrin from capsules with 10% wall, 1:10 crosslinking density. Measurements were taken in solutions of differing ethanol:water concentrations; • 100% water, • 25:75 EtOH:Water, • 75:25 EtOH:Water.
capsules with 10% wall, 1:10 crosslinking density. Measurements were taken in solutions of differing ethanol:water concentrations; • 100% water, • 25:75 EtOH:Water, • 75:25 EtOH:Water.
Figure 4.9 Graphs detailing the release of lambda cyhalothrin from capsules measured as the average light intensity within the capsules normalised with respect to the initial intensity against time. Measurements were taken in 75:25 EtOH:Water and the capsules used were 15% wall with (a) • 1:20 crosslinking, (b). 1:10 crosslinking, (c) • 1:1 crosslinking.
Figure 4.10 Graphs detailing the release of lambda cyhalothrin from capsules measured as the average light intensity within the capsules normalised with respect to the initial intensity against time. (a)10% wall with. 1:20 cross linking.e 1:10 cross linking.e 1:1 cross linking; (b) 15% wall with • 1:20 cross linking.e 1:10 cross linking, • 1:1 cross linking.
Figure 4.11 Graphs detailing the release of lambda cyhalothrin from capsules investigating the effect of changing the wall thickness on the release profile. (a) 1:20 cross linking with. 10% wall.e 15% wall; (b) 1:10 cross linking with. 10% wall, • 15% wall and (c) 1:1 cross linking with • 10% wall.e 15% wall.
Figure 4.12 Cropped release profile for microcapsule with 10% wall and 1: 1 crosslinking density ratio.
Chapter 5 - The release of pesticides from microcapsules in the dry state
Figure 5.1 Schematic representation of the structure of a leaf showing the differentcomponents present within the leaf.
Figure 5.2 (a) High resolution imaging of the Prunus laurocerasus in different focal planes using CLSM. Serial optical sections were acquired from the top (top left image) to the bottom (bottom right image) of the sample in defined steps of 2 urn. (b) 3D projection of Prunus laurocerasus reconstructed from 82 serial optical sections through the cuticle of the caterpillar. (c) Single optical slice on surface of Prunus laurocerasus and reconstructions of 82 serial optical sections (step size I urn) to produce orthogonal cross-sections in the x-z and y-z planes, along directions defined by the green and red line. The position of the single slice image in the z-stack is shown by the blue line in the x-z and y-z orthogonal projections.
Figure 5.3 Series of single optical slices taken just below cuticle of Prunus laurocerasus and reconstructions of 82 serial optical sections (step size 1 urn) to produce orthogonal cross-sections in the x-z and y-z planes, along directions defined by the green and red line. The position of the single slice image in the z -stack is shown by the blue line in the x -zand y-z orthogonal projections. Each slice in the series is taken in the same position of the leaf at half hour time intervals. Samples used were (a) a 1 em diameter disc cut out of a leaf and (b) an intact leaf attached to water soaked cotton wool.
Figure 5.4 (a) Series of single optical slices taken in the centre of a single
reconstructions of 55 serial optical sections (step size 1 urn) to produce orthogonal cross-sections in the x-z and y-z planes, along directions defined by the green and red line. The position of the single slice image in the z-stack is shown by the blue line in the x-z and y-z orthogonal projections. Each slice in the series is taken in the same position of the leaf at hour time intervals. (b) Slices taken through the centre of a single capsule showing t he decrease in fluorescence relating to the release of pesticide with time.
Figure 5.5 Graph detailing the release of the pesticide lambda cyhalothrin from microcapsules onto a leaf of Prunus Laurocerasus.
Figure 5.6 Schematic representation of parameters involved in the release of lambda cyhalothrin from a polymeric microcapsule onto a surface.
Figure 5.7 Plot of Vln(It/Io) against time for lambda release onto Prunus laurocerasus.
Figure 5.8 (a) 3D projections of an emamectin benzoate capsule on the surface of a leaf of Prunus laurocerasus reconstructed from a z-stack consisting of 125 slices taken 1 urn apart. The images were taken at different times after application of microcapsule to leaf. (b) Slice through the centre of the emamectin benzoate capsule taken at half hour time intervals.
Figure 5.9 Graph detailing the release of the pesticides • lambda cyhalothrin and • emamectin benzoate from microcapsules onto a leaf of the Prunus laurocerasus.
Figure 5.10 Graph detailing the average release from microcapsules containing the pesticide e mamectin benzoate when applied to. a glass slide and • a glass slide covered in Parafilm.
Figure 5.11 (a) High resolution image series z-stacking through the cuticle of Plutella xylostella. Images shown are taken at 5 urn intervals from above to below the cuticle. (b) 3D projection reconstructed from 150 serial optical sections through the cuticle of the caterpillar.
Figure 5.12 (a) High resolution image series z-stacking through the cuticle of Heliothis virescens. Images shown are taken at 5 urn intervals from above to below the cuticle. (b) 3D projection reconstructed from 150 serial optical sections through the cuticle of the caterpillar.
Chapter 6 - Preliminary studies on the combined use of CLSM and
electrochemistry for the trace detection of heavy metal ions
Figure 6.1 Figure 6.2 Figure 6.3 Figure 6.4 Figure 6.5 Figure 6.6 Figure 6.7 Figure 6.8
Principles of anodic stripping. Values shown are typical ones used; potentials and Ep are typical of Cu2+ analysis. (a) Preelectrolysis at Ed; stirred solution. (b) Rest period; stirrer off. (c) Anodic scan (v = 10-100 mV/s).
Visual screening of fluorescent indicator responses to metal ions. The image shows a 96-well microplate containing various combinations of ions and indicators in 50 mM MOPS pH 7.0. Each row of wells represents a different indicator; each column of wells represents a different ion. The indicators (top to bottom) are: Calcium Green-5N (0.5 11M), Calcium Green-2 (0.2 11M), fluo-4 (211M), fluo-5N (211 M), FluoZin-1 (211M), Newport Green DCF (211M), Phen Green FL (211M) and calcein (0.5 11M). The left-hand column of wells contains 10 mM EGTA
+
10 11M TPEN (ion-free reference solution). Subsequent columns (left to right) represent 1 11M concentrations of Ca2+, Ba2+, Mn2+, Fe2+,~ .~ ~ ~ ~ ~ ~ . .
Co ,NI ,Cu ,Zn ,Cd ,Hg ,and Pb ,respectIvely. The microplate was scanned using a FLA3000G laser scanner (Fuji Photo Film Co.) with excitation at 473 nm and fluorescence emission detected at 520 nm. The image is pseudocolored according to fluorescence intensity (high = red> orange> yellow> green> blue = low).
(a) Metal-ion response screening for Calcium Green-5N. The maximum relative fluorescence intensity was measured for indicator concentrations in solutions containing 10 mM EGTA
+
10 11M TPEN, 111M ion (100 11M for Mg2+) and 100 11M ion (10 mM for Mg2+). Results are plotted as fluorescence changes relative to the ion-free ( 10 mM E GTA+
10 11M TPEN) reference solution expressed as (F-Fo)/Fo, where F is the fluorescence intensity of ion-containing solutions and F°
is the fluorescence intensity of the reference solution. Blue bars indicate the response to 1 11M ion (100 11M for Mg2+), and red bars indicate the response to 100 11M ion (10 mM for Mg~). (b) Structure of the fluorescence indicator Calcium Green-5N.(a) Photograph of the experimental set-up showing the trough and electrode on the stage of the confocal microscope. (b) Schematic of experimental arrangements for studies of Cd2+ stripping experiments. A typical current-time growth transient for the electrodeposition of mercury onto a 25 11m diameter Pt UME, from a solution containing 10 mM mercurous nitrate, 0.1 M RN03 and 0.5 M KN03 with the electrode held at 0.225 V.
Typical stripping voltammogram of cadmium from a Hg/Pt UME. Preconcentration time 240 seconds.
Current time plots for the stripping of cadmium from a mercury UME. The electrode was preconcentrated for 10 seconds then held at the potentials shown in the legend.
Plot showing the dependence of charge passed during stripping with the potential applied.
The electrode was held at -0.8 V and was preconcentrated with cadmium for the times shown in the legend.
Figure 6.10 Plot showing the dependence of charge passed during stripping with deposition time.
Figure 6.11 Normalised light intensity as a function of Cd2+ concentration for a solution of Calcium green 5N and cadmium nitrate with CLSM images at marked concentration values.
Figure 6.12 Time series of frames taken over surface of electrode in 1x10⁻⁵ mol dm-3 CdN03 and 0.5 urnol dm" Calcium Green 5N. Frames were taken every 7 seconds. Series recorded concurrently with ASV with preconcentration time of 60 seconds. Preconcentration time started at 14 seconds. Pre concentration was followed by a potential sweep from -1.1 to -0.5 V. Figure 6.13 Schematic representation showing how spatiotemporal data collected
relates to the system studied.
Figure 6.14 Stripping voltammogrames of Cd2+ from a Hg UME recorded after specified pre concentration times. Associated spatiotemporal images are shown in Figure 6.12.
Figure 6.15 Plot showing the dependence of charge passed during stripping on the deposition time of cadmium into the mercury hemisphere UME.
Table 2.1 Table 2.2 Table 3.1 Table 4.1
Table 4.2
List of Tables
Details of microcapsules used in release into solution experiments Grades and suppliers of chemicals used in these studies
Experimentally determined contact angle measurements
Details of properties of microcapsules used in release into solution measurements
Product of mass transfer and solubility coefficients of microcapsules with differing wall properties
Firstly I would like to thank Prof. Patrick Unwin and Dr. Julie Macpherson for all their enthusiasm, encouragement and friendship through the three years of this project. Their advice and support have been invaluable in the completion of these studies. I must also express my gratitude to my industrial supervisors at Syngenta, especially Ian Shirley, Colin Brennan and Anne Waller who have helped me understand how the fundamental science I was carrying out was applicable to real life.
Huge thanks must go to all the members, past and present, of the Electrochemistry and Interfaces group at Warwick. N af, C at and Doug, I blame you entirely for persuading me to stay a nd do a PhD, that first year with you three was perhaps my best. I would like to thank Dr. Anna Barker for all of her advice over the years, explaining things to me in simple terms. I would also like to thank Dr. Neil Wilson for his help with spring constant work and explaining physics to me.
Lucy and Sophie, thanks for listening to me when things weren't going right and helping me to realise I wasn't the only one who couldn't do it. Mark and Dave, we have come through this together and we will all come out the other side, thank you both for entertaining me over the years. Nikki thanks for all you help being my contact on campus when writing up at home. Everyone else in the group, thank you so much for your friendship and advice over the years, you have really made my time at Warwick enjoyable.
Special thanks must go to Cat who has been far more than just a housemate, lab mate and best mate. Her insanity matches mine completely and together over the past three years we have triumphed over adversity to complete our studies and finally leave the bubble.
Finally, I must thank my parents and Euan. They have been there for me throughout and have born the brunt of my frustrations during the write up. Thank you so much for all of your support, without it I would never have got this far.
Abstract
This thesis aims to characterise the structural, adhesion and release properties of polymeric microcapsules which are used ina griculture for t he controlled delivery of pesticides to crops.
An adaptation of atomic force microscopy (AFM) known as chemical force microscopy (CFM) has been used to investigate the adhesion characteristics of functionalised polyurea microcapsules to surfaces. The adhesion properties of microcapsules (attached to AFM cantilevers) to self-assembled monolayers (SAMs) of alkyl thiols on gold have been investigated at the single capsule level, and as a function of polymer wall surface functionality. Measurements have been made to OH-terminated, CH3-terminated and mixed CH3: COOH-terminated SAMs. The importance of microcapsule topography and elasticity on adhesion measurements has been discussed. The surface pK1I2 of a capsule with a surface modified with a sulfonate-terminated molecule has been estimated using force titration methodology. The adhesion properties of functionalised microcapsules to the leaf cuticle of Prunus laurocerasus have been examined, highlighting areas of hydrophilicity on the surface of the leaf.
The release properties of a ctive ingredients from p olyurea microcapsules into solution using confocal laser scanning microscopy (CLSM) have been investigated. Preliminary studies obtained the optimum species to use inside the microcapsule and the solution into which the species should be released. The release characteristics 0 f six varieties of microcapsule, differing in the wall thickness and cross linking density were examined and from the release profiles obtained, the product of the mass transfer coefficient and solubility coefficient could be calculated.
The high resolution imaging capabilities of the confocal microscope have been demonstrated, providing detail on the structure of the leaf of the Prunus Laurocerasus plant and t he caterpillars Heliothis virescens and P lutella xylostella, two of t he most common pests, which the microcapsules of interest are aimed at controlling. The release properties to leaf surfaces of two types of polyurea microcapsules, which have different release mechanisms, were investigated using CLSM. Detailed release studies to model surfaces showed that one type of capsule (lambda cyhalothrin) released in the dry state and the other (emamectin benzoate) did not. A release rate was determined in the former case.
A technique has been developed which is capable of visualising the release and diffusion of a species (Cd2+) from a hemisphere. Voltammetry has been used in conjunction with CLSM to monitor quantitatively and visually the preconcentration and release of Cd2+ into and away from a mercury hemisphere UME. The fluorescent indicator used was Calcium Green-5N, which is a cadmium-sensitive fluorophore that fluoresces upon binding Cd2+and can thus be detected by CLSM. A delay was observed between the release of C d2+ from t he hemisphere (determined voltammetrically) and binding to the fluorophore (visualised using CLSM) .
AFM CFM CLSM PMPPI TDI SEM SAM XPS PSD DNA FOCG FRAP DI VCR LSM UME AgQRE WE RICM HPLC UV vis FEM 3D
NAA
HMDE MFE LSV o.d. i.d.atomic force microscopy chemical force microscopy
confocal laser scanning microscopy polymethylene-polyphenylisocyanate toluene diisocyanate
scanning electron microscopy self-assembled monolayer
x-ray photoelectron spectroscopy photosensitive diode detector deoxyribosenucleic acid
Fowkes, van Oss, Chaudhury and Goog fluorescence recovery after photobleaching Digital Instruments
video cassette recorder laser scanning microscope ultramicroelectrode
silver quasi-reference electrode working electrode
reflection interference contrast microscopy high performance liquid chromatography ultraviolet
visible
finite element method three dimensional napthyl acetic acid
hanging mercury drop electrode mercury film electrode
linear sweep voltammetry outer diameter
Chapter 1
In
troduction
This thesis is concerned with investigating the structural, release and adhesion
properties of polymeric microcapsules.
This chapter outlines briefly the concept of controlled release systems and
microencapsulation, detailing the procedure by which the microcapsules studied in this
thesis are synthesised and the principles of their action. The chapter goes on to discuss
the principles of self assembled monolayers and how they are applicable as a model
system in these studies.
Areview of the technique atomic force microscopy
(AFM)in
particular an adaptation of
AFMknown as chemical force microscopy
(CFM)is
presented along with an introduction to confocal laser scanning microscopy
(CLSM).Details of how these techniques have been used previously to study microcapsules are
included.
1.1 Controlled release systems
Nature uses controlled release processes to deliver chemical species. Examples
include the oxygenation of blood in mammals by the diffusion of oxygen through the
alveolar walls and the delivery and control of the flow of food and waste across the
exterior membrane of a prokaryote. By mimicking nature's controlled release
mechanisms, it may be possible to develop more efficient and effective means of
delivering chemicals to intended targets SYnthetically. The pharmaceutical industry has
provided a major scientific impetus for this type of technology. There is often concern
over the administration of single, high doses of conventional drugs. This has led to the
development of controlled release oral drugs and more recently implantable devices
l O-l2•In its broadest sense, the concept of sustained or prolonged release of
biologically active agents has existed for decades'f'". The majority of early products
were sustained release systems, meaning that the release of the active agent, although
slower than in conventional formulations was still substantially affected by the external
environment into which it is released. By comparison, controlled release systems
provide a release profile predominantly controlled by the design of the system itself. In
this case, the release of active agents is largely independent of external factors.
Using these principles, scientists in the pesticide field have developed new
technologies and formulations for the delivery of pesticides to required locations, which
have a number of associated advantages'<t'. These advantages include: a reduction in
the hazard associated with the use of highly toxic chemicals; extension of the duration
of effectiveness of the pesticides without increasing the rates of application; improving
pest control efficiency; prolonging the effective life of unstable, volatile or hydrolysable
pesticides; and minimising pollution of the environment.
1.1.1 Microencapsulation
In this project the controlled release mechanism to be studied is the release of an
active ingredient (pesticide) from a microcapsule. A microcapsule is a spherical object
with an outer polymeric shell which encloses the active ingredient. The process by
which
the
microcapsule
with
the
pesticide
oil
inside
is
formed
is
called
microencapsulation. Microencapsulation fabrication processes can be divided into four
main categories: the physical methods category; the phase separation category'; the
9
d he
i J : : .I ·
13multilayer poyelectrolyte film category ; an t e intertacia reaction category' .
1.t
.1.1 Physical methods
In this category, wall material (monomers) and core particles (active ingredient,
Chapter 1 the microcapsule. This is done by one of two methods, either the use of biliquid extrusion nozzles or biliquid multiorifice centrifugal devices18,19. After forming the microcapsule, the polymer wall is hardened by chemical reaction, evaporation of solvent or cooling. These processes have limited use in the microencapsulation of pesticides as throughput is low and it is difficult to produce particle sizes less than 100
urn.
Other physical methods such as spray drying'", spray chilling'! and fluidised bed spray coating'" bring wall and core together via an atomisation process. Problems with these methods include volatility losses and the fact that under most conditions not all of the pesticide is encapsulated and not all of the polymer particles actually contain pesticide.
1.1.1.2 Phase separation methods
In this category, microcapsules are formed by emulsifying or dispersing the core material in an immiscible continuous phase in which the wall material is dissolved, separated physically from the continuous phase and deposited around the core particles. A variety of techniques such as a change in pH, addition of a non-solvent or addition of a salt, force the dissolved polymers out of solution1,23.
There are process control and pesticide loading limitations associated with these phase separation techniques. Reproducible phase separation conditions are difficult to achieve and
it
is difficult to ensure that the phase-separated polymer will preferentially wet the core droplets. As the polymer phase separates from the continuous phase in these processes, causing flow resistance between forming microcapsules, it is not possible to produce pesticide microcapsule formulations with pesticide loading much greater than 240 g active ingredient per litre.1.1.1.3 Polyelectrolyte multilayer methods
A more recently introduced technique for the encapsulat ion of species is the fabrication of supramolecular shell structures (m icro- and nanocapsules) consisti ng of ultra-thin multilayer polyelectrolyte films9. The capsules are produced by the stepwise
adsorption of polyelectrolytes of opposite electric charge from their aqueous solutions onto the surface of colloidal particles. This is followed by the dissolution of the templating core, resulting in the polyelectrolyte capsules being replicas of the templating core. See Figure 1.1 for details of formation.
(a)
(f)
...
(b)
(e)
(c)
I
[image:25.680.127.611.360.796.2](d)
Chapter 1 1.1.1.4 Interfacial polymerisation reaction methods
The interfacial reaction category can be divided into two subcategories:
1. Interfacial addition. These processes use unsaturated monomers and have limited use in pesticide microencapsulation due to the presence of impurities in technical pesticides which interfere with the action of free radical producing catalysts.
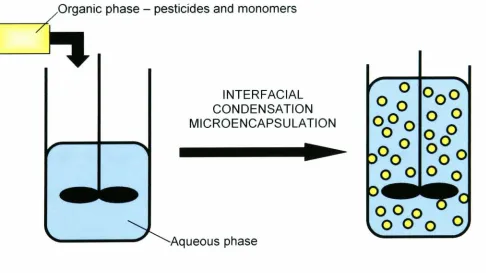
2. Interfacial condensation. In this process two different monomers are brought together at the oil/water interface where they react by condensation polymerisation to form the microcapsule wall. The two different interfacial condensation polymerisation types are demonstrated schematically in Figure 1.2.
WATER OIL
MonomerC Monomer 0
Solvent TYPE II
OIL Monomer A WATER
Monomer B TYPE I
Figure 1.2 Interfacial condensation polyme risation processes. Reproduced from reference 1.
Type I - One reactive monomer is incorporated in the organic phase (monomer A) and a second in the aqueous phase (monomer B). Typic ally the organic phase monomer is a
polyfunctional isocyanate and the water phase is a polyfunctional amine24-26. Interfacial
polymerisation occurs rapidly at ambient temperatures.
Type II - Monomers are incorporated in the oil phase only and are polymerised
interfacially by increasing temperature.
Interfacial conde nsation microencapsulation processes are very suitable for the microencap sulat ion ofpesticides as they are characterised by high pesticide loadin g and uncom plicated processing steps.
1.1.2 Preparation of Microcapsules used in this project
The interfacial condensation microencapsulation process (Type II) is used to
make the microcapsules used in this project. The process involves first dissolving the monomers in the pesticide oil to be encapsulated to form the organic phase. The
aqueous phase is then prepared by addition of emulsifiers and protective colloids to water. The next step is to add the organic phase to the aqueous phase with appropriate agitation to form an oil-in-water emulsion with an avera ge particle size in the range of
[image:27.680.96.582.391.664.2]2-15 urn. Finally the microcapsule wall formation is initiated by heating the batch.
Figure 1.3 demonstrates schematicallythe process involved.
Organic phase - pesticides and monomers
INTERFACIAL CONDENSATION MICROE NCAPSULATIO N
---.~
Aqueous phase
o
~
000
00
0
0
0 0 0 0
o
0
00
o
0 0
0 0 0 0
DISPERSING - form oil/water emulsion HEATING - form microcapsulewalls Figure1.3 - Process steps in interfacial condensation polymerisation. Reproduced from reference 3.
Two interfacial condensation microencapsulation systems were involved in the synthes is ofmicrocapsules used in these studies. These are known as the polyfunctional
isocyanate system, which produces the microcapsu les predominantly studied, and the
Chapter 1
In the polyfunctional isocyanate system, the monomers that are incorporated in
the organic phase to form the wall of the microcapsule s are polymeth
ylene-polyph enylisocyanate (PMPPI) and toluene diisocyanate (TOI) (Figure 1.4).
NCO NCO NCO
NCO
NCO
toluene diisocyanate (T OI)
polymethylene-polyphenylisocyanate (PMPPI)
Figure 1.4 Monomers used in the polyfunctional isocyanate microcapsule system
The wall forming reaction is initiated when the oil-in-water emulsion is heated
to 50 °C, at which point the isocyanate monomers are hydrolysed at the interface (slow
step) to form amines which in turn react with unhydrolysed monomers to form the
microcapsul e wall.The mechanism is shown in Figure 1.5.
HO
•
-NCO + H2O
•
I II -NH2+ CO2-N-C-OH Heat
Isocyanate Carbamic Acid 50°C Amine
0
II
-NCO + -NH2
•
-N-C-N-I
I
Isocyanate Amine H H
Polyurea
Figure 1.5Wall forming reaction for the polyfunctional isocyanatemicrocapsule system.
The interfacial reaction occurs on the oil side of the interface and is limited to
the interface because of the unavailability of water in the core of the oil particle. Water
diffuses into the oil droplet, across the interface and reacts with isocyanate monomers
diffusing from the core of the particle to the interface. As interfacial polymerisation i
initiated by water which is at its highest concentration at the interface. decreasing as the
distance increases fro m the interface.the wall formed is asymmetric in constructi on.
The structure of the wall of the microcapsule can be altered by dissolving a
modifier molecule in the aqueous phase prior to making the emulsion. Some of the modifie rs will react into the capsu le wall (via reaction between amine group(s) and isocyanate). The modifiers enable the wall of the microcapsule to become charged (for further details see section 3.2)
In the second system used for microcapsule formation, the aminoplast prepolymer system, the wall forming agent used is a butylated urea-formaldehyde prepolymer, the structure of which is shown in Figure 1.6.
Figure 1.6 Butylated urea-formaldehyde pre-polymer used in the aminoplast pre-polymer microcapsule.
R = alkyl naphthalene Surface active
sulfonic acid catalyst
Aminoplast prepolymer
at organic side of interface in o/w
emulsion
[
'-.".N
~6Bu
I
IH
Chapter 1
l
'-.".N/"--.... N/
I
I
poly( urea-formaldehyde) microcapsule wall
'-.".N~O~N/
I
I
Figure 1.7 Wall-forming reaction for the aminoplast pre-polymer microcapsule system.
The polymer formed is then cross-linked with a tetrafunctional thiol
(pentaerythritol tetrakis(3-mercaptopropionate) - for structure see Figure 1.8) to
complete the microcapsule wall. The crosslinking mechanism is shown in Figure 1.8.
HSR
=
+ HSR ---.. ""'N
~SR
+ SuOH + H+I
Figure 1.8 Cross linking mechanism used in the formation of the microcapsule wall in the aminoplast prepolymer system, showing the structure of the crosslinker pentaerythritol tetrakis(3-mercaptopropionate) (HSR).
1.1.3 Microcapsules - Current knowledge and reasons for study
The microcapsules discussed in this thesis are used to deliver pesticides to leaf
and soil sam ples. The microcapsule, after release from a source site such as a spray,
adheres to the surface ofa leaf or soilparticulate. Release ofthe active ingredient occurs
by diffusion from the microcapsule, through the polymer wall and away. The nature of
the adhesion process and local perm eabilityofmicrocapsules are still little understood .
The stru cture ofthe polymeric wall ofthese microcapsules has been investigated
using scann ing electron microscopy (SEM) and the membrane shown to be asymmetric
in construction as predicted in section 1.1.23. In Figure 1.9 a scanning electron
micrograph of an artificially broken microcapsule is shown and a thin (0.05 urn) outer
dense layer can be observed in addition to a much thicker (0.5 urn) spongy underlayer.
The thin outer dense layer is the working end of the membrane offering
resistance to the flow of pesticide. The thick inner spongy layer provides mechanical
support .
Figure 1.9 Artificially broken microcapsule made using the polyfunctional isocyanate microcapsule system - Magnification:5200. Reproduced from reference 3.
The release rate of pesticid e from the microcapsule has also been studied. The
microcap sul e release rate (diffusion mecha nism) is described in equation 1.1.
dM (4JZUb)p (C1-
C
J
-
- =
release rate=
....:...-_--=---2...--=---=~m
b-a1.1
whe re 4Jrab is the surface area of the sphere, Cj-C2 is the concentrati on
differen ce across the polymer wall, b-a is the thickness of the microcapsule \ all. P is
the pemleabi lity of the microcapsule. Figure 1.10 gives a schema tic represent ation of
Chapter 1
Core of sphere
Inner wall of capsule
Outer wall of capsule
Figure 1.10 Schematic representation of microcapsuledemonstrating parameters included in the release rate equation 1.1.
Equation 1.1 shows that the release rate of the microcapsule is directly
proportional to the surface area, permeability and concentration difference across the
wall and is inversely proportional to wall thickness.
The concentration difference across the wall is generally considered to be a
constant when the microcapsule is exposed to foliar or a soil environment. The foliage
or soil acts as a 'sink' for pesticide and hence pesticide exists at a very low
concentration at the outer surface of the microcapsule. The average particle radius and
wall thickness are generally fixed within narrow limits to satisfy process and physical
stabi lity conditions.
This means that the release rate from the microcapsule can only be varied by
varying the permeability of the wall. For a given pesticide, the permeability is defin ed
as the product of the solubility coefficient and the diffusion coefficient as described in
. 1 ') equation .~ .
P=DK
1.2where
P
is the perm eability of the microcap sule wall, D is the di ffusion coeffici ent of the active ingredi ent across the wall and K is the solubility coefficient ofthe active ingredi ent into the polymer wall. Varying the chem ical composition of the
wall can vary the solubility coefficient and varying the cross-link density of the wall can
vary the diffusion coefficient.
For example, in the polyfunctional isocyanate system, varying the ratio of
PMPPI to TDI can vary the cross-link density. The higher the ratio of PMPPI to TDI,
the more cross-linking and hence lower the diffusion coefficient and the lower the
permeability.
The solubility coefficient of the wall is related to the ease with which a given
pesticide can partition from the core into the wall. The closer the chemical composition
of pesticide is to the chemical composition of the wall, the greater the solubility
coefficient and greater the permeability.
1.2 Self-Assembled Monolayers
One of the ultimate aims of the studies herein was to investigate the adhesive
properties of individual functionalised microcapsules to first, a surface of known
functionality, second, a representation of a leaf surface and finally, the leaf itself. The
self assembly of alkyl thiols on gold provide an ideal surface whose functionality can be
altered, simply by altering the tail group of the alkyl thiol from which the self assembled
monolayer (SAM) is formed.
SAMs involve the spontaneous formation of monolayers of long chain organic
molecules on solid surfaces, resulting in an ultra thin film with a high degree of
structural order. They are characterised by a strong chemisorption bond that ties the
molecules to the surface and by lateral interactions between molecules that favour a
densely packed and locally crystalline environment'.
The surfaces used are most commonly metals such as gold, silver, mercury,
platinum or copper
27-3 1,although surfaces such as mica or silicon
32-J 4
Chapter 1
employed. Gold surfaces have been studied predominantly, particularly with organic
molecules containing a thiol group, where linkage proceeds via a Au-S bond35-4o.
The properties of the gold upon which the SAM is formed have been
investigated and it was found that a better coverage ofmonolayer was obtained after the
gold had been annealed at high temperatures for period oftime4 1-43.
Studies of SAM formation from a dilute solution indicate that for moderate
concentrations (1 mM) a well ordered full coverage is achieved within an hour44.
Monolayer formation proceeds by the initial adsorption ofmolecules in a configuration
parallel to the gold surface. As the surface concentration becomes greater, a transition
occurs and clusters of molecules form which rearrange, through surface diffusion, to the
most stable packing structure45.
SAMs have many advantages in that they are robust and extremely versatile. An
infinite variety of structures can be created by, for example, changing the length of the
alkyl chain or the functional group at its end or by co-adsorbing two or more different
molecules at the same time. A schematic representation of SAMs of alkanethiols gold
is shown in Figure 1.11.
H
n~
55555555 I I I I I I I I
~H~ ~
55555555
I I I I I I I I
GOLD
HS(CH 2)JCH3+ HS(CH2)14CH3
HS(CH2)11C02Fc+ HS(CH2)JCH3
Fe Fe Fe
H
~ ~
SSSSSSSS
I I I I I I I I
Figure 1.11 Schematic represe ntation of some of the supramolecular structures possible with SAMs of thiols on gold. Reproduced from reference 2.
In order to simulate the waxy surface of a leaf, mixed SAMs must be forme d as
the surface of a leaf consists of approximately 5-20% hydrophilic sites and 80-95%
hydrophobic sites". Mixed SAMs have been studied extensivcly'" notably by Bain and
Whitesides who carried out detailed investigations of the variation of head group, tail
group, and alkyl chain length of thiols coadsorbed onto gold6,48.
Characterisation of the properties of these mixed mono layers was carried out by
contact angle measurements and x-ray photoelectron spectroscopy (XPS). It was found that the relationship for the coadsorption of methyl (CH3) terminated thiols and
carboxylic acid (COOH) terminated thiols was not linear with the concentration ratio in
solution. Rather, there was a strong preferential adsorption of the apolar methyl
terminated thiol. Thus, using XPS, it was found that the ratio of the concentrations of
the two components on the surface of the mixed monolayer differed from that in
I . 6 so ution .
Figure 1.12 is a reproduction of these results showing a graph of the mole fraction
of an alcohol, bromide, nitrile or carboxylic acid terminated thiol in a solution
containing this thiol and a methyl terminated thiol (XPsolution) , plotted against the mole
fraction of thiol of interest that was present in the SAM (XPsurface) determined by XPS.
• Alcohol 6. Bromide o Nl1rlle
• Carboxylic Acid
1.0 0.6 0.8
0.4
0.2
/
f
.....
:
.·
....
.' . .. .
"A
•
•
•
i
p
s
.:
.
..
/
6
..
.
•
:?
.·: .0
1.0 0.8 0.6 P
X
surface 0.4 0.2 0 0x
P so tut lonFigure 1.12 Graph showing the comparison between mole fractio~ of thiol in a.n original
1.3 Chapter 1
1.3 High resolution microscopy
1.3.1 Atomic Force Microscopy (AFM)
One type of high-resolution microscopy employed in this project is AFM. AFM belongs to a group of techniques known as scanned probe microscopies. The AFM was introduced by Binnig, Gerber and Quate in the mid-80's49. They developed the idea of using a force sensing cantilever, with an attached very sharp tip, which was capable of measuring the force between the apex of the tip and substrate at the nm level.
The AFM is complementary to other force measuring techniques such as surface force apparatus", optical tweezers51,52 and interfacial force microscopy ', among others. However, these techniques lack the ability to provide high spatial resolution mapping of forces. The key interactions which control the adhesive properties of microcapsules to surfaces are electrostatic54, hydrophobicY", steric", capillary'" and Van der Waals59all of which are measurable by AFM.
In AFM, the cantilever stiffness reflected in the spring constant, k, is usually such that the cantilever deflects, rather than the substrate deforming upon tip contact with the surface.
The spring constant of a rectangular cantilever loaded with a negligible mass can be estimated using equation 1.3:
k
=E;(fJ
where w, t, and I are the width, thickness and length of the cantilever and Eis the Young's modulus, a measure of the elasticity of the material employed.
The integrated cantilever-tip assemblies can have single or V-shaped beams'" and normal spring constants in the range 0.01-100 N m-I. The k value can be varied by changing the physical characteristics, t,I and w of the lever. Albrecht et al. were the first
to fabricate silicon nitride microcantilevers61. Today they aremass-produced from either
silicon or silicon nitride based materials.
To monitor and maintain a constant deflection of the cantilever a feedback
system is employed. A laser is shone onto the back surface of the cantilever and
reflected back onto a split photosensitive diode detector (PSD). As the cantilever bends
the movement of the reflected beam is detected by the PSD.The tip-substrate separation
is adjusted to maintain a constant cantilever deflection, in a closed feedback loop, and
for contact mode imaging, a topographical image is obtained in this way. A sharp tip
attached to the cantilever spring follows the contour of the surface.
The sharper the radius of curvature of the tip apex, the higher the resolution of
the image (~ nm level). A schematic representation of an experimental AFM set-up is
shown in Figure 1.13.
Cantilever~
L..5~~!...
_ _JSample
Laser
Piezo Stack Mirror
AFM controller
and PC
[image:37.676.115.608.483.736.2]Photodiode detector
Figure 1.13 A schematic of a typical AFM experim~ntal.apparatus showing a V-shaped silicon nitride cantilever with a close up of the pyramidal tip.
In addition to topographi cal imaging, however, the AFM can also probe
Chapter 1
and the substrate such as local adhesive forces. It is this latter property ofAFM that will
be exploited in this project.
Force values are determined from the normal displacement, !:1z, ofthe cantilever
from its resting position. With an instrumental sensitivity on the order of0.1
A
,
minimalforces in the range of 10-13_10-8 N (depending on cantilever thickness) can be
measured". This means that in principle, the AFM can measure molecular interactions
ranging from weak Van der Waals «10-12N) to strong covalent (10-7 N) bonds62.
The AFM can record the amount of force felt bythe cantilever as the probe tip is
brought close to a sample surface and then pulled away. The deflection of the cantilever
is recorded during approach and retract and a force-distance curve is produced, an
example of which is shown in Figure 1.14 . Experimentally this is done by applying a
triangular wave voltage pattern to the z-axis scanner causing it to expand and then
contract in the vertical direction generating relative motion between the probe and
sample.
A
B
C
D
1
FORCEE A
ADHESION FORCE
E
i
[image:38.680.103.606.548.878.2]SCANNER Z - POSITION
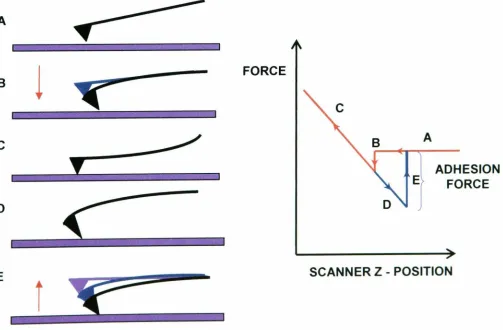
Figure 1.14 Schematic representation of anAFM force-distance (approach) curve.
The cantilever position at several points along the force curve
inFigure 1.12 is
shown to the left of the curve. At position A, the beginning of the measurement, the
cantilever is not in contact with the surface. If the cantilever feels a long-range attractive
(or repulsive) force then it will deflect downwards (or upwards) before making contact
with the surface. In the case shown, there is minimal long-range force so the force curve
shows no deflection response from the cantilever.
At position B the probe tip is brought very close to the substrate and if there is
sufficient attractive force (often a Vander Waals attractive force), it 'jumps into
contact'. At position C, the tip is in contact with the substrate and as the tip pushes
against the surface, the cantilever deflects upwards. This region is known as 'constant
compliance'. For hard substrates, the distance the cantilever deflects is equal to the
distance moved by the tip (or substrate) as they are pushed against each other.
After loading the cantilever to a desired force value, the process is reversed
(position D). As the cantilever is withdrawn, adhesion or bonds formed during contact
with the surface may cause the cantilever to adhere to the sample past the initial contact
point B.
The key measurement of the AFM force curve is the point at which these
adhesion forces are broken and the cantilever comes free from the surface (position E).
The observed cantilever deflection is converted to a force using the cantilever spring
constant.
Chapter 1
the thickness and modulus of elasticity of cantilevers are not very easy to determine and
if the back of cantilevers are coated with aluminium or gold, to increase the reflectivity,
the influence on the mechanical properties is difficult to assess. A method to determine
the spring constant of a cantilever experimentally is therefore extremely desirable and a
number of experimental methods have been developed.
A non-destructive technique was used by Cleveland et a1
65,which involved
measuring the change in resonance frequency of the cantilever,
vo.as a range of end
masses were added to the cantilever, secured to the beam by capillary action.
The dependence of
Voas a function of the end mass,
M,can be described by
equation 1.4:
1.4
where
mais the effective mass of the cantilever. Rearranged, this equation gives:
1.5
A linear plot of added mass versus
1/(21lVo)2gives a straight line of gradient
k,and intercept
ma.
Hutter et al
66found a value for the spring constant of a cantilever by measuring
the deflection of the cantilever in response to thermal noise. A vibrating cantilever can
be described as a simple harmonic oscillator. Thus, in the absence of external forces and
other noise sources, the root mean square amplitude of the tip,
Arms,can be related to the
temperature of the system,
T:
( J
1I 2
A,.ms
=kt
1.6where
keis the Boltzmann constant
(kB=
1.382
X10-
23J K-
1) .If
Armsis measured
at a fixed temperature. it is possible to estimate
k.A method employing hydrodynamics has been demonstrated by Maeda and
Senden'". A macroscopic model of a cantilever was used to obtain a semi-empirical
relationship between the response to the distributed load on the cantilever due to viscous
drag and the response on known point loads at the end of the cantilever. From this the
spring constant of the cantilever was determined by measuring the hydrodynamic
deflection due to the linear movement in liquid.
Several groups68-71 have reported methods that use a reference cantilever with a
known spring constant for calibration. When pressing the cantilever to be calibrated
against the reference cantilever, the spring constant can be calculated from the measured
defelection. A fast and simple method for measurement of spring constants was
presented by Holbery et al
72,measuring the constant using a nanoindentor. The
instrumentation required for these measurements is expensive and so other techniques
are preferred.
The other parameter which needs to be characterised is tip radius. This affects
the contact area between the tip and sample, i.e. the number of molecular contacts.
Estimates of tip radii are obtained by inspection of electron microscope images
73,74,
or
by profiling sharp features 75-79, uniform latex spheres
80,81
or colloidal gold clusters on
the surface82,83. One method by which the actual tip radii is known is to use spheres of
defined diameter, attaching them to the end of the AFM cantilever to act as the tip54.
This method, known as colloidal force microscopy, is relevant for the studies in this
project, as spherical microcapsules of known diameter are attached to the tip of an AFM
cantilever. This method is discussed later in this introduction.
Chapter 1 layer of water on the surface of the substrate, on the tip. These forces cause the tip to be pulled onto the surface with greater force potentially causing damage to soft samples.
Capillary forces can be minimised by immersing the sample in solution, notably water. Weisenborn and co-workers'" noted that the typical adhesive force of 100 nN between a silicon nitride tip and a mica surface in ambient air could be reduced by a factor of 100 by immersion in water.
Capillary forces were used advantageously by Mate and others'" who recorded the distance between the onset of the capillary force and the point at which the AFM tip contacts the surface. From this they could measure the thickness of the adsorbed molecular layers (ca. 2 nm).
For AFM probing of the adhesion forces between the tip and substrate it is extremely important to work under solution so that the dominating capillary forces are minimised. Moreover by adjusting the properties of the solution it is possible to make measurements such as the effect of electrostatic double layer tip-sample force as a functichon 0f pH an rome strengtd . , h5986 87" .
The ill-defined geometry of the AFM tip becomes a problem when comparing measured force-distance profiles between an AFM tip and a surface to theoretical models. Hutter et al88 have demonstrated an approach to get a better defined geometry by etching silicon AFM tips in an oven in the presence of oxygen to obtain tips with a
spherical end of defined radius.
15489 d The colloidal probe technique was first developed by Ducker et a ' an Butt59, providing a more universal solution to the problem by replacing the tip with a colloidal particle of well defined spherical shape. Since then. it has become a well established and powerful technique for the study of surface forces. The measuring
principle involved predestines it for the investigation of particle-surface interactions
,
making single particle experiments feasible.This technique has been used to study the dependence of force between a particle and a surface on applied load and contact time90-95. Other factors investigated include the influence of humidity96,97 and surface roughness98-102, and also the effect of surface coverage with polymersl03-107.
The technique has also been used to probe adhesion forces in technical applications such as mineral flotation108-1 11, conductive surface coatings112, powder inhalation systems for drugs113-116, printing117-119 and stainless steel polishing'<",
1.3.2 Chemical Force Microscopy (CFM)
Although force microscopy can provide nanoscale information about friction, adhesion and compliance, conventional force measurements lack chemical specificity. To overcome this apparent limitation of AFM, it is possible to chemically modify the probes to make them sensitive to specific molecular interactions. The ability of the chemically modified tips to distinguish between chemically distinct functional groups has led to this variation of AFM being called chemical force microscopy (CFM).
To be able to probe interactions between functional groups, the tip must be modified with well-defined molecular layers. One successful method which has been reported74,121,122 is the use of self assembled monolayers (see Section 1.2) of functionalised organic thiols on gold-coated silicon or silicon nitride tips (Figure 1.15). Covalent modification of AFM probes with thiols and silanes has been well reported, including studies of adhesion73.l23-128, contact potential':' and surface
~
GOLDU
V
DEPOSIT~ON
'\::(/I
SUBSTRATEI
X and Y = CH3, COOH,CH20H, NH2
RSH
•
COVALENTSAM
[image:44.688.127.555.58.298.2]Cha pter 1
Figure 1.15 Scheme for the chemical modification of tips and sample substrates.ln thiscase the tip and substrate have been modified with thiols which have end groups which are capable of hydrogen bonding with one another leading to enhanced interaction.
As discussed earlier, the experimental env ironm ent in which the surfaces of the
tip and substrate interact plays a crucial role in determining the measured forces. To
probe bare interactions (i.e. interactions resulting from solid-surface free energies),
adhesion forces must be measured in ultra-high vacuum . If force measurements are
carried out in ambient air, capillary forces62,130dominate, which are usually 1-2 orders
of magnitude larger than the specific chemical interacti on s, making interpretat ion
extremely difficult.
Measurements carried out in dry, inert gas atmospheres are a better
representation of the chemical sens itivity of bare interaction s73J25 but it is difficult to
excl ude or account for the presence of adsorbed vapour on high energy surfaces whe n
interpreting measurements. The capillary effect can be elimi nated if measurements are
. d ' I' .d ' d f . 84 131 Adhes i c: t ' I' ,d 'II
carn e out In iqui instea 0 air ' , esion rorce measurem en s In iqui WI
refl ect the interplay betw een surface free energies of solvated groups,
The ben e fits of AFM stud ies in liquid have been rep ort ed . especiall in
reference to biological systems I32.133. It has been found that images of biomolecul es are
'y "
highly dependent on adhesive forces'r'", which can be sensitive to solution pH and ionic
strength 59,135,136and surface composition137.
Work with covalently modified tips and substrates includes a study by Char les
Lieber and co workers at Harvard122 who bound functionalised thiol mon olayers to
gold-coated AFM probes and samples. By varying the functional groups terminating the
monolayers on the tip and sample, they studied the adhesion and friction between
combinations of methyl (-CH3) and acid (-COOH) functional groups. Force curves and
images obtained from these studies are shown in Figure 1.16.
(a) (b)
25IJm
Figure 1.16 (a) Representative force distance curves in ethanol recorded for GOOH/GOOH,
GH:/CH
3 and CH:/COOH tip-sample functionalisation (tip radius - 60 nm). (b) Image of
patterned CH3 / COOH SAM determined from friction measurements using GFM with a
methyl-terminated tip. Reproduced from reference 4.
The observed trend in the magnitudes of the adhesive interactions between
tip/sample functional groups - COOH/COOH > CH3/CH3> CH3/COOH - agrees with
the qualitative explanation that interactions between hydrogen-bonding gro ups (i.e.
COO H) will be greater than between non-hydrogen-bonding gro ups (i.e.CH3)·
CFM has many biological applicatio ns as well. It has been used to measure
forces between com pleme nta ry strands of DNA138. DN A oligonucleotides were