University of Warwick institutional repository: http://go.warwick.ac.uk/wrap
This paper is made available online in accordance with
publisher policies. Please scroll down to view the document
itself. Please refer to the repository record for this item and our
policy information available from the repository home page for
further information.
To see the final version of this paper please visit the publisher’s website.
Access to the published version may require a subscription.
Author(s): C. Aerts, G. Nelemans, H. Hu, C. S. Jeffery, V. S.
Dhillon, T. R. Marsh, R. Østensen, M. Vučković
Article Title: The binary properties of the pulsating subdwarf B eclipsing
binary PG 1336-018 (NY Virginis)
Year of publication: 2007
Link to published article:
http://dx.doi.org/10.1051/0004-6361:20077179
/
c
ESO 2007
Astrophysics
&
The binary properties of the pulsating
subdwarf B eclipsing binary PG 1336
−
018 (NY Virginis)
M. Vuˇckovi´c
1, C. Aerts
1,2, R. Østensen
1, G. Nelemans
2, H. Hu
1,2, C. S. Je
ff
ery
3, V. S. Dhillon
4, and T. R. Marsh
51 Institute for Astronomy, K.U. Leuven, Celestijnenlaan 200D, 3001 Leuven, Belgium
e-mail:[email protected]
2 Department of Astrophysics, Institute of Mathematics, Astrophysics and Particle Physics (IMAPP), Radboud University,
6500 GL Nijmegen, The Netherlands
3 Armagh Observatory, College Hill, Armagh, BT61 9DG Northern Ireland
4 Department of Physics and Astronomy, University of Sheffield, Sheffield S3 7RH, UK 5 Department of Physics, University of Warwick, Coventry CV4 7AL, UK
Received 26 January 2007/Accepted 24 May 2007
ABSTRACT
Aims. We present an unbiased orbit solution and mass determination of the components of the eclipsing binary PG 1336−018 as a
critical test for the formation scenarios of subdwarf B stars.
Methods. We obtained high-resolution time series VLT/UVES spectra and high-speed multicolour VLT/ULTRACAM photometric
observations of PG 1336−018, a rapidly pulsating subdwarf B star in a short period eclipsing binary.
Results. Combining the radial velocity curve obtained from the VLT/UVES spectra with the VLT/ULTRACAM multicolour
lightcurves, we determined numerical orbital solutions for this eclipsing binary. Due to the large number of free parameters and their strong correlations, no unique solution could be found, only families of solutions. We present three solutions of equal statistical significance, two of which are compatible with the primary having gone through a core He-flash and a common-envelope phase de-scribed by theα-formalism. These two models have an sdB primary of 0.466Mand 0.389M, respectively. Finally, we report the detection of the Rossiter-McLaughlin effect for PG 1336−018.
Key words.stars: subdwarfs – stars: binaries: eclipsing – stars: general – stars: variables: general – stars: oscillations – stars: individual: PG 1336−018
1. Introduction
The subdwarf B (sdB) stars are generally acknowledged to be core helium burning stars with a canonical mass of approximately 0.5M. Their thin, inert hydrogen envelope (Menv<∼0.02M) places them on the hot extension of the Horizontal Branch (HB), the so-called Extreme Horizontal Branch (EHB). Since the hydrogen envelope is too thin to sustain nuclear burning, these stars will not go through the Asymptotic Giant Branch and Planetary Nebula phases. Instead, when their core helium has run out, they will enter a He-shell burning phase, where they expand and heat up, making them appear as sdO stars before they evolve directly onto the white dwarf cooling se-quence. Even though the models describing the future evolution of the sdB stars are generally accepted (e.g. those of Dorman et al. 1993), the current evolutionary state of the sdB stars is still poorly understood. The fact that sdB stars must have lost almost all of their hydrogen layer atexactly the same time when the helium core has attained the minimum mass required for the he-lium flash to occur, makes them enigmatic from an evolutionary point of view. To loose such an amount of mass, they must suffer considerable mass loss during the red giant branch (RGB) phase, and most probably also during the helium core flash. The most fundamental missing piece to our understanding of the evolution Based on observations collected at the European Southern
Observatory, Chile. Program ID: 075.D-0174.
of the sdB stars, apart from the physics during the helium core flash, is the nature and physics behind this mass loss (Fusi-Pecci & Renzini 1976).
In recent years it has been discovered that a significant frac-tion of sdBs are in binaries. Maxted et al. (2001) found that about two-thirds of the sdB stars in the field are members of bina-ries. Napiwotzki et al. (2004) found a binary fraction of 40% among stars in the SPY (Supernova type Ia Progenitor) survey sample, while Morales-Rueda et al. (2006) found 48% in a sam-ple from the Edinburgh-Cape (EC) survey. Many of the binary sdBs are found to be in short period systems with periods from a few hours to several days, with companions being either white dwarfs or M-dwarfs (Morales-Rueda et al. 2003). The peculiar frequency of binarity has been an important constraint on evolu-tionary population synthesis theory, and has led to the acknowl-edgment that the binarity has to play a key role in the forma-tion channels for sdB stars. There are several binary mechanisms proposed by (Han et al. 2002, 2003, and references therein) as formation channels for sdB stars:
1. common envelope ejection, leading to short-period binaries with periods between 0.1 and 10 days and an sdB star with a very thin hydrogen envelope, and with a mass distribution that peaks sharply at 0.46M. Depending on the secondary, a main-sequence star or a white dwarf, the subchannels are called the first CE ejection channel and the second CE ejec-tion channel, respectively;
2. stable Roche lobe overflow, resulting in similar masses as in 1. but with a rather thick hydrogen-rich envelope and longer orbital periods between 10 and 100 days;
3. double helium white dwarf mergers giving rise to single sdB stars with a wider distribution of masses.
Detailed investigation of sdB binaries is crucial in order to de-termine their masses for comparison with the theoretically pro-posed evolutionary channels. New momentum in the efforts to resolve the evolutionary paths of sdB stars came a decade ago, after the discovery that some of them pulsate (Kilkenny et al. 1997). This has opened up a new window into their interiors via the techniques of asteroseismology and stimulated a burst of re-search. Extensive search campaigns have revealed two classes of pulsating sdB stars known as short period sdB variables (sdBV or V361 Hya stars, formerly EC 14026 stars, after the proto-type) and long period sdB variables known as PG 1716 stars (or lpsdBV stars, Green et al. 2003).
The sdBV stars, discovered by Kilkenny et al. (1997) and in-dependently theoretically predicted by Charpinet et al. (1996), are low amplitude multimode pulsators with typical periods ranging between 100−250 s. Their pulsation amplitudes are gen-erally of the order of a few hundredths of a magnitude. The short periods, being of the order of and shorter than the radial funda-mental mode for these stars, suggest that the observed modes are low-order, low-degreep-modes (Charpinet et al. 2000). The 39 known sdBV stars occupy a region in theTeff– loggplane with effective temperatures between 28 000 K and 36 000 K and surface gravities (logg) between 5.2 and 6.2.
The detailed asteroseismological modelling of sdBV stars is hampered by the fact that there are too few pulsational frequen-cies to fit those predicted from non-rotating or rigidly rotating models (Brassard et al. 2001; Charpinet et al. 2005; Randall et al. 2005). However, the observed frequency spectra are too dense to be accounted for by only low-degree ( ≤ 2) modes. In order to have a unique asteroseismological model we need to have ac-curate pulsation frequenciesandan unambiguous identification of the modes of oscillation (spherical wavenumbers andm). Thanks to multisite campaigns by the WET1devoted to resolv-ing the frequency spectrum of sdBV stars in the last decade, we do have extensive and reliable frequency lists for several sdBVs. The problem lies in the second requirement mentioned above, the unambiguous mode identification. There are only two ways this can be achieved: through line profile variations (Aerts & Eyer 2000) or the amplitude ratio method (Dupret et al. 2003; Randall et al. 2005).
As sdBV stars are quite faint (the brightest one ismB=11.8) and their periods are very short, the line profile variation method poses a real challenge considering the low S/N that accompa-nies any high-resolution time-resolved spectroscopy, even with the biggest telescopes available. Hence, the line profile varia-tion method has not yet been reliably applied to any sdBV star. The amplitude ratio method is not problem free either. Due to the very low pulsational amplitudes, the photometric errors are usually too large for unambiguous identification of the spherical degreeof the modes, especially to distinguish between =0, 1 and 2 modes (Jeffery et al. 2005).
Among the binary sdB stars, four eclipsing sdB systems have been discovered that all show a deep and strong reflection ef-fect, with very short orbital periods in the rather narrow range of 130−170 min. Such short orbital periods imply that they must have evolved through binary mass transfer and common en-velope evolution. Out of these four systems, namely HW Vir
1
http://wet.physics.iastate.edu/
(Wood et al. 1993; Menzies & Marang 1986), NY Vir (Kilkenny et al. 1998) (hereafter PG 1336−018), HS 0705+6700 (Drechsel et al. 2001) and HS 2231+2441 (Østensen et al. 2007), only onesystem contains a rapidly pulsating sdB star as a primary: PG 1336−018. As such, this system provides a natural labora-tory for detailed evolutionary and asteroseismic analyses, which is the purpose of our project.
PG 1336−018 was classified as an sdB star in the Palomar-Green survey (Palomar-Green et al. 1986) and shown to be a close eclipsing binary with short-period multimode light variations by Kilkenny et al. (1998). Assuming the primary mass to be the canonical sdB mass of 0.5M, Kilkenny et al. (1998) find that the secondary must be a mid-M dwarf with a mass of about 0.15M. Soon after its discovery, PG 1336−018 was a tar-get of two Whole Earth Telescope (WET) campaigns, Xcov 17 in April 1999 (Kilkenny et al. 2003) and Xcov 21 in April 2001. These white light data resolved more than 20 frequencies in the temporal spectrum (Kilkenny et al. 2003) in the range from 5000 to 8000µHz. Even though the frequency content of the star is thus known very precisely, an adequate asteroseismic model is still lacking mainly due to the lack of an unambiguous mode identification. The colour behaviour is needed for photomet-ric mode identification to identify the sphephotomet-rical degree of the modes and to discriminate between the numerous possible seis-mic models. To further reduce the allowable seisseis-mic model space we need to examine line profile variations due to the pulsa-tions in order to disentangle the azimuthal wavenumberm. Only with the accurate pulsation frequencies and an unambiguous mode identification can the asteroseismology provide the accu-rate mass estimate needed for confrontation with those predicted from the formation scenarios for sdB stars.
PG 1336−018, being theonlyrapidly pulsating sdB star in an eclipsing binary, is the only star with enough potential to confront the proposed evolutionary scenarios, as the eclipses help constrain the inclination and radii. Therefore we study PG 1336−018, this time armed with new multicolour photomet-ric and spectroscopic VLT data. In this paper we present the new data and the orbital solution. This is the first step toward our ulti-mate goal, an accurate mass determination of PG 1336−018 and a critical test of current stellar evolution theory.
2. Observations and data reduction
2.1. Photometry
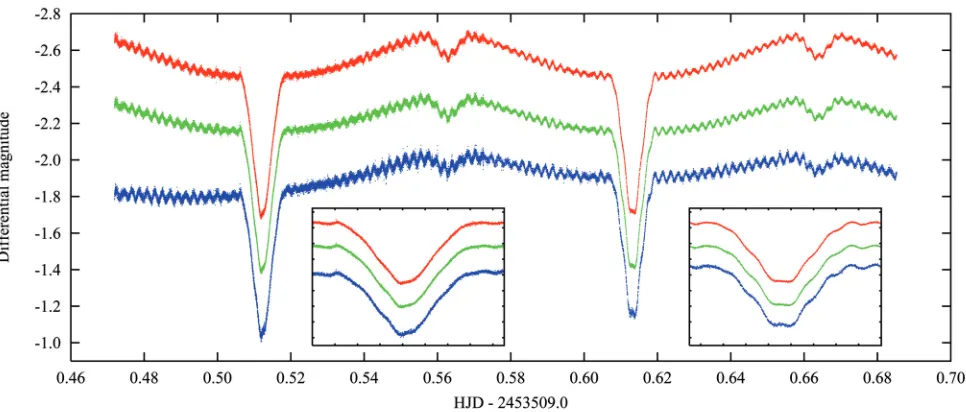
Fig. 1.ULTRACAM/VLTr(upper),g(middle) andu(bottom) lightcurves of the eclipsing sdBV star PG 1336−018 from 2005 May 18/19. The insets show enlarged sections of the two primary eclipses, where pulsations are clearly visible. The differences between the two consecutive primary eclipses, apart from the noise, are due to the beating of the modes and different phases covered during the eclipse. The shape of the
ulightcurve is discussed in the text. The ordinate is the differential magnitude, and the abscissa is Fractional Julian Date.
All data frames were reduced using the ULTRACAM pipeline reduction software (Dhillon & Marsh 2001). Care was taken to select the most optimal choices offered in the reduc-tion software. The “normal” extracreduc-tion method with the “vari-able” aperture sizes, as they track local changes in the seeing disk, gave the best results. Several apertures were tried out and an aperture of 1.7 times the FWHM gave the highest S/N forr andgband. The star counts were divided by the comparison star counts and converted to obtain a differential magnitude (V−C) in each filter. As both the target and the comparison star were in the same field, differential photometry accounted well for the vari-ations in the sky transparency and extinction inrandgband. Unfortunately, the only comparison star within ULTRACAM’s 2.6 arcmin field of view on the VLT is very faint in the blue, resulting in poorer differential photometry in the u compared to the r and g band. Therefore, a wider aperture had to be used for theuband. Due to the faintness of the comparison star inu, its g band lightcurve was used to make the differential u lightcurve. This gave a satisfactory result in the sense that both the pulsations and the eclipses were recovered, but it in-troduced an unreliable slope in the first part of theulightcurve (see Fig. 1). Therefore, we did not rely on theulightcurve for the orbital analysis. However, we did use the second part of the u lightcurve to cross-check our results, as well as for the fre-quency analysis (see Sect. 4.2).
The times in the data frames were converted to JD and barycentrically corrected. Differential (V−C) lightcurves forr, ganduwere constructed from a set of more than 80 000 sci-ence frames. Ther,gandulightcurves are plotted in Fig. 1, where we can see a clear sign of the pulsations of the primary component inallthe phases of the binary orbit, even during the primary eclipse. A strong reflection-like effect (0.2 mag ing and 0.25 mag inr) is evident. This effect, characteristic of all binary systems containing an sdB star and a cool M-dwarf com-panion in rotationally locked orbit, is due to the high contrast in the temperatures between the heated and unheated hemispheres of the M-dwarf.
2.2. Spectroscopy
Even though PG 1336−018 was a target of several photomet-ric campaigns, its faintness relative to the rapid oscillations has prevented any reasonably good time-resolved spectroscopy. The short pulsation periods require very short integration times. There were two attempt so far with the aim of detecting the pul-sational radial velocities (Woolf et al. 2003) and identification of the pulsation modes from the wavelength dependency of the amplitudes (Dreizler et al. 2000), both with a null result.
A time-series of 399 high resolution spectra were taken over a period of∼9 h, covering about 3.7 full orbits, on the night of April 28, 2005 using the Ultraviolet Visual Echelle Spectrograph (UVES) on the VLT UT2 (Kueyen) at the Paranal Observatory, Chile. Only the blue arm was used, with wavelength coverage from 3900 to 5000 Å, and the slit width of 1 arcsec at a resolution of 46 890. Each spectrum was integrated for 45 s which, with the ultra fast read-out of about 23 s we used, gave a time resolution of 68 s. Dome flat-fields and bias calibration frames were taken at the beginning and at the end of the night, and ThAr exposures were taken before and after the run.
0.50 0.60 0.70 0.80 0.90 1.00 1.10
Normalised flux
0.50 0.60 0.70 0.80 0.90 1.00 1.10
3800 4000 4200 4400 4600 4800
Relative intensity
Wavelength
Hβ
Hγ
Hδ
Hε
H8
H9
H10
He I
[image:5.595.51.299.68.246.2]He I
Fig. 2.A typical single UVES/VLT spectrum of PG 1336−018 from our VLT run on 2005 April 28 (top) and the coadded spectrum ( bot-tom), produced by combining all the 399 available spectra after shifting according to the orbital radial velocity solution. The Balmer lines are indicated together with the helium lines used for the determination of physical parameters. Discontinuities due to imperfect merging of spec-tral orders only become evident in the high-S/N combined spectrum.
corrected, wavelength calibrated and, finally, the orders were merged. Since the spectra were oversampled we have rebinned them in an optimal way such that the S/N increased without compromising the resolution. Finally, the science frames were normalized.
A typical individual spectrum of PG 1336−018 is shown in the top panel of Fig. 2. The bottom panel of Fig. 2 shows the coadded orbit-corrected spectrum (see Sect. 4.1). Despite our extensive effort to achieve the optimal reduction scheme, the ex-traction and merging of the orders is not perfect. This is due to the fact that the Echelle order discontinuities do not behave “consistently” under a low signal. This leads to some jumps and wiggles seen in the continuum of the coadded spectrum and par-ticularly in the red wing of Hγ. For this reason we did not make use of this line in the merged spectrum for the spectroscopic pa-rameter determination discussed below.
In the blue wavelength range covered by our data no sign of any spectral feature from the cool companion can be seen, confirming the results of Woolf et al. (2003). Due to the large difference in effective temperatures (about a factor of 10, see Sect. 4) the hot sdBV star dominates the spectrum even in the primary eclipse.
3. RV determination
Our spectra allow us to produce a radial velocity (RV) curve, with an excellent phase coverage, from which we can indepen-dently determine the orbital period (P) and semi-amplitude (K1) of this eclipsing binary. As we are dealing with a low S/N, we de-termined RVs from the spectra trying out several different meth-ods. The best results were obtained by usingmolly- a software package, which fits two Gaussian profiles to the Balmer line pro-files2. This allows good treatment of both the broad wings and the sharper core at the same time. This gave better results than any of the other methods we have tried.
We have measured the RVs of the highest S/N lines in the spectrum, namely H, Hδ, Hγ and Hβ, using this package.
2
http://deneb.astro.warwick.ac.uk/phsaap/software/ molly/html/INDEX.html
0.4 0.5 0.6 0.7 0.8 0.9 1 1.1
4320 4325 4330 4335 4340 4345 4350 4355 4360
Flux
[image:5.595.321.563.76.246.2]Wavelength
Fig. 3.A sample fitting of two Gaussians to the observed Hγline (the
same spectrum as the one shown in Fig. 2) usingmolly.
-150 -125 -100 -75 -50 -25 0 25 50 75
-0.5 -0.25 0 0.25 0.5
Radial Velocity [km/s]
Phase
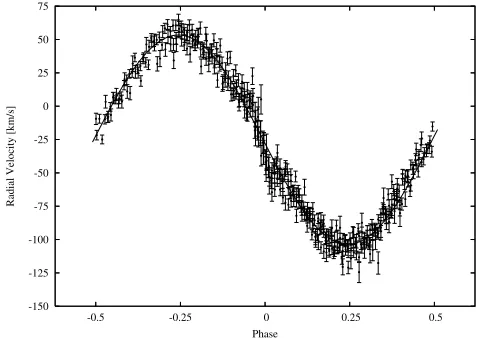
Fig. 4.The radial velocity measurements (average of the H, Hδ, Hγ
and Hβlines) of all the individual UVES/VLT spectra. The best fit orbit
solution fromPHOEBEis also shown.
A sample fit is shown in Fig. 3 for an individual spectrum. The FWHM of the two Gaussian fits, as well as their heights, were treated as a free parameter at first, but were kept fixed once the best fit values were found. We checked carefully if the RV from the Hγline deviated from the one of the other Balmer lines, due
to the discontinuity in its red wing. This turned out not to be the case (see also Fig. 3) so we kept the Hγ RV values in our
analysis.
Finally, the average of each RV measurement, using H, Hδ, Hγ and Hβ lines, was determined. These radial velocity values
for each of the 399 individual spectra (with the errors), are shown in Fig. 4 together with the best fit orbital solution (see Sect. 4).
[image:5.595.321.562.287.456.2]Table 1. Fixed parameters in the search for the orbital solution of PG 1336−018.
Parameter Value
t0 2 450 223.36134 da P 0.101015999 da
Teff1 31 300 K Teff2 3000 Kb
g1 1.0
g2 0.32
A1 1.0
x1(g) 0.217 x1(r) 0.178
aEphemeris taken from Kilkenny et al. (2000).bT
eff2was kept fixed as
it is poorly constrained by the data, see the text for details.
all of their observations (see their Table 3) to range from 47±4 to 79±4 km s−1. The semi-amplitude we obtained is somewhat larger than estimated by Woolf et al. (2003), 64±1 km s−1, but their data cover only 1.4 orbits and contain a gap which probably resulted in an underestimated value.
As our data set suffers from a baseline too short for reliable ephemeris determination, we adopted the ephemeris obtained by Kilkenny et al. (2000) (see Table 1).
Since the system is single-lined and the orbit is assumed to be circular, the analysis of the RV curve is straightforward. The mass function calculated from the semi-amplitude and the period gives:
f(M)=0.0051±0.0001M.
4. Orbital parameters
In order to investigate the pulsational properties of PG 1336−018, the subject of a follow-up paper, the orbital variations due to the binarity must be removed from the ob-served lightcurve. However, in order to find the best orbital solution for this eclipsing binary system, the pulsations of the sdB primary must be removed as well. This is a non-trivial coupled problem. The determination of the orbital parame-ters of this system required to understand and evaluate the temporal spectrum of the primary sdB pulsator. In order to achieve this, we followed an iterative procedure, using all the information about the target we have. Once we find a reliable orbital solution, we subtract it from the lightcurves. Then we use the orbit subtracted lightcurves to extract the pulsation frequencies present in our data. We prewhiten the original observed lightcurves with these frequencies. The prewhitened lightcurves are then used as input to find the second iteration orbital solution.
4.1. Fundamental parameters
Our high resolution VLT/UVES spectra allow us to improve the spectroscopic parameters determined by Kilkenny et al. (1998). Using our RV solution (see Fig. 4), we shifted the spectra and added them together to improve the S/N. The coadded orbit-subtracted spectrum is shown in the bottom panel of Fig. 2.
[image:6.595.92.223.107.212.2]For the model fitting procedure, we used the LTE models of Heber et al. (2000). The model spectra were convolved with a Gaussian instrumental profile of 0.25 Å and rotationally broadened (assuming tidally locked rotation) with a vsini of 74.2 km s−1. This produces a model spectrum with line cores that
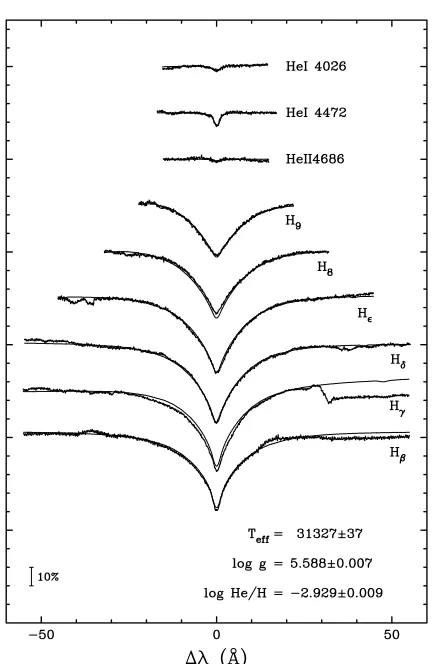
Fig. 5.Our spectroscopic model fit to the mean spectrum in Fig. 2. The best fit model spectrum has been plotted on top of the observed spec-trum as a smooth curve. Note that the Hγline was kept out of the fit due to its proximity to an echelle order discontinuity.
reproduce the observed spectrum excellently for all lines that are unaffected by Echelle order discontinuities. Unfortunately, while the fit to the cores is good, the wings are not well fitted. Our best simultaneous fit for effective temperature, gravity and helium abundance yields:
Teff = 31300±250 K logg = 5.60±0.05 dex logy = −2.93±0.05 dex.
atmosphere models, enhanced metallicity models, or changing the assumed rotational velocity broadening. All these attempts produced negligible changes to the derived parameters listed above.
4.2. Binarity and pulsation
Numerical orbit solutions were investigated using thePHOEBE
package tool (Prša & Zwitter 2005) which incorporates the as-pects of the Wilson-Devinney (WD) code (Wilson & Devinney 1971). The WD approach uses differential correction (DC) as the minimization method, which is in essence a linearised least squares method. The code was used in the mode for detached bi-naries with no constraints on the stellar potentials. No third light or spots were included.
The ULTRACAM/VLT g and r lightcurves and the RV measurements obtained from the UVES/VLT spectra were solved simultaneously to yield a consistent model fit. As
PHOEBEis limited by the number of points (currently the limit
is 9000 points) we had to phase bin our ULTRACAM/VLT lightcurves into 4000 data points per lightcurve.
The major problem in finding the orbital solution of any bi-nary system is not only the fact that there are many free param-eters (12+5n, wherenis the number of lightcurves in different filters), but also that the parameters are correlated. Some of these correlations are severe, especially between the mass ratioqand the potential of the secondary starΩ2 (see the discussion be-low in Sect. 4.3). Hence, one is left with several formal families of solutions within the parameter space. We must then confine the range of possible solutions by reducing the number of free parameters. The only safe way to do this is by considering the boundary conditions set by the data themselves and by sound theoretical considerations.
The parameters that were assumed and kept fixed in our anal-ysis weret0,P,Teffof the primary, gravity darkening coefficients both for the primaryg1and the secondaryg2, bolometric albedo of the primaryA1and the limb darkening coefficients of the pri-mary in the two filtersx1(g,r). For the gravity darkening co-efficients we adopted values of 1.0 for the primary (radiative en-velope) and 0.32 for the secondary (convective enen-velope). We assumed a circular orbit (e=0) and synchronized rotation with the orbit.
The effective temperature of the primary Teff1 was set to the value derived from our spectra (see Sect. 4.1). The eff ec-tive temperature previously estimated by Kilkenny et al. (1998, Teff = 33 000±1000) was used as well, but, as it did not in-fluence the derived parameters except for the luminosity of the stars, we fixed the temperature to the value derived by our new data. TheTeff2 of the secondary has a very low contribution to the total flux (see Sect. 2) and, therefore, is not tightly con-strained. An appropriate treatment of the effective temperature of the secondary in the case where the hot sdB primary is heat-ing the cool secondary is not trivial, as the temperature on the illuminated hemisphere can be as much as five times higher than on the non-illuminated one (Zola 2000). Whilst we did not in-tend to fix the effective temperature of the secondary star at first, we have found that leaving it as an adjustable parameter does not give consistent results. WithTeff2as a free parameter, it con-verges to around 4000 K for theglightcurve, but to only 2700 K for ther-band lightcurve. As a reasonable compromise forTeff2, we choose to fix it to 3000 K. Considering the fact that the con-tribution of the secondary to the total flux is negligible, this is not an obstacle.
As there are no published limb darkening coefficients for sdB stars we calculated the limb darkening coefficientsx1(g,r
and u) for a “typical” sdB star from a fully line-blanketed LTE model atmosphere (Behara & Jeffery 2006) with Teff = 30 000 K, logg = 5.5, Vturb = 5 km s−1 and solar abundances (a linear cosine law was used). The mean limb darkening coeffi -cients in each filter were computed by convolving theULTRACAM
efficiencies in each filter with the monochromatic limb dark-ening coefficients and the stellar fluxes. We also computed the orbital solution using an extrapolation of previously reported coefficients from the tables of Wade & Rucinski (1985) and Al-Naimiy (1978), as well as the values fixed at 0.25 (V) and 0.20 (R) (Kilkenny et al. 1998). This did not change the solu-tion, so we adopted the coefficients we computed from a modern atmosphere model. Table 1 summarises the values of the fixed parameters. The surface gravity is not a free parameter obtained
byPHOEBE, since it is defined by the mass and radius.
Using the ephemeris given in Kilkenny et al. (2000) we find a phase shift of 0.00374±0.00006 d. This phase shift could in prin-ciple be due to timing errors in our data rather than to an intrinsic change in the system. However, we carefully checked timings in our data sets and, moreover, we have data from two different in-struments which both show the same phase shift. A timing error is therefore very unlikely to be the cause of the measured shift. A change inherent to the system is thus the most probable rea-son. With only two minima timings we cannot draw any further conclusion here, only emphasise the need for further epoch ob-servations. A similar period change on the order of 0.003 d over a period of 6 years in the HW Vir system was documented by Kilkenny et al. (2000).
The strong pulsations in the lightcurves are obstructing the fine tuning of the orbit, as the pulsations are seen as scatter by
PHOEBE. Therefore, we take the first iteration solution and
sub-tract it from the lightcurves. Now, after the dominant parts of the periodicity, i.e. the eclipses, have been removed from the lightcurves we can analyse them in order to take out the pul-sations of the primary from the lightcurves.
A Fourier amplitude spectrum was calculated for each or-bit subtracted lightcurve to deduce the periodicities present in the data. The short timespan of our photometric data confines us with a frequency resolution of 54µHz. Since we are unable to resolve many of the closely spaced frequencies in the spec-trum published by Kilkenny et al. (2003), we cannot use their peaks. We can only remove the periodicities we observe in our data in order to improve our orbit solution, after verifying that the frequencies we detect are indeed in the range of known PG 1336−018 frequencies.
Table 2.The list of frequencies, periods, amplitudes and phases we detected and prewhitened our data with. The phase is given as the time of maximum amplitude sincet0.
Frequency Period Amplitude Phase (Tmax)
[µHz] [s] [mma] [s]
g r u g r u
5430.1 184.16 11.2(1) 10.5(1) 17.1(2) 142.3(3) 142.2(3) 141.4(4) 5579.9 179.21 3.8(1) 3.7(1) 3.5(2) 105.9(8) 105.8(8) 115(2) 5757.3 173.69 1.7(1) 1.7(1) 2.8(2) 148(2) 147(2) 155(2) 7076.7 141.31 2.0(1) 1.9(1) 3.0(2) 105(1) 106(1) 107(2)
Table 3.System parameters of the three best model fits to RV data and lightcurves of PG 1336−018. The formal 1σerror on the last digit of each parameter is given in parentheses.
Free parameter Model I Model II Model III
a[R] 0.723(5) 0.764(5) 0.795(5)
q 0.282(2) 0.262(2) 0.250(2)
i[◦] 80.67(8) 80.67(8) 80.67(8)
Ω1 5.50(3) 5.48(3) 5.47(3) Ω2 2.77(1) 2.68(1) 2.62(1) A2 0.92(3) 0.92(3) 0.93(3) x2(g) 0.38(8) 0.39(8) 0.38(8) x2(r) 0.88(8) 0.89(8) 0.89(8)
Derived parameters:
M1[M] 0.389(5) 0.466(6) 0.530(7) M2[M] 0.110(1) 0.122(1) 0.133(2) R1[R] 0.14(1) 0.15(1) 0.15(1) R2[R] 0.15(1) 0.16(1) 0.16(1)
logg1[cm/s2] 5.74(5) 5.77(6) 5.79(7)
logg2[cm/s2] 5.14(5) 5.14(5) 5.14(5)
Roche radii: [in units of orbital separation]
r1(pole) 0.191 0.191 0.191 r1(point) 0.193 0.193 0.193 r1(side) 0.192 0.192 0.192 r1(back) 0.193 0.193 0.193 r2(pole) 0.198 0.197 0.197 r2(point) 0.213 0.215 0.216 r2(side) 0.201 0.201 0.201 r2(back) 0.210 0.211 0.211
Errors on residuals:
σ(g) [mag] 0.03055 0.03054 0.03057
σ(r) [mag] 0.01325 0.01321 0.01321
σ(RV) [km s−1] 8.39 8.39 8.39
frequencies f3,f4,f25,f10,f5,f7 and f22 from Table 4 of Kilkenny et al. (2003).
These prewhitened lightcurves were then phase binned and, together with the RV curve, fed intoPHOEBEto search for the improved orbit solution. Even though residual pulsations are still clearly visible in the lightcurves, their amplitudes are now signif-icantly smaller, which allows us to obtain a more reliable (sec-ond iteration) orbit solution. A third iteration step turns out to be unnecessary, as it does not improve the final outcome of the orbital parameters.
As a quantitative measure of the goodness-of-fit we use the 1σdeviation for each data set (g,rand RV) from the simul-taneously calculated synthetic curves. The bigger 1σdeviation ing is due to the higher amplitudes of the oscillations in this colour. While it is impossible to see the depth of the local min-ima found by the DC method, and therefore search for the global minimum of the parameter hyperspace, we tested the stability of the convergent solutions found by parameter kicking (Prša & Zwitter 2005). Once convergence was reached, we manually kicked the parameters and the minimization was restarted from
the displaced points. In this way we found three groups of so-lutions of equal goodness-of-fit. Table 3 gives the three best fit orbital solutions. It is not possible to decide which solution is the correct one based on the numerical considerations as the syn-thetic curves are fitting the data equally well for all three models. The errors given in the table are the formal errors of the fit which are likely smaller than the true errors due to the above mentioned correlation between the parameters. The synthetic lightcurve fits to the observed data points are presented in Figs. 4, 6 and 7 (solid line) together with their residuals. The syntheticg and r lightcurves and the RV curve are plotted for only one solu-tion (Model II) since the deviasolu-tions between the three solusolu-tions cannot be resolved at the scale of the figure.
4.3. Discussion
The uniqueness of a given solution is jeopardized by the param-eter correlations. In particular, there is a strong correlation be-tween the mass ratioqand the potential of the secondary starΩ2. Therefore, there is aqdegeneracy in all the orbital solutions. For a given range of potentials defined by the Lagrangian point, a family of solutions with corresponding mass ratios is found. The solutions found in Table 3 represent the local minima shown in Fig. 8.
The relative radii and the orbital inclination are tightly con-strained by the depth and the width of the eclipses, and the results in all three models are nearly identical. There is only a slight distortion of the secondary:r2(pole)/r2(point) is 0.93, 0.92, 0.91 respectively for each model. While the previous searches for the best orbital solutions (Kilkenny et al. 1998; Drechsel et al. 2001, and references therein) tend to resort to non-physical albedos (greater that 1 in some cases) and limb darkening coefficients of the secondary, we find that the biggest problem is in the temperature of the secondary which is heated by the hot subdwarf. The weakest point of all modelling proce-dures lies in an inadequate treatment of the temperature of the secondary star. The temperature distribution over the surface of the secondary has to be incorporated in the atmosphere models used byPHOEBEin order to get more realistic solutions. This is far beyond the scope of our current paper.
[image:8.595.55.256.240.539.2]4.0 5.0 6.0 7.0 8.0 9.0 10.0 11.0 12.0
Flux ratio
-0.4 -0.2 0.0 0.2 0.4
Residuals
-0.4 -0.2 0.0 0.2 0.4
0.46 0.48 0.50 0.52 0.54 0.56 0.58 0.60 0.62 0.64 0.66 0.68 0.70
Residuals
[image:9.595.65.548.68.365.2]HJD - 2453509.0
Fig. 6.The ULTRACAM/VLTglightcurve together with the synthetic orbit solution.The middle panelshows the residuals of the orbit subtraction. Pulsations during the eclipses are now clearly visible, and we can see that the amplitude is smaller during the primary eclipse than during the secondary as only the part of the surface is visible.The bottom panelshows the residuals after prewhitening with the four strongest oscillation modes.
clearly much lower than what can realistically be accepted since it gives a mass for the primary that is far too low (M1<0.2M). While we cannot discriminate between the three model fits on the basis of theirσ values, the evolutionary scenarios for sdB stars disqualify the Model III solution as the primary mass would be too high for a core He-flash (Han et al. 2002). Models I and II however, are both possible as they could have formed through common envelope phase (Hu et al., submitted to A&A).
5. Detection of the Rossiter-McLaughlin effect
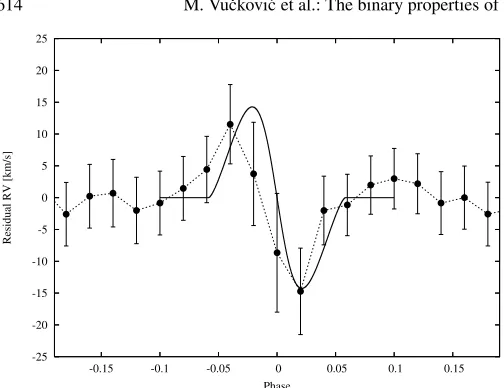
In Fig. 4, an apparent up-and-down (redshift-blueshift) shift oc-curs at phase zero in the RV curve. This effect at the eclipse is known as the Rossiter-McLaughlin (RM) effect (Rossiter 1924; McLaughlin 1924). It is due to the selective blocking of the light of the rotating star during an eclipse. When the secondary star covers the blueshifted (redshifted) half of the stellar disk, the integrated light of the primary appears slightly redshifted (blueshifted). Because of this selective blocking of the stellar surface during the eclipse, a skewed line profile is created. This change in line profile shape results in a shift in RV, which in turn results in the redshift-blueshift distortion seen during the eclipse (see Fig. 4). The RM effect has been seen in other eclipsing hot subdwarf binaries (e.g. AA Dor: Rauch & Werner 2003) and can be used to investigate the rotational properties of the compo-nent stars. It was recently used in extrasolar planetary transits (Queloz et al. 2000; Ohta et al. 2005; Giménez 2006; Gaudi & Winn 2007) to discriminate between different migration theo-ries. The amplitude of the effect mainly depends on the projected rotation velocity of the star, the ratio of stellar radii, the orbital inclination, and the limb darkening.
To analyze this effect we have subtracted the orbital solution (solid curve in Fig. 4) from the RV measurements. The orbit-subtracted RV residuals, phase binned in 50 bins, are plotted in Fig. 10. The RM effect is clearly seen in these residuals. We used the analytical description of this effect given in Giménez (2006) to simulate the RM effect for this system. We have as-sumed that the rotational axis of the primary star is co-aligned with the perpendicular to the orbital plane. The result of this simulation is plotted as a solid line in Fig. 10. The equatorial ro-tational velocity of the star was set to 75.2 km s−1 and the ratio of the stellar radiir2/r1, the inclination of the orbitiand the ra-dius of the primary relative to the size of the orbitr1were taken from our orbital solution (see Table 3). The synthetic curve fits the observed RM amplitude rather well. The uncertainties on the residual RV curve are too large to fine-tune the orbital parame-ters. We can only establish that the observed RM effect is com-patible with the orbital solutions given in Table 3 and represents an independent confirmation of the light curve solution.
1.0 1.5 2.0 2.5 3.0 3.5 4.0
Flux ratio
-0.1 0.0 0.1
Residuals
-0.1 0.0 0.1
0.46 0.48 0.50 0.52 0.54 0.56 0.58 0.60 0.62 0.64 0.66 0.68 0.70
Residuals
[image:10.595.45.536.70.365.2]HJD - 2453509.0
Fig. 7.Same as Fig. 6 but for therband. The trends seen in the middle and bottom panel result from imperfect removal of the reflection effect due to the changing temperature across the surface of the secondary (see text for details).
0.0011 0.00115 0.0012 0.00125 0.0013 0.00135 0.0014
0.22 0.24 0.26 0.28 0.3 0.32
Sigma
q
Fig. 8.Mass ratioqversus sigma, for the range of the possibleqvalues. Sigma is the sum of the squares of the sigmas in the two considered filters (σ(g) andσ(r)).
the pulsations. We will investigate this further in our follow-up paper dedicated to the analysis of the primary’s pulsations.
6. Conclusions and future work
[image:10.595.297.548.410.606.2]In this work, we presented a thorough observational analy-sis of the orbital behavior of the pulsating eclipsing binary PG 1336−018. Our goal was to avoid using a canonical mass of 0.5Mfor the subdwarf in any interpretation of the luminos-ity variations of the star, as has been done so far in the liter-ature.Instead, we attempted an unbiased derivation of the sys-tem and stellar parameters, in particular for the masses of the
Fig. 9.Mass-radius diagram for PG 1336−018 showing the regions per-mitted by the orbit solution (continuous line) and by the different sur-face gravities (dotted lines). Theqvalues are also noted on the orbit solution. The small changes from the 3σerror onK1 do not shift the
curve representing the orbital solution.
[image:10.595.32.290.412.588.2]-25 -20 -15 -10 -5 0 5 10 15 20 25
-0.15 -0.1 -0.05 0 0.05 0.1 0.15
Residual RV [km/s]
[image:11.595.49.301.59.253.2]Phase
Fig. 10.The orbit subtracted RV residuals (dots) with their correspond-ing errors clearly showcorrespond-ing the RM effect. The solid line is the simulation of the RM effect with the parameters given in the text.
respectively. We thus conclude that our solutions with M1 = 0.466±0.006M and M1 = 0.389±0.005M are the only plausible ones, except when the common-envelope phase would be better described by theγ-formalism (Nelemans et al. 2000; Nelemans & Tout 2005). In this case all three solutions are ac-ceptable, as this formalism allows non-degenerate helium igni-tion with a broader primary mass range (0.3−0.8M).
Furthermore, we have detected the RM effect in the radial velocity curve of PG 1336−018. The simulated amplitude of the RM effect is in the accordance with the RM amplitude seen in the RV residuals, which is an independent confirmation of the results obtained from our orbital solution.
While deriving the orbital solution for PG 1336−018, we hit upon the limitation of current binary analysis codes, which also prevented us to pinpoint the effective temperature of the sec-ondary. None of the analysis methods available in the literature treat the atmosphere of such a close binary, in which one com-ponent is so hot that it induces a temperature gradient across the surface of the other, in an appropriate way. Indeed, all codes make use of stellar atmosphere models which assume one fixed effective temperature at the surface of each of the component stars. As such, any derived quantities, such as limb darkening coefficients and albedos, cannot be but a very crude approxima-tion of reality whenever one component is seriously heated by the other one. In the case of close binaries like PG 1336−018, i.e. with a hot primary and a cold secondary, the temperature of the latter changes so drastically from the illuminated side to the backside, that specific atmosphere models representing such a situation should be computed and used while deriving the or-bital parameters. This is an entire project by itself and surely beyond the scope of our current work. We hope that our results will give rise to future developments of atmosphere models with temperatures varying across the surface of the cool component in close binaries. The case of PG 1336−018, and our data of the star, are ideally suited to test such new future models.
In a follow-up paper of this work, we plan to analyse the oscillatory signal in our multicolour photometry and high-resolution spectroscopy, after the orbit subtraction presented here. This will be done by computing a cross-correlation func-tion of each spectrum and investigating the signature of the modes in it. Cross-correlation functions have already been used to study the character of oscillations modes before, see e.g.
Mathias & Aerts (1996) for theδScuti star 20 CVn and Hekker et al. (2006) for solar-like oscillations in red giants. This is done by computing line diagnostics, such as moments, and the ampli-tude and phase across the profile, and comparing these to predic-tions based on the theory of non-radial oscillapredic-tions. In principle, this allows us to identify the spherical wavenumbers (,m) of the strongest modes. The use of these established mode identifica-tion techniques (see e.g. Briquet & Aerts 2003; Zima 2006, for the latest versions) on high-resolution cross-correlation profiles of pulsating sdB stars has so far not yet been done. The nature of our data and of our target star requires a simulation study to test the effects of smearing out the oscillations over the cycle and of the limited time base. Also, we must treat the data during and outside the eclipses separately in order to assess the eff ective-ness of the techniques in the specific case of PG 1336−018. Such a study is currently being performed. The ultimate goal of it is to identify the highest-amplitude modes and discriminate among the plausible seismic models of the star. This will then eventu-ally lead us to derive a seismic mass estimate to be confronted with the observed primary masses presented here and with the evolutionary masses computed by Hu et al. (submitted to A&A).
Acknowledgements. M.V. thanks Maarten Reyniers for his generous help in the UVES data reduction procedure. M.V. acknowledges a Ph.D. scholar-ship from the Research Council of Leuven University. H.H. acknowledges a Ph.D. scholarship through the “Convenant Katholieke Universiteit Leuven, Belgium – Radboud Universiteit Nijmegen, the Netherlands”. M.V., C.A., R.Ø., and H.H. are supported by the Research Council of Leuven University, through grant GOA/2003/04. ULTRACAM is supported by PPARC grants PPA/G/S/2003/00058 and PP/D002370/1. We are thankfull to Joshua Winn and Scott Gaudi for enlightening discussions on the RM effect and to Alvaro Giménez for kindly providing us with his subroutines. We thank Prof. Uli Heber for kindly providing the LTE spectral grids.
References
Aerts, C., & Eyer, L. 2000, in Delta Scuti and Related Stars, ed. M. Breger, & M. Montgomery, ASP Conf. Ser., 210, 113
Al-Naimiy, H. M. 1978, Ap&SS, 53, 181
Behara, N. T., & Jeffery, C. S. 2006, A&A, 451, 643
Brassard, P., Fontaine, G., Billères, M., et al. 2001, ApJ, 563, 1013 Briquet, M., & Aerts, C. 2003, A&A, 398, 687
Charpinet, S., Fontaine, G., Brassard, P., & Dorman, B. 1996, ApJ, 471, L103 Charpinet, S., Fontaine, G., Brassard, P., & Dorman, B. 2000, ApJS, 131, 223 Charpinet, S., Fontaine, G., Brassard, P., Green, E. M., & Chayer, P. 2005, A&A,
437, 575
Dhillon, V., & Marsh, T. 2001, New Astronomy Review, 45, 91 Dorman, B., Rood, R. T., & O’Connell, R. W. 1993, ApJ, 419, 596 Drechsel, H., Heber, U., Napiwotzki, R., et al. 2001, A&A, 379, 893 Dreizler, S., Koester, D., & Heber, U. 2000, Baltic Astronomy, 9, 113 Dupret, M.-A., De Ridder, J., De Cat, P., et al. 2003, A&A, 398, 677 Fukugita, M., Ichikawa, T., Gunn, J. E., et al. 1996, AJ, 111, 1748 Fusi-Pecci, F., & Renzini, A. 1976, A&A, 46, 447
Gaudi, B. S., & Winn, J. N. 2007, ApJ, 655, 550 Giménez, A. 2006, ApJ, 650, 408
Green, E. M., Fontaine, G., Reed, M. D., et al. 2003, ApJ, 583, L31 Green, R. F., Schmidt, M., & Liebert, J. 1986, ApJS, 61, 305
Han, Z., Podsiadlowski, P., Maxted, P. F. L., Marsh, T. R., & Ivanova, N. 2002, MNRAS, 336, 449
Han, Z., Podsiadlowski, P., Maxted, P. F. L., & Marsh, T. R. 2003, MNRAS, 341, 669
Heber, U., Reid, I. N., & Werner, K. 2000, A&A, 363, 198
Hekker, S., Aerts, C., de Ridder, J., & Carrier, F. 2006, A&A, 458, 931 Jeffery, C. S., Aerts, C., Dhillon, V. S., Marsh, T. R., & Gänsicke, B. T. 2005,
MNRAS, 362, 66
Kilkenny, D., Koen, C., O’Donoghue, D., & Stobie, R. S. 1997, MNRAS, 285, 640
Kilkenny, D., O’Donoghue, D., Koen, C., Lynas-Gray, A. E., & van Wyk, F. 1998, MNRAS, 296, 329
Maxted, P. f. L., Heber, U., Marsh, T. R., & North, R. C. 2001, MNRAS, 326, 1391
McLaughlin, D. B. 1924, ApJ, 60, 22
Menzies, J. W., & Marang, F. 1986, in Instrumentation and Research Programmes for Small Telescopes, ed. J. B. Hearnshaw, & P. L. Cottrell, IAU Symp., 118, 305
Morales-Rueda, L., Maxted, P. F. L., Marsh, T. R., North, R. C., & Heber, U. 2003, MNRAS, 338, 752
Morales-Rueda, L., Maxted, P. F. L., Marsh, T. R., Kilkenny, D., & O’Donoghue, D. 2006, Baltic Astron., 15, 187
Mukai, K. 1990, PASP, 102, 183
Napiwotzki, R., Karl, C. A., Lisker, T., et al. 2004, Ap&SS, 291, 321 Nelemans, G., & Tout, C. A. 2005, MNRAS, 356, 753
Nelemans, G., Verbunt, F., Yungelson, L. R., & Portegies Zwart, S. F. 2000, A&A, 360, 1011
Ohta, Y., Taruya, A., & Suto, Y. 2005, ApJ, 622, 1118
Østensen, R., Oreiro, R., Drechsel, H., Heber, U., & Pigulski, A. 2007, in ASP Conf. Ser., 15th European Workshop on White Dwarfs, ed. R. Napiwotzki, in press
Prša, A., & Zwitter, T. 2005, ApJ, 628, 426
Queloz, D., Eggenberger, A., Mayor, M., et al. 2000, A&A, 359, L13 Randall, S. K., Fontaine, G., Brassard, P., & Bergeron, P. 2005, ApJS, 161, 456 Rauch, T., & Werner, K. 2003, A&A, 400, 271
Rossiter, R. A. 1924, ApJ, 60, 15
Wade, R. A., & Rucinski, S. M. 1985, A&AS, 60, 471 Wilson, R. E., & Devinney, E. J. 1971, ApJ, 166, 605
Wood, J. H., Zhang, E.-H., & Robinson, E. L. 1993, MNRAS, 261, 103 Woolf, V. M., Jeffery, C. S., & Pollacco, D. 2003, in NATO ASIB Proc. 105,
White Dwarfs, ed. D. E. A. de Martino, 95 Zima, W. 2006, A&A, 455, 227