Using machine-learning models for
operational exception handling
A case study at IBM
Pim Schultz
October 2017
Supervised by:
IBM Amsterdam
J.P. Hazewinkel
University of Twente
Dr. M.C. Van der Heijden
Dr. A.B.J.M. Wijnhoven
Industrial Engineering and Management
Faculty of Behavioral Management and Social Sciences
"Essentially, all models are wrong,
but some are useful."
i
Executive summary
This master thesis project has been conducted at IBM Amsterdam. The goal of this thesis research was to analyze the possibilities of automating the exception handling process of operational service parts planning. In particular, we have analyzed the possibilities of using machine-learning and cognitive computing to predict a planner’s actions in the exception handling process.
Motivation
Operational service parts planning at IBM is done via a mix of automated systems and human interventions. Currently a large number of orders are made automatically via Servigistics, a software solution used by the operational service parts departments. While Servigistics automates the standard service part orders, it does not automatically resolve exceptional service part situations. When confronted with an exceptional situation, the system alerts a human planner whom is expected to solve the issue. IBM argues that some of these exceptions could be automated by a cognitive computing system. If parts of the exception handling process can be automated, the planners will able to focus their efforts on the remaining cases. The goal of this research is thus defined as: “Can the efficiency of the operational exception handling process be increased with cognitive computing systems?”
Results and conclusions
Since the majority of the data used in the exception handling process is stored in structured databases and the desire of IBM for a system to automate parts of the exception handling process instead of advising employees, we have therefore created a traditional machine-learning model instead of a cognitive computing model.
A proof-of-concept model has been created to predict the planner’s actions when presented with a specific exception type, concerned with projected inventory shortage, by the Servigistics system. Inputs given to the model consisted of basic service part information available to the operational planner. Outputs of the system were limited to the potential order types and collected via the Servigistics log files. Linking this input and output data over the months of May to September, 579 cases were used as input for the model. On average, the model correctly predicted the order type in 57% of the cases. Given the model’s low accuracy, we would advise IBM to either conduct further research how to improve these models, or to use these models as a second opinion for the planner.
ii normal in 46% of the cases during the evaluation period. If the inventory position did not return to its normal position during the evaluation, it does not need to be a direct result of a planner’s decision as the dynamic nature of the service parts management environment makes it hard to predict the impact of decisions. Instead of dismissing these cases as incorrect, we advise the service parts operations department of IBM to inspect a selection of these cases for possible improvements of their exception handling process.
Recommendations for further research
While this research has shown that machine-learning models might be able to increase the efficiency of the exception handling process, further research will need to be undertaken to provide a conclusive answer. Based on the conclusions and limitation of this master research we therefore propose the following areas of interest for future research:
• Improvements to the machine-learning model. To improve the model from this research we would suggest adding more diverse cases to the model, increasing the number of inputs, or automating the input collection process. Increasing the diversity of cases and the number of inputs allows the model to easier distinguish between cases, thus improving its accuracy. Automating the input collection process of the model would enable it to store the contextual information at the moment of the planner’s decision thus increasing the accuracy of the inputs.
• Extensions of the machine-learning model. The model proposed and tested in this research is specialized in the handling of a single exception type raised by Servigistics. Some of the other 39 exceptions raised by Servigsitics could be automated with a similar method. In selecting the exception for this research, we have mentioned that there are five other exceptions with similar input and output values. Future research could analyze the possibilities for machine-learning models on these exceptions.
iii
Table of Contents
1 Introduction ...1
1.1 IBM ... 1
1.2 ProSeLo Next ... 1
1.3 Cognitive computing ... 2
1.4 Service parts management ... 2
1.5 Collaboration ... 4
2 Research design ...5
2.1 Motivation ... 5
2.2 Research questions ... 6
2.3 Scope ... 7
2.4 Methodology ... 7
2.5 Deliverables ... 9
2.6 Thesis outline ... 9
3 Theoretical framework ... 10
3.1 Operational service parts management ... 10
3.2 Human decision maker ... 11
3.3 Decision support systems ... 12
3.4 Machine-learning ... 13
3.4.1 Cognitive computing ... 14
3.5 Control tower environment ... 16
3.6 Chapter summary ... 18
4 Status of IBM processes and systems ... 19
4.1 Service parts operations ... 19
4.1.1 Supply chain ... 20
4.1.2 Service parts management control tower ... 21
4.1.3 Customer machine failure situation ... 22
4.2 Systems... 23
4.2.1 Servigistics Plan ... 23
4.2.2 CPPS ... 24
4.3 Operational exception handling ... 25
4.3.1 Planning ... 25
iv
4.3.3 Review reasons ... 26
4.4 Chapter summary ... 30
5 Model ... 31
5.1 Decision support classification ... 31
5.2 Model characteristics ... 31
5.2.1 Scope ... 32
5.2.2 Input ... 33
5.2.3 Output ... 34
5.2.4 Machine-learning algorithm ... 35
5.2.5 Results ... 36
5.3 Position in IBM’s control tower ... 40
5.4 Chapter summary ... 41
6 Performance measurement ... 42
6.1 Ideal situation ... 42
6.2 Evaluation timing ... 43
6.3 Scoring ... 43
6.4 Performance measurement results ... 48
6.5 Case inclusion ... 49
6.6 Chapter summary ... 52
7 Conclusions and recommendations ... 53
7.1 Conclusions ... 53
7.2 Recommendations for further research ... 54
8 References ... 56
Appendix A Planner worksheet windows ... 59
Appendix B List of review reasons ... 61
Appendix C Review reasons causes and actions ... 64
Appendix D Review reason sets ... 79
Appendix E Model input ... 82
Appendix F SPSS model types ... 84
Appendix F.1 C5.0 ... 84
Appendix F.2 QUEST ... 85
Appendix F.3 Bayesian networks ... 86
v
Appendix F.5 CHAID ... 87
Appendix F.6 C&R ... 88
Appendix F.7 Random trees ... 89
Appendix G SPSS Model ... 91
Appendix G.1 Model overview ... 91
Appendix G.2 C5.0 K-folding validation model ... 91
Appendix H C5.0 first model rule set ... 92
Appendix I Predictor importance ... 98
Appendix J Frequency table of model confidence values ... 100
Appendix K Model performance per category ... 101
Appendix K.1 Division owner ... 101
Appendix K.2 New buy order lead-time ... 101
Appendix K.3 Warranty order lead-time ... 101
Appendix K.4 Repair order lead-time ... 102
Appendix K.5 Part vitality ... 102
Appendix K.6 Order type ... 102
Appendix K.7 WAC ... 102
Appendix L Performance measurements... 103
Appendix L.1 Scoring of all 161 cases ... 103
vi
List of figures
Figure 1: Decisions in maintenance logistics control ... 4
Figure 2: Cognitive system hypothesis generation ... 15
Figure 3: Control tower environment... 16
Figure 4: SPO EMEA Supply chain ... 21
Figure 5: IBM's control tower 2.0 ... 22
Figure 6: Customer machine failure flowchart ... 23
Figure 7: Review reason filtering process ... 32
Figure 8: R38 evaluation period ... 33
Figure 9: C5.0 average confidence values ... 39
Figure 10: Model placement in IBM's control tower ... 40
Figure 11: Inventory ideal situation ... 43
Figure 12: Inventory stock positions ... 44
Figure 13: Penalty score example ... 47
vii
List of tables
Table 1: Methodology broken down per research question ... 8
Table 2: Thesis outline ... 9
Table 3: Decision support system framework ... 13
Table 4: Global hands-on orders breakdown ... 20
Table 5: EMEA hands-on orders breakdown ... 20
Table 6: Review reason action categories ... 28
Table 7: Frequency of review reasons per service part ... 28
Table 8: Review reason rules ... 29
Table 9: Model performances ... 37
Table 10: Example scoring ... 48
viii
Abbreviations list
3PL - Third Party Logistics
AI – Artificial Intelligence
CB – Central Buffer
CE – Customer Engineer
CPPS - Common Parts Processes and Systems
DSS – Decision Support System
EMEA – Europe, Middle-East and Africa
EXC – Excess stock level
GARS - Global Asset Recovery Services
IBM - International Business Machines Corporation
MOP – Must Order Point
MOR – Maximum Order up to point
PIMS - Parts Inventory Management System
PSS – Policy Safety Stock
SPO – Service Parts Operations
1
1
Introduction
This master thesis has been commissioned by IBM to research the possibilities of automating the exception handling processes in their operational service parts management. The research subject has been proposed as part of the research agreement within the ProSelo Next group and has been delegated to two students from different departments at the University of Twente, namely the department of Industrial Engineering & Business Information Systems and the department of Human Media Interaction. This chapter will be used to provide some background information on IBM, explain the ProSelo Next research agreement, give a small introduction to the field of service parts management and explain the collaboration between students in more detail.
1.1
IBM
Originally started as the Computing-Tabulating-Recording Company in 1911, the International Business Machines Corporation (IBM) has grown to become one of the biggest players in the tech industry as well as one of the most recognizable brands in the world (Brand Finance, 2017). Whereas IBM used to be big player in the consumer computer market in the 20th century, nowadays the focus is on the business to
business market segment. Over the last decades IBM has shifted its focus from hardware sales to selling services, solutions and software products. IBM desires to be an organization that provides cutting edge, innovative, technology, and has therefore heavily invested in cloud and cognitive solutions. IBM expands its portfolio in these markets via inhouse developments such as the creation of their cognitive computing framework Watson, or by acquisition such as the takeover of the big data specialist The Weather Company in 2015 (IBM, 2016a).
1.2
ProSeLo Next
The research project Proactive Service Logistics for Advanced Capital Goods - the Next Steps (ProSeLo Next) is a follow up research initiative of the initial ProSelo project, which ran from 2010 to 2015. ProSeLo Next is a research agreement between three universities and nine companies: University of Twente, University of Tilburg, Erasmus University Rotterdam, ASML, Fokker Services, IBM, Marel Stork, Océ, Thales Nederland, Vanderlande, Gordian Logistic Experts, and the Stichting Service Logistics Forum (Basten, 2015). The research agreement will last until 2020 and consists of the following work packages:
2 to use the results to improve the models.
2. Service business models: When an OEM or service provider assumes responsibility for maintenance and service logistics (i.e., the availability) of assets, both involved parties have their own interests that need to be aligned.
3. Service control towers: Coordinated management requires service control towers to be constructed. We focus on operational decision making in dynamically changing situations, as requested by companies in response to the need to quickly adapt to rapidly changing market requirements (NWO, 2016).
The research subject of this thesis is related to the third work package as we are researching the operational decision-making processes within the service parts control tower environment at IBM.
1.3
Cognitive computing
Cognitive computing is seen by many as the next step in the evolution of machine-learning, in particular as an extension of the artificial intelligence field (Chen, Argentinis, & Weber, 2016; Y. Wang, Zhang, & Kinsner, 2010). While there is no consensus on the definition of cognitive computing yet, in this thesis we will use the definition given by IBM: “Cognitive computing refers to systems that learn at scale, reason with purpose and interact with humans naturally. Rather than being explicitly programmed, they learn and reason from their interactions with us and from their experiences with their environment.” (IBM, 2016a; Kelly, 2015). When these smart machines are introduced to a business their usage can be roughly classified in three categories: (i) they can be used to enhance existing human capabilities by, for example, assisting employees via historic decision feedback; (ii) they can take over tasks from the human workforce such as the usage of chatbots in the customer service industry; or (iii) they can be used in conjunction with the human work force to, for example, lift and relocate heavy objects (Dalton, Mallow, & Kruglewicz, 2015; Kelly, 2015). More information regarding machine-learning and cognitive systems can be found in 3.4.
1.4
Service parts management
Service parts management is defined as the activities required to ensure the right availability of service parts against minimal integral costs (Driessen, Arts, van Houtum, Rustenburg, & Huisman, 2015; Rustenburg, 2016; Slack, Brandon-Jones, & Johnston, 2013). Managing an organizations service parts portfolio requires operating in an environment with an ever-increasing complexity as:
3
• there are reductions in field knowledge and expertise,
• customers are demanding customized performance levels,
• products are becoming obsolete sooner due to fast product development cycles,
• reductions in the size of installed bases lead to more complicated demand patterns,
• organizational assets become increasingly complex due to technical advances limiting comprehensible failure recognition (Rustenburg, 2016).
When organizations are unsuccessful in their balancing act between costs and performance it may result in: lost revenues (e.g. manufacturing lines not being able to produce due to part failure), customer dissatisfaction (e.g. delays in transportation of goods such as parcels), or public safety hazards (e.g. failure of critical fail-safe parts) (Driessen et al., 2015).
4 Figure 1: Decisions in maintenance logistics control
Given the focus of this thesis on the operational service parts management processes at IBM and the focus of the ProSelo Next project, we can state that this research will be concerned with last two parts of the framework: service parts order handling and deployment. A more detailed description of the operational service parts management environment is found in 3.1.
1.5
Collaboration
5
2
Research design
Within this part of the thesis we will describe IBM’s motivation for the commissioning of this thesis, the research questions created to answer the overarching research subject, the scope for this thesis, the methodology used, the deliverables from this research, and provide an outline for the remainder of this thesis.
2.1
Motivation
For the past decade, IBM has been investing heavily in cognitive computing services such as natural language processing. IBM seeks to leverage this new technology to provide new solutions to existing clients, create solutions in new markets, and to improve its internal processes. An example of a solution for a new market is the implementation of cognitive systems in healthcare. Here, cognitive solutions can provide value to the medical staff by processing the large amounts of structured and unstructured data from medical records with a combination of natural language processing and machine-learning services. After the internalization of data, cognitive systems can assist healthcare professionals in their medical diagnoses. Initial test runs at several hospitals seem to be positive, and were seen as especially helpful in diagnosing patients that have been afflicted with a rare decease (Herper, 2017; IBM, 2016a, 2017; NG, 2016)
While these innovative technologies have helped IBM deliver more value to its customers, IBM would like to use these technologies to improve their own processes as well. One of these potential improvement areas identified by IBM is the exception handling process in the service parts operations (SPO) department. In recent years, most of the standard operational inventory management procedures have been automated but IBM still employs human planners to intervene when needed. These planners are prompted for action by the system when exceptional behavior of a service part is detected. Planners will then analyze the service part’s situation and attempt to solve the issue.
However, there are three factors which may limit the efficiency of the operational exception handling process: (i) when operational planners perform well on their task, they are often promoted to higher positions, resulting in personnel turnover and brain drain at the operational level; (ii) a planner’s service part portfolio changes every three months, resulting in planners having to relearn the intricacies of the service parts under their control; (iii) planners will generally not receive feedback on the impact of their decisions, resulting in planners not learning from their previous decisions.
6 truly exceptional cases. Additionally, cognitive systems could provide planner feedback on their earlier decisions. The goal of this research is thus defined as: “Provide insights in the possibilities of applying cognitive computing to the operational exception handling process at IBM, in order to improve the efficiency of the exception handling process”
2.2
Research questions
To provide an answer to this overall research goal and structure this research, we formulate five research questions. These research questions will answer the main research question of this thesis: “How can cognitive systems improve the efficiency of the operational exception handling process at IBM?” These research questions are:
1. What are the characteristics of the operational service parts environment?
a. What are the characteristics of the decision maker in this environment?
b. How can technologies be used to aid the decision maker in this environment?
2. What are the characteristics of machine-learning and cognitive computing?
a. What are the differences between machine-learning and cognitive computing?
b. What are the requirements for implementing these systems?
3. What are the characteristics of the operational exception handling processes at IBM?
a. What information is available to the planners?
b. What systems are used by the planners?
c. What steps are taken in the current exceptions handling process?
4. How can a model support the exception handling process?
a. What inputs should be given to the model?
b. Which algorithm should be used by the model?
c. How can the model’s performance be measured?
5. How can we assess the quality of the exception handling process?
7 b. How can the impact of a decision be measured?
Following the answers to these research questions, a final chapter will be devoted to discussing and combining these answers into an overall conclusion.
2.3
Scope
This master research project will focus on the impact of the operational exception handling decisions related to clients serviced by IBM within the European, Middle-Eastern & African (EMEA) region. This region consists of 518 inventory warehouses which are generally replenished by parts from the central buffer location in Venlo, The Netherlands. Instead of tackling the exception handling problem for the entire EMEA region this thesis will focus on the exceptions raised at this central buffer location.
The argumentation for this scope definition is threefold: resources constraints, present knowledge base, and complexity reduction. First, given the time and resources available for this master thesis, handling the entirety of the worldwide service part data within this timeframe would be impossible due to its sheer volume, as the EMEA region alone has more than 1.4 million active service parts. Secondly, this research will be conducted from the IBM location at Amsterdam, the Netherlands, where most of the employees are responsible for the service parts management in the EMEA region and thus have extensive knowledge of this region’s workings and intricacies.
Thirdly, since one of the goals of this research is to create a proof-of-concept model for the exception handling process within the limited timeframe available for this research, we want to reduce the complexity of the environment to be modelled. We accomplish this by choosing to focus this research on the central buffer location instead of the entire EMEA region, thus decreasing the complexity by eliminating the rules and regulations that exist in moving service parts between stock locations across the various countries. In addition to reducing the number of locations to be used in this research, the prototype model to be created during this research will be aimed at solving a single exception type. We believe that if the prototype model will be successful in automating a certain type of exception, similar design steps can be used to extend the model for other exceptions. More information regarding the selection of a suitable review reason for the initial model can be found in 5.2.1.
2.4
Methodology
8 search for a fitting solution. Given the preference of IBM for a cognitive computing model, we will start our research in this direction. If, however, we discover a mismatch between the desired solution type and the environment it must be placed in, we will branch out to find other possible solutions. Finally, we will create a proof-of-concept model based on our research.
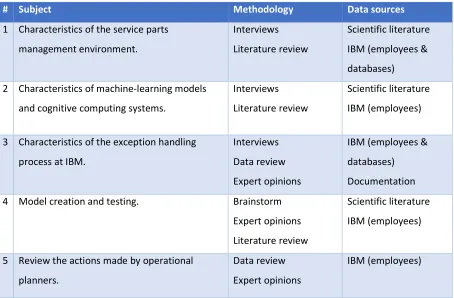
[image:18.595.73.527.336.634.2]To systemically research the objectives of these three parts mentioned above, we have created five research questions, as mentioned in 2.2. To answer those five questions, we will use a combination of literature review, interviews, data review, expert opinions, and brainstorm sessions. These methods will use the following data sources: scientific literature, IBM employees, IBM databases & systems, IBM’s internal research notes, and system documentation. The methodology and data sources to be used for each research question are shown in Table 1.
Table 1: Methodology broken down per research question
# Subject Methodology Data sources
1 Characteristics of the service parts management environment.
Interviews Literature review
Scientific literature IBM (employees & databases) 2 Characteristics of machine-learning models
and cognitive computing systems.
Interviews Literature review
Scientific literature IBM (employees)
3 Characteristics of the exception handling process at IBM.
Interviews Data review Expert opinions
IBM (employees & databases) Documentation 4 Model creation and testing. Brainstorm
Expert opinions Literature review
Scientific literature IBM (employees)
5 Review the actions made by operational planners.
Data review Expert opinions
9
2.5
Deliverables
The main deliverable of this research project will be a master thesis covering the following topics:
• An overview of the current operational service parts management process at SPO,
• A prototype model for the automation of the exception handling process,
• An indication of the possibilities and requirements of cognitive systems,
• Suggestions for the implementation of the model,
• Suggestions for further expansion of the model.
In addition to the thesis, I will hand over the source code of the model used for quality testing to IBM after the completion of this thesis.
2.6
Thesis outline
[image:19.595.75.526.560.678.2]Within this thesis, we will use the five research questions stated earlier as a guideline for the chapter order. Chapter 3 will consist of the theoretical framework of this thesis and will contain the answer to the characteristics of the operational service parts environment, the characteristics of machine-learning, and the characteristics of cognitive systems. The following chapter will then provide an overview of the current situation at the SPO department of IBM and the information available to the operational planners. Then the characteristics of the prototype model and its performance, will be discussed in chapter 5. In chapter 6 we will propose a method of assessing the quality of the exception handling process. The last chapter is reserved for the overall conclusions, limitations and suggestions for further research. A breakdown of the research questions and their relevant chapter is given in Table 2.
Table 2: Thesis outline
Research question Chapter(s)
1 What are the characteristics of the operational service parts environment? 3 2 What are the characteristics of machine-learning and cognitive computing? 3
3 What are the characteristics of the operational exception handling processes at IBM? 4
4 How can a model support the exception handling process? 5
10
3
Theoretical framework
Within this chapter, we will describe the results of the literature search. The goal of this literature research is threefold: (i) define the characteristics of the operational service parts management environment and the role of the operational decision maker; (ii) identify systems that can be used to automate the exception handling process; and (iii) describe the characteristics of a control tower environment. The insights gained from this literature research will be used to answer the first two research questions regarding the characteristics of the operational service parts environment and the characteristics of machine-learning models.
3.1
Operational service parts management
In any organization, we can distinguish between three levels of decision making: strategical, tactical, and operational. Strategic decisions relate to the long-term usage of the organizations assets to achieve its goals, e.g. deciding what markets to enter. Tactical decisions relate to the implementation of the strategic decisions such as deciding a part’s inventory stock levels. Finally, operational decisions relate to the day-to-day decisions such as creating the order delivery schedule (Schmidt & Wilhelm, 2000; Slack et al., 2013). Applying these definitions to the service parts management environment, we find that operational decisions are mostly related to the daily management of the inventory positions of the various service parts. A task which, in a predictable environment, should be relatively easy to automate. The operational service parts management environment however, should not be classified as a predictable environment but as a dynamic decision-making environment according to Brehmer (1992). In this paper, he argues that a dynamic decision-making environment consists of four characteristics:
1. Reaching the goal requires a series of decisions. The system’s controller will need to make numerous decisions to maintain in control of the system.
2. Decisions made within the system are not independent. A decision made by the system’s controller will influence decisions made at a later point in time.
3. The decisions problem’s state changes, both autonomously and because of the actions made by the system’s controller.
4. Decisions need to be made in real time, as decision makers are forced to react to changes in the environment which are largely out of their control.
11 by controllers in the service parts operational environment have the goal of attaining a certain service level for the customers, requiring a series of decisions during the part’s lifecycle; (ii) any decision made by a planner will also impact his future decisions, e.g. placing a large order today may lead to excess holding costs or scrapping parts later in the service part’s lifecycle; (iii) the system’s problem state will change both without input from the planner, e.g. a client order, and as a direct result of the planner’s actions, e.g. a stock replenishment order; (iv) decisions are made in response to external events outside of a planner’s control and failing to react in time could have major consequences on the system’s health.
3.2
Human decision maker
Now that we have defined the service parts management environment as a dynamic one, we will delve deeper into the characteristics of the operational service parts planner’s tasks. The tasks appointed to these planners can be distilled to six dimensions according to the general systems theory (Brehmer, 1992). These dimensions are: the complexity of the system, the feedback quality, the feedback delay, the rate of change, the relation between the process to be controlled and those used for control, and the extent to which the decision-making power can be delegated.
Complexity of a task differs per controller and should be defined as a relative concept that compares the capability of the controller to the complexity of the system. It is in this dimension that the differences between a human and a computerized controller are the most diverse. Human decision makers will have a hard time processing many items simultaneously and will thus define a system with many elements as a more complex system. Traditional computerized controllers will have difficulties controlling systems in which decisions must be made based upon interpretations of data instead of fixed rules, but cognitive computing systems will be able to circumvent this limitation (Dalton et al., 2015; Kelly, 2015; Lerch & Harter, 2001).
12 (Gibson, 2000; Gonzalez, 2005; Lerch & Harter, 2001).
The rate of change in a process refers to the possibility of the controller to delay decisions based on direct feedback from the system. In cases of a system with a high rate of change, decisions need to be made quickly to maintain in control, e.g. close-combat engagements resulting in the controller to make decision based on feedforward control. Systems with a slow rate of change are less dynamic as their decision series become less independent and more sequential in nature (Brehmer, 1992). Within the field of service parts management, the rate of change depends highly on the type of part. Some parts have a high turnover rate, so-called fast movers, creating a more dynamic planning problem whereas other parts, slow movers, may be sparingly demanded, resulting in a more deterministic planning environment.
As for the relation between the process to be controlled and the processes available for control, also referred to as the requisite variety within the system theory, decision makers within the service parts industry should be able to influence most factors related to inventory management (Godsiff, 2010). While some factors will remain out of their control, freak of nature events such as earthquakes, they could still hedge their bets to some degree against the impact of such events.
The delegation of decision making power within the system mostly refers to the ability to distribute the decision-making responsibilities to the lower system levels closest to the actual events. Brehmer (1992) states that, especially in system with delays, this may increase the system’s efficiency. A good example of delegating the decision-making power downwards can be found in the military where the squad leader has full decision-making power during an operation.
3.3
Decision support systems
13 (Fransoo & Wiers, 2008; Geertjes, 2014).
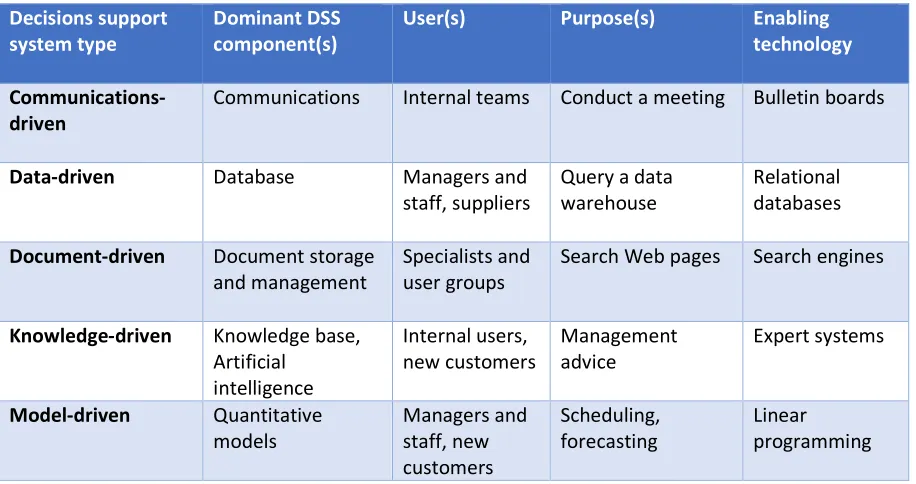
[image:23.595.71.529.395.637.2]The decision support systems most commonly implemented by organizations can be classified as: model-driven, communication-model-driven, data-model-driven, document-driven and knowledge-driven. Model-driven DSS are based upon statistical optimization or simulation such as linear programming used for forecasting demands. Communication-driven DSS aid in the effective sharing of information between members of a group, an example of such a DSS would be an electronic meeting system. Data-driven DSS are often tools such as IBM’s Cognos that aid in the collection and manipulation of large amount of internal and external company data. Document-driven DSS are specialized in processing and manipulating electronic documents to, for example, automate a financial approval process. Finally, knowledge-driven DSS apply information from human expertise in areas such as business procedures and rules, to generate decision suggestions for a specific domain (Niu et al., 2009; Power, 2016; Power, Sharda, & Kulkarni, 2007). A framework of the DSS types and their characteristics as proposed by Power (2016) is shown in Table 3. This framework will be used to classify the proposed model in 5.1.
Table 3: Decision support system framework
Decisions support system type
Dominant DSS component(s)
User(s) Purpose(s) Enabling technology
Communications-driven
Communications Internal teams Conduct a meeting Bulletin boards
Data-driven Database Managers and staff, suppliers
Query a data warehouse
Relational databases
Document-driven Document storage and management
Specialists and user groups
Search Web pages Search engines
Knowledge-driven Knowledge base, Artificial intelligence Internal users, new customers Management advice Expert systems
Model-driven Quantitative models Managers and staff, new customers Scheduling, forecasting Linear programming
3.4
Machine-learning
14 categories: supervised learning, unsupervised learning, and reinforcement learning (Jordan & Mitchell, 2015; Kubat, 2015).
Supervised learning is the most widely adopted machine-learning method and is able to link a system’s outputs to inputs. Creating these links, also called mapping, requires a training set of labelled data. A supervised learning machine will then use algorithms such as decision trees and logistic regression to create the mapping. Links between the input and output pairs can be deterministic or probabilistic depending on the dataset and the requirements. This method can, for example, be used to predict the type of groceries bought depending on social economic factors.
Unsupervised learning enables machines to explore unlabeled data and find clusters within. Algorithms such as cluster analysis and market basket analysis are often used to identify segments within the given dataset. A usage example of this machine-learning method is the ability to identify a shop’s consumer segments enabling it to more directly target these segments in its ads.
Reinforcement learning is a mix of both supervised and unsupervised learning as training samples given to the system will only provide the system with an indication of the correct input-output pair. Systems using reinforcement learning will therefore attempt to continuously search for the best possible outcome given a set of input values. This machine-learning method are often implemented in a general control-theoretic setting in which an agent is required to learn a control strategy for acting in an unknown dynamical environment. The aim of the agent is to choose a set of actions for any given state where he will maximize his expected returns. The agent can continuously update his best course of action, by incorporating the feedback given by the system on the agent’s previous actions. Examples of reinforcement learning applications are self-driven cars and product delivery routing.
3.4.1 Cognitive computing
Cognitive computing is seen by many researchers the next step in the evolution of machine-learning and artificial intelligence (AI). The main difference between AI and cognitive computing can be found in the answering style of both systems. G. Rometty, IBM’s CEO, describes this difference as follows: “In an artificial intelligence system, the system would tell the user which course of action to take based on its analysis. In cognitive computing, the system provides information to help the user make that decision”
15 One thing most researchers agree on however, are the four characteristics of a cognitive system. To receive this classification a system must be adaptive, interactive, iterative, and contextual. Adaptive refers to the ability of the system to resolve ambiguity, tolerate unpredictability, and process dynamic data in, or near, real-time. This is sharp contrast with the plethora of programmable systems used today, which produce their output based on deterministic rules. Interactive cognitive systems allow its users to define their needs and wishes intuitively and comfortably. This dimension refers to both the interaction between user and machine, and the interaction of cognitive systems with other machines and services. The iterative
dimension of a cognitive systems relates to the cyclical problem-solving methods incorporated by these systems. A cognitive system helps with the problem definition by prompting the user for more information or by collecting additional sources of input in case of statement ambiguity or incompleteness. Additionally, the system should remember earlier process interactions with the user to return the most appropriate information at the end of the interaction. Finally, the system should understand, identify and extract
contextual information such as natural language syntax, regulations, and user profiles. It is this requirement that enables cognitive systems to ingest a larger diversity of data compared to traditionally programmed systems (Consortium, 2016; Dalton et al., 2015).
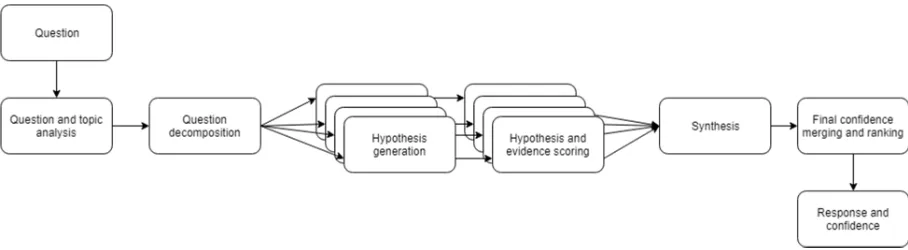
[image:25.595.70.524.570.695.2]Cognitive systems generate their answers via a process known as hypotheses generation. Instead of using programmed rules to immediately a single, definitive, answer, cognitive systems generate multiple hypotheses. The cognitive system ranks the hypotheses based on their fit to the question context and its previous interactions. It then provides the user with the answer that has the highest probability of being the correct one, also known as the one with the highest confidence. Users are asked to provide feedback on the generated answer to allow the system to learn from this interaction. This feedback will be incorporated in the knowledge base for future reference (Ferrucci et al., 2010; Goksel Canbek & Mutlu, 2016; Kelly, 2015). An illustration of this hypotheses generation and answering is shown in Figure 2.
16
3.5
Control tower environment
[image:26.595.72.196.302.516.2]Supply chains of organizations are the linkages of upstream and downstream flows of products services and information. Control towers are designed to visualize all these processes in a centralized environment. In addition to a simple visualization of the processes, the functions of a control tower are fivefold. It can be used by the supply chain’s organizations for planning and routing, auditing and reporting, forecasting, event management, and decision making (Bhosle et al., 2011). To properly fulfill these five functions a supply chain control tower consists of five main layers. These are, from bottom to top: the supply chain business layer, the information perception layer, the information operation control layer, the information service platform layer, and the information manpower layer, as shown in Figure 3 (Shou-Wen, Ying, & Yang-Hua, 2013; Trzuskawska-Grzesińska, 2017).
Figure 3: Control tower environment Supply chain business layer
The supply chain business layer consists of all the processes required in a successful supply chain and thus is therefore modeled as the base of the supply chain control tower. Within the general supply chain control tower proposed by Shou-Wen et al. (2013) this layer contains the procurement, transportation, warehousing, loading and unloading, handling, distribution processing and packaging, distribution, and information service processes. Organizations that are typically present in this layer of the supply chain include: raw material suppliers, manufacturers, outsourcing logistics service providers, distributors, dealers and users.
Information perception layer
17 integrating information collection and transmission. Data gathered from the information perception layer is at the heart of the analytical processes and thought should be given to the collection methods used. This data can be collected and transmitted by the supply chain organizations themselves or they can hire an external organization to do so. Hiring an external organization instead of creating an in-house solution, could be used to alleviate asymmetrical trust levels between the organizations (Cetindamar, Çatay, & Basmaci, 2005; de Kok, van Dalen, & van Hillegersberg, 2015; Khurana, Mishra, & Singh, 2011).
Information operation control layer
In the information operation control layer, we find the supply chain information storage and the supply chain information control sections. The data originating from the supply chain business layer and gathered through the methods from the information perception layer are stored within this layer (Shou-Wen et al., 2013). Storing the data should be done in a repository that is accessible to all the members of the supply chain. Nowadays organizations are often using cloud-based data storage as cloud storage is easily scalable and can be acquired as a service, reducing the initial financial investment (Raj & Sharma, 2014). The data acquired from a product’s journey through the supply chain, will be used to provide feedback on its quality after every step of the supply chain (Shou-Wen et al., 2013; G. Wang, Gunasekaran, Ngai, & Papadopoulos, 2016; L. Wang & Alexander, 2015).
Information service platform layer
Next, we have the information service platform layer and its purpose is threefold. Firstly, it is used to centrally store and dynamically update the information from the lower control tower layers to improve and maintain the required transparency. Secondly, it is used for the real-time monitoring of the information processes within the supply chain. Finally, it provides an insight in the whole supply chain quality issues and its feedback control by comparing the current processes to the supply chain metrics. The combination of real-time monitoring and transparency of the data, enables the supply chain partners to reduce their time to action in case of an unwanted event occurring at any point in the supply chain reducing the potential impact of these events (Heaney, 2014; Jüttner, Peck, & Christopher, 2003).
Information manpower layer
18
3.6
Chapter summary
This chapter was written to create a better understanding of the theoretical side of the operational service parts management environment, to provide a basis the role of the operational decision maker, to research the characteristics of a machine-learning system, and to explore the control tower environment. The most important findings in this chapter are:
• The service parts management environment can be classified as a dynamic decision-making environment based on: reaching the goal requires a series of decisions to be made, these decisions are dependent on each other, the decision problem state changing continuously, and decisions needing to be made in real time.
• The characteristics of decision makers within this environment can be classified along six dimensions: the complexity of the system, the feedback quality, the feedback delay, the rate of change, the relation between the process to be controlled and those used for control, and the
extent to which the decision-making power can be delegated.
• Decision support systems can be deployed to aid human decision makers in their task by
minimizing cognitive errors, collecting information, evaluating the situation, generating alternative actions, and implementing solutions.
• Machine-learning can be used to predict outcomes, uncover segments within the data, or improve the system’s decision-making processes over time. Such models can be divided in three
categories: supervised, unsupervised, or reinforcement learning.
• Cognitive systems can be used to enhance, replace, or cooperate with the human workforce. The strengths of a cognitive system compared to a programmable system are its adaptability, their
ability to process both structured and unstructured data, and the ability to improve over time by incorporating user feedback.
• The typical control tower environment consists of five layers: the supply chain business layer, the information perception layer, the information operation control layer, the information service
19
4
Status of IBM processes and systems
Within this part of the thesis, an overview will be given regarding the processes and systems at IBM relevant to this thesis. We will start with a general explanation of the service part operations (SPO) and its supply chain. Then, an overview of the systems used within this environment are explained. Finally, an overview of the planning and exception handling processes, and a more detailed explanation of the exceptions raised by the systems are given. By using this information, we aim to answer the third research question regarding the information currently available to the operational planning staff at IBM, and to illustrate the current status of SPO at IBM.
4.1
Service parts operations
The main responsibilities of IBM’s SPO are the allocation, cost management, and inventory planning of the service parts for their customers. The service parts managed by SPO are only meant for the business-to-business market and the contractual agreements are highly customizable. For service parts regarding IBM machines, so called logo products, and consigned brands such as Lenovo and Cisco, SPO is responsible for all the previously mentioned processes. Other organizations however, only want SPO to be responsible for some of the processes such as the inventory planning. Whatever the responsibilities of SPO for the customer, SPO always has to carry out its operations in a highly variable and uncertain environment.
20 Table 4: Global hands-on orders breakdown
Order type Orders % of total orders
Warranty 44,181 45%
New Buy 32,507 33%
Repair 20,062 20%
Emergency 1,569 2%
New business opportunity 95 <1% Excess, surplus and scrap 47 <1%
Total 98,461 100%
A bit more than a fourth (27%) of the global SPO orders where directly related to the EMEA region. The biggest difference between the global hands-on order breakdown and that of the EMEA region is the decrease in warranty and repair orders. This difference can be attributed to the other regions using PIMS (Parts Inventory Management System) instead of CPPS (Common Parts Processes and Systems) for their service parts management. Within PIMS, the parts available for repair are not linked to the Servigistics ordering system, thus requiring the operational planners to create a feed-ordering process via spreadsheet calculations.
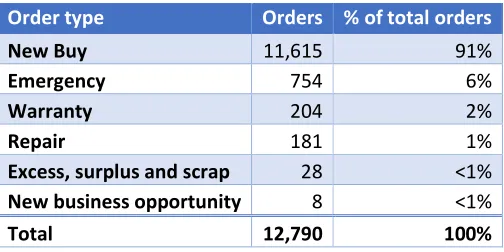
A characteristic specific to the operational planning of the EMEA region, is that all the emergency orders are placed by local warehouses in the network on the region’s central buffer, i.e. internal replenishment orders. Planners in this region cannot place emergency orders on suppliers as this option is not included in the contracts between the supplier and IBM. The order types are further broken down in Table 5.
Table 5: EMEA hands-on orders breakdown
Order type Orders % of total orders
New Buy 11,615 91%
Emergency 754 6%
Warranty 204 2%
Repair 181 1%
Excess, surplus and scrap 28 <1% New business opportunity 8 <1%
Total 12,790 100%
4.1.1 Supply chain
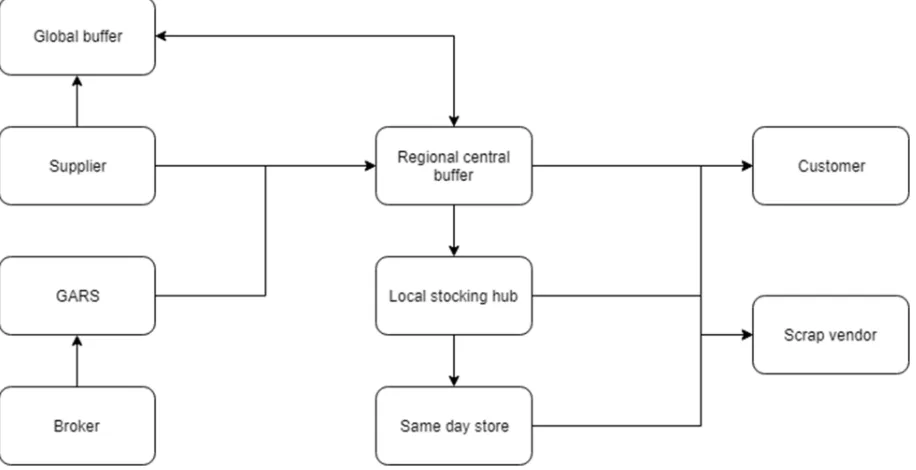
[image:30.595.173.425.526.652.2]21 market after being tested by GARS. In almost all cases within the EMEA region, the supplier will send its products to the central buffer location in Venlo, the Netherlands. There are two exceptions: (i) a service part is bought via the open market, in this case parts are first send to GARS in Germany for quality checking; (ii) a service part is bought from a local supplier, in this case the service parts are directly send to one of the local stocking hubs.
Next to the large central buffer warehouses and the local stocking hubs, IBM also implemented small lockers filled with critical parts close to the customer. Deciding where and how much of the service parts to store depends on a combination of factors with the most important ones being: the expected failure rate of the part, the criticality of the part, the cost of the part and the demands of the customer. In case of expensive slow-moving parts, SPO may decide to stock the part only on the global buffer in Mechanicsburg, USA. When this part is needed, a transshipment from the global buffer to the region’s central buffer is ordered. Lateral replenishments are almost non-existent in the EMEA region, due to legal difficulties in importing and exporting service parts across the countries of the region.
[image:31.595.71.529.425.660.2]Finally, if parts are deemed obsolete, they will be marked as scrap and transported to a scrap vendor, thus leaving the network. An illustration of this supply chain environment is shown in Figure 4.
Figure 4: SPO EMEA Supply chain
4.1.2 Service parts management control tower
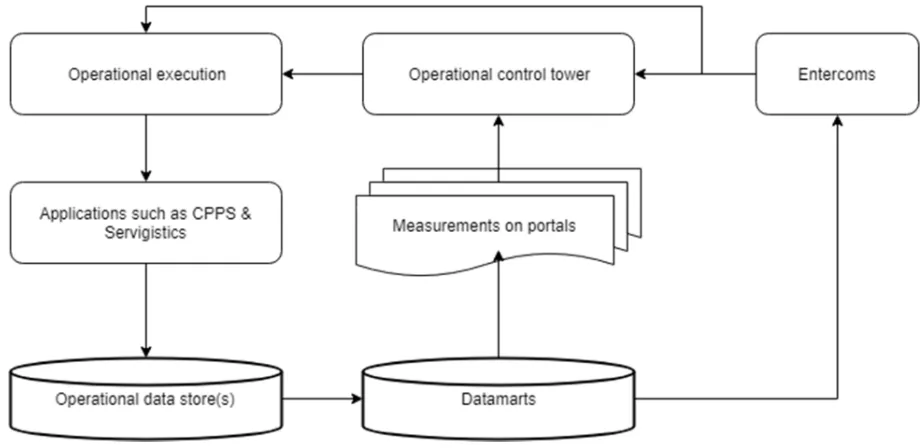
22 2.0. At the base of its control tower are the operational data storage and datamarts within IBM. These processes store and organize all the information of the service parts management process, from the service part stock levels at location to the orders placed at the suppliers. The data from these datamarts is directly accessible and manipulatable by the systems used at SPO, CPPS and Servigistics, which are described on more detail in 4.1.3. An external organization, Entercoms, uses the information from IBM’s datamarts to analyze the performances of the service parts management on a tactical level and provides insight into KPI’s such as the order fulfillment rate per supplier. The information gained from the Entercoms analyses are then reported back to IBM and can be used by the managerial staff at SPO to improve IBM’s. An illustration of the control tower 2.0 is shown in Figure 5.
Figure 5: IBM's control tower 2.0
4.1.3 Customer machine failure situation
23 technician is incentivized to return unneeded parts quickly to the network with a financial compensation to prevent unnecessary ordering of parts by the planners or hoarding of parts by engineers. If the problem has been fixed, the call will be closed and the customer will be informed. If the engineer on site is unable to solve the problem, he will contact the call center again and the ticket will be transferred to a higher support level support, the engineering department or even procurement depending on the level of complexity and possible solutions. A flowchart of the customer failure situation is shown in Figure 6.
Figure 6: Customer machine failure flowchart
4.2
Systems
The planners responsible for the EMEA region at SPO mainly use CPPS and Servigistics Plan for operational planning and control. The largest differences between the two systems are seen in the interface and the relevance of the data. Servigistics has a more modern graphic interface, provides more information on the same screen and suggests planner actions but the service part information is limited to the inventory situation at the latest database update cycle. CPPS on the other hand, has a traditional terminal interface and requires queries to pull the information but has access to real-time stock levels at all locations. More details regarding these systems are given in the remainder of this chapter.
4.2.1 Servigistics Plan
Servigistics Plan, formerly known as XelusPlan, has been used by IBM since 2004 for operational service parts planning. Within this system planners have an overview of all the service parts under IBM’s control. Servigistics has been designed to automatically handle most of the service parts management. It uses the input from IBM’s databases to forecast customer demand, to compare demand to on hand stock balances and to recommend order quantities. When these orders, and their expected consequences, remain within the boundaries of the system’s parameters, they will be automatically processed by Servigistics. If data from a service part falls outside of these boundaries however, the relevant part planner will be prompted for action via the appearance of a review reason in his work queue.
24 the planner work queue, the planner worksheet and the order book modules for their activities. These three parts of the system will therefore be described in more detail below.
Planner work queue
Upon starting the Servigistics system a planner is shown his work queue. Within this queue, he is given a list of parts that need attention. He will be given information regarding the part name, the location, the review reason, the priority of the review reason and the time since the review reason has appeared for the part. This provides him with a quick indication of the part’s status and helps him prioritize his daily work. Clicking on the service part within his queue redirects him to the planner work sheet.
Planner work sheet
The primary features of Servigistics used by the planners are located on the planner worksheet. The planner work sheet consists of five different windows, namely: the item data window, the schedules data workspace, the notepad, the review reason list, and the item family window. The worksheet in general tracks the results of the service part inventory plan over time and alerts the user when a planning rule has been crossed or is projected to be crossed. A more detailed description of the different windows can be found in Appendix A.
Order book
Users can open the order book in Servigistics to find a list of service part order information such as supplier, order quantity and order status. Next to listing this information the order book can be used to review, adjust or reconcile orders. Most of the orders required for the service parts management are placed by the system itself, however if human intervention is required in the ordering process, Servigistics will still attempt to aid the user by suggesting an order quantity and due date. This suggested quantity will be based upon the difference between the maximum inventory threshold and the expected stock level at the time of delivery.
4.2.2 CPPS
25 interface. Accessing the information within CPPS is done by querying the database through a terminal interface or via programs such as QMF for Workstation.
4.3
Operational exception handling
After the description of the systems used by the operational planners we will describe the planning and exception handling processes in more detail. First, we will describe these two processes and thereafter we will describe the characteristics of the exceptions raised by Servigistics.
4.3.1 Planning
Most of the operational planning of the service parts has been outsourced to locations in Hungary and India. The planning of service parts starts in India, where the planners are responsible for the inventory levels at all the regional central buffer locations. Service parts planning for the other locations within the EMEA region, so called country planning, is done in Hungary. Finally, the employees at the Amsterdam location are responsible for supplier contact and approval of high impact decisions. The warehousing and transport for the service parts has been fully outsourced by IBM to third party logistic (3PL) providers.
The operational planning decisions made by the service parts planners at SPO are based upon the tactical levels set by the management. These tactical levels are based upon parameter such as: unit price, stocking cost, criticality, predicted usage and the service level required by the customer(s). Using these parameters, SPO has created four tactical stock levels, which are, from lowest to highest: the must order point (MOP), the policy safety stock (PSS), the maximum order up to point (MOR), and the excess stock level (EXC). While most organizations use safety stock levels as a buffer for unexpected increases in demand, SPO has two tactical levels situation below a service part’s ideal level, the MOP and the PSS. The MOP should be seen as an indicator for immediate action, if a service parts inventory position drops below this line, operational planners should take immediate action to increase the inventory position. The PSS, usually higher than the MOP, is used as a guideline in the ordering process. Most orders within Servigistics are planned to arrive when the inventory position reached this level and, usually, the incoming order will increase the inventory position to the MOR level. The stock inventory position in a normal situation thus moves between the PSS and the MOR. Above the MOR, we have the EXC, above which service part stock is eligible for scrapping orders.
4.3.2 Exception handling
26 to the item’s work sheet. Now the planner’s problem-solving process begins. Experienced planners will know what characteristics to check based upon the part’s review reason, the basic training manual suggests planners to start their analysis by:
• Checking inventory
• Reviewing forecasts
• Reviewing open orders
• Checking actual demand
• Checking allocated quantities
• Checking for past-due orders
• Checking for large future orders
After their analysis, planners can either add, cancel or change orders, change forecasts, or contact other parties such as the procurement department. When the exception has been handled, planners are instructed to start working on the next item in their work queue thus starting the process anew.
4.3.3 Review reasons
Whenever the inventory position of a service part moves outside the predefined parameters or the characteristics of a service part change, Servigistics will alert the planner responsible for the service part by placing a review reason in his work queue. Planners will then attempt to resolve these review reasons as fast as possible, as ignoring review reasons might result in further escalations. Currently there are 40 triggerable review reasons within Servigistics and the complete list can be found in 0. Within this part of the chapter we will research what kind of actions can be taken by operational planners to handle these review reasons, how these review reasons are distributed among the service parts, and if there is a correlation between the set of review reasons linked to the same service part.
Looking at the actions required for resolving a review reason in the exception handling manual found in Appendix C, we state that these can be divided among five categories: planner review, informational, order, forecast, part settings and procurement. Planner review indicates a need for the planner to verify an action or change in the part characteristics. As an operational planner is not allowed to change all settings, e.g. part relationships, some of these cases will need to be referred to other users. Informational
27 When the suggested action is order related, planners are advised to create, cancel, or adjust orders related to the service part. In case of a recommended forecast change, planners should critically analyze the current forecast method(s) used for the part and decide if a different forecasting method or adjusting the current forecast might be a better fit of the service part’s movements. The procurement category indicates the need for the planner to contact the procurement department to solve the exception, e.g. there not being any supply sources for the service part while there is customer demand for the part. Most of the review reasons are concise enough to require a single type of action, but some of them have different recommended actions based on the situation, e.g. manually creating new orders or changing the forecast are both valid options to remedy a projected stock-out.
To give an overview of the spread of the review reasons over these five categories, we extracted a list of all the review reasons present at EMEA’s central buffer location on 27-09-2017. This list contained 94,363 review reason entries spread over 72,146 service parts. From this analysis, we find that, while most recommended actions are in the order category, actions related to review and information appear the most in practice. For the review and information categories there exists a single review reason that is responsible for the lion’s share of the appearances. Nearly 70% of the review actions are related to verification of machine configuration changes, whereas 77% of the informational review reasons are related to part with a weighted average cost (WAC) of 0. The other three categories have their appearances more evenly spread out between the different review reasons.
28 Table 6: Review reason action categories
Action category Review reasons in category Appearances Non-Lenovo appearances
Review 10 52,193 24,315
Information 5 37,374 19,183
Order 22 5,681 3,829
Forecast 8 3,091 2,377
Procurement 4 2,611 2,047
Next to analyzing the possible action categories of the review reasons, we are also interested in possible correlations between the appearance of review reasons. Since a single service part can have multiple review reasons attached to it, we analyze if there are certain sets of review reasons that appear often, as this could provide extra information for an operational planner. Using the same dataset of the action category analysis, we find that most of the parts, 72%, had a single review reason attached to them at the time of review. The highest number of review reasons attached to a single part in the dataset was eight with the average being 1.31. The number of review reasons attached to a service part is shown in Table 7.
Table 7: Frequency of review reasons per service part
Number of review reasons attached to part Frequency
1 53,383
2 15,490
3 3,123
4 127
5 18
6 4
7 0
8 1
[image:38.595.170.427.443.581.2]29 bread and ham in supermarket, there is a 70% chance he will also buy cheese. This probability that a consequent will appear if its antecedent(s) are present is called the rule confidence.
[image:39.595.199.398.395.595.2]From our analysis, we find a relatively high rule confidence for some of the sets, but the confidence for the link between antecedent and consequent quickly diminishes. Looking at the ten sets with the highest confidence, we find that most of these sets consist of informational review reasons. The rule with the highest support level however, between R24 and R83, consists of two order related review reasons. A closer look at these two review reasons reveals that these are closely linked to each other as they are both related to a projected low inventory level with R24 indicating a projected stock out situation and R83 indicating a projected stock position below the must order point. Nevertheless, this analysis indicates that some sets of review reasons have a high probability of appearing together and that this information might be used in the operational exception handling process. A list of the ten rules with the highest confidence are shown in Table 8 and a complete list of review reason sets and their confidence values can be found in Appendix D.
Table 8: Review reason rules
Consequent Antecedent Confidence %
R24 R83 48.5
R67 R22 and R3 43.9
R22 R51 and R67 43.2 R67 R51 and R22 37.5
R22 R51 32.0
R67 R22 28.5
R3 R22 and R67 28.5
R67 R51 27.8
R3 R67 26.4
30
4.4
Chapter summary
Within this chapter, we have explained the workings of IBM’s SPO department, we have outlined the current operational control tower environment, and we have described the systems and processes currently used in their operational planning activities. The goal of this chapter was twofold: (i) provide the reader with an overview of the current situation at SPO; (ii) answer the third research question regarding the characteristics of IBM’s operational exception handling process. In summary, we can conclude the following:
• Operational planners at SPO use a combination of Servigistics and CPPS for their planning and exception handling, whereas the managerial staff leverages the Entercoms analyses to keep tabs on supplier’s performance.
• By using Servigistics and CPPS, planners have access to general part information such as WAC and criticality, part forecasts such as demands and returns, part substitutes, orders, and a method of communicating between users via notes.
• Of all the orders made by SPO, 77% made automatically by the Servigistics system. In case of a manual order, Servigistics will attempt to aid the planner by recommending an order quantity
and due date.
• When a service part becomes problematic or is projected to become problematic, Servigistics will alert operational planners by creating review reasons. Most review reasons are simply informational or require the planner to verify a change in part characteristics. The remaining
review reasons require either order management, changes in the forecast method or contacting the procurement department.
• Of the review reasons raised by Servigistics, we found that 72% of the parts only have a single review reason linked to them. The other 28% however, have between two and eight review