http://wrap.warwick.ac.uk
Original citation:
Chester, Adam P., Leeke, Matthew, Al-Ghamdi, M., Jhumka, Arshad and Jarvis,
Stephen A. (2011) A framework for data center scale dynamic resource allocation
algorithms. In: Proceedings of the 11th IEEE International Conference on Scalable
Computing and Communications (SCALCOM'11), Pafos, Cyprus, 31st August - 2nd
September 2011. Published in: 2011 IEEE 11th International Conference on Computer
and Information Technology (CIT) pp. 67-74.
Permanent WRAP url:
http://wrap.warwick.ac.uk/45661
Copyright and reuse:
The Warwick Research Archive Portal (WRAP) makes this work by researchers of the
University of Warwick available open access under the following conditions. Copyright ©
and all moral rights to the version of the paper presented here belong to the individual
author(s) and/or other copyright owners. To the extent reasonable and practicable the
material made available in WRAP has been checked for eligibility before being made
available.
Copies of full items can be used for personal research or study, educational, or not-for
profit purposes without prior permission or charge. Provided that the authors, title and
full bibliographic details are credited, a hyperlink and/or URL is given for the original
metadata page and the content is not changed in any way.
Copyright statement:
“© 2011 IEEE. Personal use of this material is permitted. Permission from IEEE must be
obtained for all other uses, in any current or future media, including reprinting
/republishing this material for advertising or promotional purposes, creating new
collective works, for resale or redistribution to servers or lists, or reuse of any
copyrighted component of this work in other works.”
A note on versions:
The version presented here may differ from the published version or, version of record, if
you wish to cite this item you are advised to consult the publisher’s version. Please see
the ‘permanent WRAP url’ above for details on accessing the published version and note
that access may require a subscription.
A Framework for Data Center Scale Dynamic Resource Allocation Algorithms
A. P. Chester, M. Leeke, M. Al-Ghamdi, A. Jhumka and S. A. Jarvis
Department of Computer Science, University of Warwick Coventry, United Kingdom, CV4 7AL
{apc, matt, mhd, arshad, saj}@dcs.warwick.ac.uk
Abstract—The scale and complexity of online applications and e-business infrastructures has led service providers to rely on the capabilities of large-scale hosting platforms, i.e., data centers. Dynamic resource allocation (DRA) algorithms have been shown to allow server resource allocation to be matched with application workload, which can improve server resource utilisation and drive down costs for service providers. However, research on DRA algorithms has almost exclusively focused on their performance characteristics at small-scale, precluding their useful application in commercial hosting environments, such as those dedicated to supporting cloud computing. In this paper, we show, and subsequently propose a framework to address, the scalability problems of current DRA algorithms. We then build on the proposed framework to develop a highly-scalable algorithm for dynamic resource allocation.
Keywords-Cloud Computing, Data Center, Dynamic Resource Allocation, Server Provisioning, Scalability
I. INTRODUCTION
Online applications and e-business infrastructures are subject to unpredictable fluctuations in workload, not least because application workload is typically demand-driven. These un-predictable fluctuations, which may be orders of magnitude in extent, can make economic resource provisioning difficult. The hosting of such applications in data centers can be seen as a response to this issue. Typically an organisation will agree to pay a provider for a specified level of service, with that service provider then taking responsibility for the allocation of resources to applications. However, as it is generally the goal of any service provider to maximise income and reduce outlay, resource utilisation is a concern. Dynamic resource allocation (DRA) algorithms allow server resource allocation to be matched with application workload, improving server resource utilisation in situations where workloads are volatile. The potential effectiveness of such DRA algorithms, particularly when compared with static allocation approaches, is well established [1]. The characteristics and benefits of DRA algorithms lend them-selves to data center scale resource management. Such DRA algorithms will typically consider many factors when attempting to make informed decisions regarding the alloca-tion of resources, including the number of requests, service-level agreements, current resource utilisation and predicted workload. However, this multiplicity of concerns results in a huge state space which DRA algorithms have to explore in order to provide effective resource allocation. It is this large state space that presents the scalability challenges in the design and development of DRA algorithms.
A. Contributions
In this paper, we make the following specific contributions:
• We formalise the DRA problem and show it to be an NP-hard problem.
• We show that a class of state-of-the art DRA algorithms have exponential complexity.
• We strengthen our system model to develop a frame-work for the development of scalable DRA algorithms. • We demonstrate the application of our framework by
developing a scalable and efficient DRA algorithm.
B. Paper Structure
The remainder of this paper is structured as follows: In Section 2, we give an overview of related work. Section 3 sets out the adopted system model. Section 4 presents a scalability analysis for a general class of DRA algorithm. An improved, demand-based approach is proposed in Section 5. Section 6 presents the experimental setup used in our analy-sis, whilst Section 7 shows performance comparisons which illustrate the effectiveness of the proposed approach. Section 8 concludes this paper with a summary of achievements and a discussion of future work.
II. RELATEDWORK
Online applications and e-Business infrastructures are sub-ject to large variations in workload. In cases where the applied workload is greater than the system capacity, a system will become overloaded, which will in-turn lead to long system response times and a reduction in throughput. Such situations can have severe consequences for all parties involved, as illustrated by prominent examples such as the CNN outages following the 9/11 terror attacks [2] and the estimated cost of service downtime for Amazon.com [3]. The use of dynamic resource allocation has been shown to improve the performance of individual applications and increase the utilisation of system resources [1].
Work in [4] utilises a mean value analysis approach to maximising the profit obtained from an enterprise system, with resource allocation across all tiers of a 3-tier architec-ture. The work is extended in [4] to incorporate an admission control policy which further improves results. This work is extended in [5] to include workload predication, which further increases the profits obtained.
quality of service (QoS). This work demonstrates a policy which delivers significant improvements in profits, however the algorithm demonstrates poor scalability characteristics as the number of service classes increases. In contrast, work in [7] develops four heuristic policies for dynamic server reallocation which aims to minimise the holding cost of queued jobs within the system. In this paper, the policies are developed for allocating resources across two applications. This work was validated experimentally by work in [1].
Work in [8] proposed a approach known as cluster-on-demand (COD). This approach is based on dynamic alloca-tion from a common pool to many virtual clusters, each with independently configured environments, access controls and network storage volumes. The experiments associated with this work were performed using a physical cluster composed of 80 servers. This paper serves as a good example of a working dynamic resource allocation scheme, though the number of applications examined is limited.
In contrast to on-demand techniques, [9] explored periodic server provisioning. Here a single application, to which idle servers are added as load increased, was analysed, with short-term and long-term workload prediction being used to guide resource allocation. The work presented differs from [9], as the scale of the environment is fixed, with applications competing for available resources.
Much research in application performance modelling can be applied to resource provisioning. For example, analytical application models were employed in [10], [11], queueing models have been applied in [12] and online measurement has been used for dynamic provisioning in [13].
The greatest limitation of existing DRA algorithms is the limited number of servers and applications that have been used in their evaluation. In this paper, we directly address this limitation, demonstrating that a class of DRA algorithm, which accounts for many established policies, is not suited to the effective management of resources at data center scale. This paper is differentiated from similar work on DRA algorithm analysis [7] by (i) its focus on scalability, an issue that has not received adequate treatment in existing literature, and (ii) the development and validation of a framework for DRA algorithm design and implementation.
III. SYSTEMMODEL ANDSCALABILITYANALYSIS
We consider the following system model: A large-scale hosting platform consists of a set of servers S =
{S1, S2, ..., SM} for the processing of a number of
appli-cations A={A1, A2, ..., AN}, whereM ≥N. We assume
that (i) all servers Si ∈ S are homogeneous, i.e., they
provide identical resources, and (ii) each server has all the resources required by an application.
The DRA problem is as follows: Given a system with a set A = {A1, . . . , AN} of applications, and a set S =
{S1, . . . , SM} of servers, allocate applications to servers
such that overall utility of the system is maximised. For-mally, given a set of possible mappings F ={F1, . . . , Fk}
of servers to applications (Fi: (S→A)), and a
correspond-ing utility function U, find a mapping Fi ∈ F such that
U(Fi) =max{U(F1), . . . , U(Fk)}. In other words, find the
allocation of resources that maximises resource utilisation.
2 4 6 8 10 12 14 16 18 20
4 8
16 32
64 128
256 512
1024 2048
1 100000 1e+10 1e+15 1e+20 1e+25 1e+30 1e+35 1e+40 1e+45 1e+50
Possible Configurations
Applications
[image:3.612.346.523.71.237.2]Servers
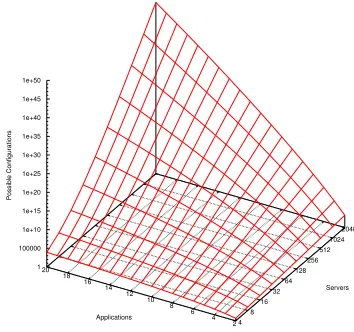
Figure 1. Possible server allocations
The DRA problem can be formalised as follows: Let xji
be an allocation of serverjto applicationi. We wish to max-imise U(x1
1, . . . , xMN)subject to the following constraints:
xji =
0, Serverj not allocated to applicationi.
1 Otherwise.
PM
j=1
PN
i=1x
j i ≤M
(Applications can not use more thanM servers)
xji 6=xjk, i6=k
(Two applications can not reside on the same server) This problem is an instance of binary integer programming problem, which is known to be NP-hard. Thus, exponential complexity is unavoidable. Greedy algorithms are typically used to solve approximations to NP-hard problems. The design of algorithms that approximates the DRA problem is normally of the form shown in Algorithm 1, whereby the algorithm examines all possible combinations of allocations and chooses the best allocation, based on its own metric, with the complexity of the algorithm beingO(MN).
To be suitable for data center scale resource allocation, an algorithm must account for scaling in two dimensions: (i) the number of servers and (ii) the number of applica-tions to be distributed across the servers. Much existing literature has focused on small number of servers, typically with two applications, meaning that little consideration has been given to scalability. However when the number of applications increases, the space of possible combinations increases dramatically. The number of combinations for a given number of servers, s, and applications,a, that wholly allocate all servers can be calculated using s+as−1. The graph in Figure 1 shows the number of combinations for up to 20 applications and 2048 servers.
To understand the rate at which the states could be exam-ined we developed a benchmark using the C programming language to iterate over the number of states. Testing this on a 2GHz AMD Opteron demonstrates that 1.2×10⁸ states
2 4 6 8 10 12 14 16 18 20
4 8
16 32
64 128
256 512
1024 2048
1 10 100 1000
Possible Configurations
Applications
[image:4.612.88.265.70.228.2]Servers
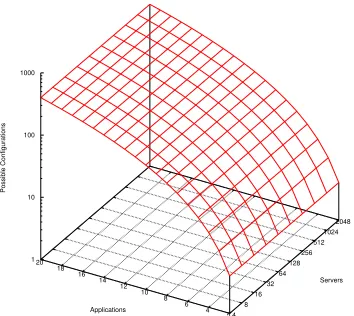
Figure 2. Heuristic framework scaling
Algorithm 1 General class algorithm
1: Leta, ..., zrepresent servers allocated to each application 2: LetSrepresent servers available
3: LetBrepresent best allocation
4: LetV represent the value of the best allocation 5: InitV, B
6: fora= 0;a≤S;a+ +do
7: forb=0;Pba≤S;b+ +do
8: . . .
9: forz=0;Pza≤S;z+ +do
10: value = metric(a, b, c...z)
11: ifvalue> V then
12: (a, . . . , z)→B
13: value→V
14: end if
15: end for
16: end for
17: end for
18: return B
algorithm to iterate over all possible allocations and select a configuration forms the lowest bound on the interval between allocations.
IV. A DEMANDBASEDAPPROACH
To address the exponential complexity illustrated in Sec-tion III, we now propose a template for the development of DRA algorithms suitable for the management of applications and resources at large-scale. The template utilises three dis-tinct phases: (i) the first phase is a preprocessing step done at system setup, (ii) the second phase requires knowledge of throughput of each application, and (iii) the third part runs periodically to reallocate servers to applications.
In the first stage, the applications are ranked in accordance with a pre-defined metric. We do not provide a specific metric here, as the framework aims to be adaptable, but suitable examples include business criticality, in the context of a single organisation, orSLAsin the context of a shared hosting provider. For the second stage, throughput may be measured through performance testing on hardware that is equivalent to that of the deployment target, performance modelling, or measured online at runtime. The accuracy of
Algorithm 2Improved scalability algorithm
1: LetNbe the number of applications 2: Leta1, ..., anbe ranked applications
3: Letm1, ..., mnbe minimum resource ofai
4: Lettabe the throughout of a server ofa
5: Letnabe number of servers allocated toa
6: LetIbe idle servers
7: fori= 1;i < N;i+ +do
8: p= predictedDemand(ai)
9: Si0= tp
a
10: ifSi0< Sithen
11: AppendSi−Si0servers toI
0
12: Si0→Si
13: end if
14: end for
15: fori= 1;i < N;i+ +do
16: ifSi6=Si0then
17: ifI0>0then
18: ifI0> S0
i−Sithen
19: MoveSi0−SifromI0toSi
20: break
21: else
22: Move all servers inI0toSi
23: end if
24: end if
25: forj=N;j > i+ 1;j− −do
26: ifS0i−Si≤Sj−mjthen
27: Move(S0
i−Si)fromSjtoSi
28: Break
29: else
30: Move(Sj−mj)fromSjtoSi
31: end if
32: end for
33: end if
34: end for
35: LetI=I0
the performance analysis undertaken will have an impact on the allocation of resources.
The periodic stage of the proposed framework is shown in Algorithm 2. Lines 6-13 reclaim resources from applications which are over provisioned for the next stage. Lines 14-32 allocate resources across applications which are under pro-visioned for the next period. Lines 16-21 allocate resources from the reclaimed servers if any are available. Lines 23-30 allocate resource from the lower ranked applications to higher ranks, subject to their minimum server allocation. Line 33 returns remaining idle servers. There are several options for servers which remain unallocated after all allo-cations have been made, and we do not specify any actions here. They may be allocated amongst applications either equally or by some weighted metric. Alternatively they may be switched into a low power mode, if the policy is aiming to minimise power consumption.
This framework provides a heuristic to solve the NP-hard allocation problem discussed in Section III. This approach is heuristic-based as (i) it relies on predicted demand to calculate the required resource to be provisioned, and (ii) a ranking of applications to guide resource allocation. We specify a ranking of applications to satisfy the requirements of the most important applications first, thus improving the best-case performance of the algorithm. The worst-case complexity of the framework is O(n2) when scaling the
number of applications. This algorithm is independent of the number of servers. Figure 2 shows the scalability of the framework across 20 applications and 2048 servers.
V. EXPERIMENTALSETUP
In our experiments we use applications with identical char-acteristics to limit external parameters. Each application is defined as serving four request types, with service durations of 15, 20, 45 and 110ms ,which represent proportions 0.45, 0.3, 0.2 and 0.05 of the requests respectively. The requests received for each application are distributed by a round robin scheduler to all servers dedicated to the application.
The server reallocation process is comprised of the fol-lowing steps. Firstly, the round robin scheduler server stops dispatching requests to the server being migrated. Next, the server completes all requests currently queued and the application is stopped on the server. The new application is then deployed to the server. Finally, the server is added to the scheduler and begins to service requests for its new application. The time for the un-deployment and deployment of an application is set at 30 seconds.
We also consider the impact of failed requests on the system. A request is considered to fail if the response time exceeds 60 seconds or it is rejected due full server queues. The queued request limit is set at 10000 requests per server. To define a policy using the proposed framework we con-sider the priority of our applications. Applications are ranked by their identifier such that Application 1 is ranked higher than Application 2. We also require resource performance knowledge. For our experiments the throughput of a single server is calculated as 73 requests per/sec in our simula-tion environment. In order to select a workload predicsimula-tion algorithm, we have evaluated several in the context of the 1998 World Cup web traffic data [14]. To select the best prediction algorithm we measure the busiest 24 hour period of June 30th 1998. We examine the following algorithms:
• A last observation approach uses the workload from the previous period as the predicted value for the next pe-riod. This works well in situations where the workload does not fluctuate significantly between periods. • A sample average considers the workload for the next
period to be the average of all periods observed. This works well where the workload is constant.
• A simple moving average calculates an average of the previous five periods to make a prediction. Older windows have no bearing on the prediction.
• An exponential moving average is similar to the simple moving average, but it weights the previous periods placing the most weight on the most recent period. In this test we have used five windows.
Table I
PREDICTIVEALGORITHMRESULTS
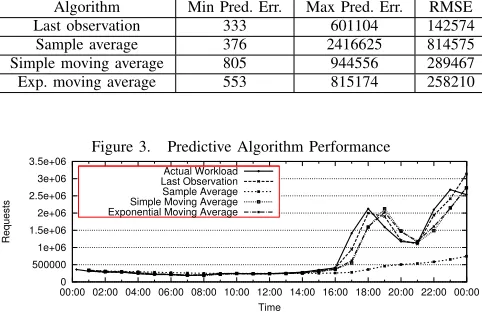
Algorithm Min Pred. Err. Max Pred. Err. RMSE
Last observation 333 601104 142574
Sample average 376 2416625 814575
Simple moving average 805 944556 289467
[image:5.612.316.557.115.276.2]Exp. moving average 553 815174 258210
Figure 3. Predictive Algorithm Performance
0 500000 1e+06 1.5e+06 2e+06 2.5e+06 3e+06 3.5e+06
00:00 02:00 04:00 06:00 08:00 10:00 12:00 14:00 16:00 18:00 20:00 22:00 00:00
Requests
Time Actual Workload Last Observation Sample Average Simple Moving Average Exponential Moving Average
The predictive performance of these algorithms is shown in Table I. The last observation algorithm yields the lowest absolute errors and the lowest RMSE. However, this algo-rithm is affected by large shifts in application workload. In practice this would mean that the underlying platform my reallocate servers more often. The exponential moving average provides a smoothed prediction of the workload, which allows for clear incremental changes in resource allocation which should remove the potential for significant resource migrations, thus the exponential moving average was chosen as the workload prediction algorithm.
A. Performance Experiments
To verify the effectiveness of our framework we now com-pare the performance of the example policy against a policy from the general class and a static resource allocation. The algorithm we have selected for comparison is the Average Flow Policy, which was derived in [7] and demonstrated practically in [1]. The algorithm is stated in algorithms 3 and 4. To avoid modification of the original algorithm, two applications are used for the performance comparison.
The workload used for the simulations is derived from the log files of the 1998 Football World Cup. The workload selected for each application is an 8 hour section from the 24 hour period. Application 1 is subject to a higher workload than Application 2; 56582546 requests versus 29208765. The time period selected for Application 1 is 16:00 until 24:00 while Application 2 uses requests issued between 12:00 and 20:00. The workload for Application 1 varies between 105 and 3816 requests per second while the workload for Application 2 varies between 202 and 3118 requests per second.
The number of servers used in this experiment is 64, which are initially distributed equally between the two applications. The period between executions of the DRA policies is 15 minutes.
Algorithm 3 Server Allocation
Require: Current server allocationS1, S2
Arrival Rates,λ1, λ2
Completion Rates,µ1, µ2
Queue Lengthsq1, q2
Switches in progressw1,2, w2,1
Switch Rater1,2, r2,1
Job costsc1, c2
Switch costssc1,2, sc2,1
Ensure: New server allocation,S0 1, S02
1: Lettc1, tc2 be total costs for each job queue
2: tc1, tc2←0
3: Letbdcbe best decision cost
4: bdc← ∞
5: ifµ1= 0andµ2= 0then
6: return error
7: end if
8: forsinS1do
9: tc1←Algorithm 4 (s, S, λ1, µ1, w2,1, r2,1, q1)
10: tc2←Algorithm 4 (s, S, λ2, µ2, w1,2, r1,2, q2)
11: if(c1×tc1+c2×tc2+sc1,2×s)< bdcthen
12: S10 ← −s
13: S20 ←s
14: end if
15: end for
16: forsinS2do
17: tc1←Algorithm 4 (s, S, λ1, µ1, w2,1, r2,1, q1)
18: tc2←Algorithm 4 (s, S, λ2, µ2, w1,2, r1,2, q2)
19: if(c1×tc1+c2×tc2+sc2,1×s)< bdcthen
20: S10 ←s
21: S0
2← −s
22: end if
23: end for
24: return S10, S02
been made will be distributed across applications propor-tionally by rank.
B. Scalability Experiments
For scalability experiments eight applications were dis-tributed across 64 servers, each of which was subject to a different workload. Applications were initially distributed evenly across servers. Workloads were synthetic, based on sine waves of varying frequency and amplitude, and are shown alongside the respective results in Figures 5 and 8. The workload durations in these experiments were 8 hours, and the periodic reallocation time is 15 minutes.
VI. RESULTS
A. Performance Results
In this section, we compare the performance of the policy derived from the proposed framework against that of the Average Flow Policy and a static allocation. We compare the results based on two criteria; (i) application response times and (ii) the number of requests serviced.
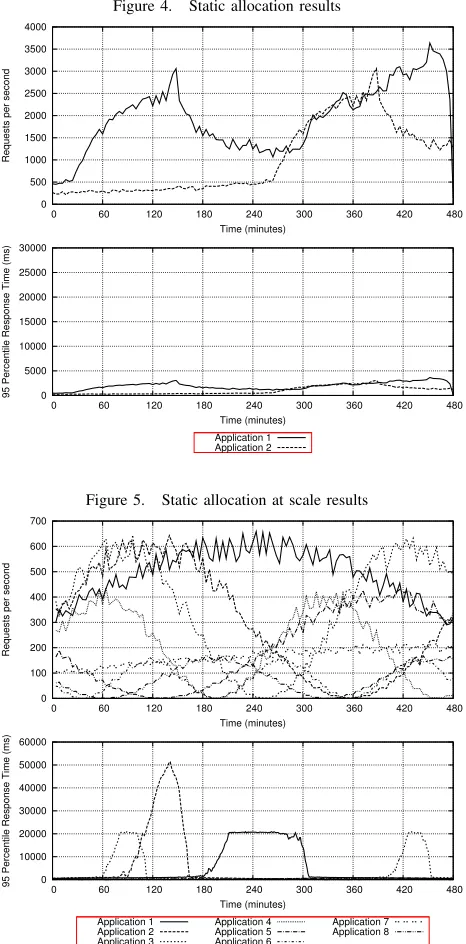
The top graphs in Figures 6 and 7 show the workload for each application, the middle graph shows the server allocations made for the duration of the experiment and the bottom graph gives the 95th percentile response time for each applications. Figure 4 omits the server allocation graph. From Figure 4, the static server allocation performs best, in terms of response time, as its response times never
Algorithm 4Total Cost Algorithm
Require:Switched serverss Server AllocationS Arrival rateλ Completion rateµ Switches in Progresswm,n
Switch raterm,n
Queue Lengthq
Ensure: Total Cost,tc
1: ifq >0then
2: ifλ < S−s+wm,n×µ1then
3: Letstbe an array of sizewm,n+ 1
4: foriinwm,ndo
5: sti←(w 1
m,n−i)×rm,n
6: end for
7: stwm,n← ∞
8: tc1= 0
9: Letvqbe the virtual queue length
10: vq←q
11: forjinwm,n+ 1do
12: ifvq >0then
13: Letxbe the rate at which the queue drains
14: x←vq+ (λ−(S−s+j)×µ)×stj
15: ifx≥0then
16: tc←tc+ 0.5×(vq+x)×stj
17: vq←x
18: else
19: tc←tc+ 0.5×λ−(S−s−+vqj)×µ×vq
20: vq←0
21: end if
22: end if
23: end for
24: else
25: tc← ∞
26: end if
27: else
28: tc←0
29: end if
30: return tc
exceed four seconds. The Average Flow Policy demonstrates the best results for the results for Application 1, but this improvement comes at the expense of the response time for Application 2. The response time at 325 minutes exceeds the 60 second timeout for the requests. From Figure 7,the framework derived policy delivers the worst response time for Application 1. However, this remains below the timeout threshold for the duration of the experiment. This policy also delivered intermediate results for Application 2, but, again, the response time remained below the threshold. Table II gives details of the request failures observed by each application under each policy.
The performance of the framework policy is guided by the mechanism used to predict workload. The exponential moving average uses the values observed from the 5 previous windows. Where the workload trend changes, for example Application 1 at 300 minutes, the predication does not capture the increase and the policy migrates servers away from Application 1, which is not the desired behaviour.
Figure 4. Static allocation results
0 500 1000 1500 2000 2500 3000 3500 4000
0 60 120 180 240 300 360 420 480
Requests per second
Time (minutes)
0 5000 10000 15000 20000 25000 30000
0 60 120 180 240 300 360 420 480
95 Percentile Response Time (ms)
Time (minutes)
Application 1 Application 2
Figure 5. Static allocation at scale results
0 100 200 300 400 500 600 700
0 60 120 180 240 300 360 420 480
Requests per second
Time (minutes)
0 10000 20000 30000 40000 50000 60000
0 60 120 180 240 300 360 420 480
95 Percentile Response Time (ms)
Time (minutes)
Application 1 Application 2 Application 3
Application 4 Application 5 Application 6
Application 7 Application 8
2. The framework policy delivers a failure rate of 2.93% for Application 1 and 5.28% for Application 2. The framework derived policy delivers the lowest overall failure rates from all three of the policies.
[image:7.612.64.293.78.309.2]In Section V it was stated that the priority of Application 1 was double that of Application 2. We use this to infer a cost for each allocation policy by considering request failures for Applications 1 and 2 to have an associated cost of 2 and 1 units respectively. We may then use this metric as a basis for comparison. The static allocation incurs a cost of 8,321,175, the cost of the Average Flow Policy is 18,321,675 and the cost of the framework derived policy is 4,861,395. Hence, the framework policy shows significant cost advantages.
Figure 6. Average flow policy results
0 500 1000 1500 2000 2500 3000 3500 4000
0 60 120 180 240 300 360 420 480
Requests per second
Time (minutes)
0 8 16 24 32 40 48 56 64
0 60 120 180 240 300 360 420 480
Servers
Time (minutes)
0 10000 20000 30000 40000 50000 60000
0 60 120 180 240 300 360 420 480
95 Percentile Response Time (ms)
Time (minutes)
Application 1 Application 2
Table II
REQUEST FAILURE PERCENTAGES UNDER PERFORMANCE EXPERIMENTS
Requests Static Alloc. Average Flow Framework
App.1 56582546 7.03 0 2.93
App.2 29208765 1.24 62.73 5.28
Total 85791311 5.06 21.36 3.73
B. Scalability Results
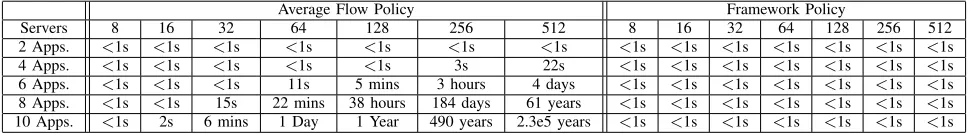
We now present a larger scale deployment of applications than the performance study. Table III shows the time taken for the Average Flow Policy and the Framework Policy to perform a switching decision. The times for the Average Flow Policy are derived from combining the size of the state space with a timed value for Algorithm 4.
The Average Flow Policy is currently designed for alloca-tion of servers between two applicaalloca-tions. To avoid modifica-tion of the original algorithm we shall not consider it under the scaling experiment parameters of 8 application across 64 servers. Table III shows that under these circumstances the policy would take 22 minutes to develop a new allocation. This exceeds the periodic allocation interval of 15 minutes. Thus the lowest possible bound for server reallocations is the decision time of the algorithm. We will exclude the Average Flow Policy from the evaluation of the Framework policy.
Table III
APPROXIMATE DECISION MAKING TIME PRIOR TO REALLOCATION
Average Flow Policy Framework Policy
Servers 8 16 32 64 128 256 512 8 16 32 64 128 256 512
2 Apps. <1s <1s <1s <1s <1s <1s <1s <1s <1s <1s <1s <1s <1s <1s
4 Apps. <1s <1s <1s <1s <1s 3s 22s <1s <1s <1s <1s <1s <1s <1s
6 Apps. <1s <1s <1s 11s 5 mins 3 hours 4 days <1s <1s <1s <1s <1s <1s <1s
8 Apps. <1s <1s 15s 22 mins 38 hours 184 days 61 years <1s <1s <1s <1s <1s <1s <1s
[image:8.612.64.549.99.166.2]10 Apps. <1s 2s 6 mins 1 Day 1 Year 490 years 2.3e5 years <1s <1s <1s <1s <1s <1s <1s
Figure 7. Framework policy results
0 500 1000 1500 2000 2500 3000 3500 4000
0 60 120 180 240 300 360 420 480
Requests per second
Time (minutes)
0 8 16 24 32 40 48 56 64
0 60 120 180 240 300 360 420 480
Servers
Time (minutes)
0 10000 20000 30000 40000 50000 60000
0 60 120 180 240 300 360 420 480
95 Percentile Response Time (ms)
Time (minutes)
Application 1 Application 2
from a static allocation. The static allocation exhibits more variation in response time than the dynamic policy. The performance of the framework policy is shown in Figure 8. It is clear that the dynamic resource allocation is beneficial to the response time of the applications, as the highest 95th percentile result is 20 seconds.
The failures delivered by the system with a large number of applications is reduced by 21% over the static allocation by the derived policy. However, the distribution of failures is also significant. The failure results for both allocation schemes can be seen in Table IV. The static server allocation delivers a zero failure rate for Applications 4-8. The failure rate for Application 8 under the Framework Policy is 1.99% which is due to migration of servers from this application to applications with higher priorities. In this case the static allocation outperforms the policy as the application is over
provisioned for the duration of the experiment. A statically allocated Application 1 is under provisioned at points in the experiment which causes request failures that do not occur when the policy is used. If we consider the cost of failed requests to be inversely proportional to the ranking of the application, then the static allocation costs 440,128 while the policy results cost only 59,181. The policy yields a 7-fold reduction in the the cost of failed requests.
VII. CONCLUSION ANDFUTUREWORK
In this paper, we have shown that the DRA problem is NP-hard, and demonstrated that the scalability of a general class of resource allocation algorithms is unsuitable for use in a modern data center. In response to this we have proposed a framework for the development of DRAs with improved scalability. Further, we also developed an instance of the framework and compared its performance against that of the general class for a real-world workload to demonstrate the scalability of the proposed resource allocation framework.
The work presented in this paper focuses on homogenous systems. In future work we will extend this to incorporate heterogeneous environments, which will require consider-ation of asymmetric migrconsider-ation costs and variconsider-ations in ap-plication performance across resources. Further, in order to develop an improved understanding of the DRA algorithm scalability, the notion of switching cost will be explored in greater depth than was permissable in this paper.
REFERENCES
[1] A. Chester, J. Xue, L. He, and S. Jarvis, “A system for dynamic server allocation in application server clusters,” in Proc. International Symposium on Parallel and Distributed Processing with Applications, December 2008, pp. 130–139.
[2] J. Williams, “Avoiding the cnn moment,” IT Professional, vol. 3, no. 2, pp. 68–72, April 2001.
[3] R. W. Kembel, Fibre Channel: A Comprehensive Introduc-tion. Northwest Learning Associates, November 2000.
[4] J. Xue, A. Chester, L. He, and S. Jarvis, “Dynamic resource allocation in enterprise systems,” inProceedings of the 14th International Conference on Parallel and Distributed Systems, December 2008, pp. 203–212.
Figure 8. Results for framework derived policy at large-scale
0 100 200 300 400 500 600 700
0 60 120 180 240 300 360 420 480
Requests per second
Time (minutes)
0 8 16 24
0 60 120 180 240 300 360 420 480
Servers
Time (minutes)
0 10000 20000 30000 40000 50000 60000
0 60 120 180 240 300 360 420 480
95 Percentile Response Time (ms)
Time (minutes) Application 1
Application 2 Application 3Application 4 Application 5Application 6 Application 7Application 8
Table IV
REQUEST FAILURES UNDER SCALABILITY EXPERIMENTS
Static Policy Framework Policy
Requests Successful Failed Failures (%) Successful Failed Failure Rate (%)
App.1 14168988 14127937 41051 0.29 14168988 0 0
App.2 8672845 8669653 3192 0.04 8672845 0 0
App.3 10490296 10475400 14896 0.14 10488530 1766 0.02
App.4 6082631 6082631 0 0 6081776 855 0.01
App.5 5629034 5629034 0 0 5629034 0 0
App.6 2159599 2159599 0 0 2159340 259 0.01
App.7 4744868 4744868 0 0 4744868 0 0
App.8 2186604 2186604 0 0 2143071 43533 1.99
Total 54134865 54075726 59139 0.11 54088452 46413 0.09
[6] L. He, W. J. Xue, and S. A. Jarvis, “Partition-based profit optimisation for multi-class requests in clusters of servers,” inProc. International Conference on e-Business Engineering, October 2007, pp. 131–138.
[7] J. Slegers, I. Mitriani, and N. Thomas, “Evaluating the opti-mal server allocation policy for clusters with on/off sources,” Journal of Performance Evaluation, vol. 66, no. 8, pp. 453– 467, August 2009.
[8] J. S. Chase, D. E. Irwin, L. E. Grit, J. D. Moore, and S. E. Sprenkle, “Dynamic virtual clusters in a grid site manager,” inProceedings of the 12th International Symposium on High Performance Distributed Computing, June 2003, pp. 90–100.
[9] B. Urgaonkar and A. Chandra, “Dynamic provisioning of multi-tier internet applications,” in Proceedings of the 2nd International Conference on Autonomic Computing, Septem-ber 2005, pp. 217–228.
[10] B. Urgaonkar, G. Pacifi, P. Shenoy, M. Spreitzer, and A. Tantawi, “An analytical model for multi-tier internet services and its applications,” in Proceedings of the ACM
SIGMETRICS International Conference on Measurement and Modelling of Computer Systems, June 2005.
[11] Q. Zhang, L. Cherkasova, and E. Smirni, “A regression-based analytical model for dynamic resource provisioning of multi-tier applications,” in Proceedings of the 4th International Conference on Autonomic Computing, June 2007.
[12] X. Liu, J. Heo, and L.Sha, “Modeling 3-tiered web applica-tions,” in Proceedings of the 13th IEEE International Sym-posium on Modeling, Analysis, and Simulation of Computer and Telecommunication Systems, May 2005, pp. 307 – 310.
[13] A. Chandra, W. Gong, and P. Shenoy, “Dynamic resource allocation for shared data centers using online measurements,” inProceedings of the ACM SIGMETRICS International Con-ference on the Measurement and Modeling of Computer Systems, June 2003, pp. 300–301.