<TITLE>
<Author>
<FACULTY/DEPARTMENT <CHAIR>
EXAMINATION COMMITTEE
<Member of the committee>
DOCUMENT NUMBER
<DEPARTMENT> - <NUMBER>
<DATE>
DEMONSTRATION BASED TRAINING
FOR PRESENTATION DESIGN.
A case study to design online training and
evaluate its effects.
NICKY SATIA MEIJER
Master thesis for Educational Science and Technology (EST)
Supervisors:
2/66
This master thesis was conducted as the final assessment for the master degree Educational Science and Technology (EST) at University of Twente in the Netherlands.
3/66
Table of contents
Acknowledgement ... 5
Abstract ... 6
1. Introduction ... 7
1.1 Problem statement ... 7
1.2 Research design ... 8
1.3 Scientific relevance ... 8
2. Analysis phase ... 9
2.1 Analyses of practice ... 9
2.1.1 Stakeholders needs analysis ... 9
2.1.2 Exploratory target audience needs analysis ... 10
2.1.3 Task analysis ... 11
2.1.4 View of the learning environment ... 14
2.2 Analyses of theory ... 15
2.2.1 Background on designing slideshows for presentations ... 15
2.2.3 Attitude towards (learning to) create slideshows for presentation ... 17
2.2.4 Instructional design for learning from video ... 18
2.3 Research questions ... 19
3. Design phase ... 20
3.1 Demonstration Based Training (DBT) model ... 20
3.2 Training design ... 21
3.2.1 Instructional features to facilitate attention processes ... 21
3.2.2 Instructional features to facilitate retention processes. ... 21
3.2.3 Instructional features to facilitate production processes ... 22
3.3.4 Instructional features to facilitate motivation processes ... 22
3.3 Construction of training ... 23
4. Evaluation phase ... 27
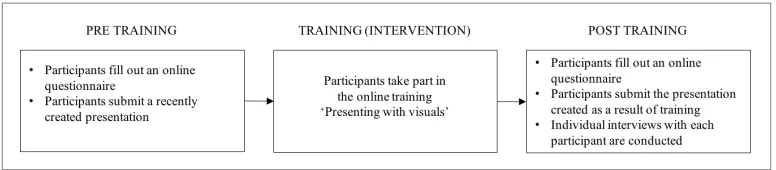
4.1 Evaluation design ... 27
4.1.1 Procedure ... 27
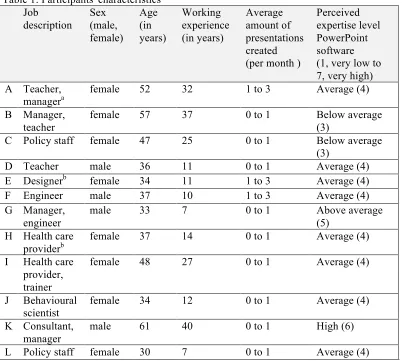
4.1.2 Sample ... 27
4.1.3 Instruments ... 28
4.1.4 Data analysis ... 33
4.2 Evaluation results ... 34
4.2.1 Effect on motivation ... 34
4.2.2 Illustrations from interviews of the effect of training on motivation ... 35
4.2.3 Effect on task performance ... 38
5. Discussion and conclusion ... 40
5.1 Discussion of the findings ... 40
5.1.1 Findings for question 1: “How to design online training, using instructional video, in which professionals learn to create slideshows for oral presentations, based on the existing offline training ‘Presenting with visuals’ by GriDD?” ... 40
5.1.2 Findings for question 2: “What are the effects of the online training ‘Presenting with visuals’ on the motivation of professionals to create effective, visual slideshows for oral presentations?” ... 40
5.1.3 Findings for question 3: “What are the effects of the online training ‘Presenting with visuals’ on the task performance of professionals to create effective, visual slideshows for oral presentations?” ... 41
5.2 Limitations of the study ... 42
5.3 Recommendations for future research ... 42
4/66
5.3.2 Define more visual design guidelines for presentations ... 43
5.3.2 Further development of the presentation checklist ... 43
5.4 Conclusion ... 44
References ... 45
Appendices ... 51
Appendix A: Stakeholder Needs Analysis Question Guide (in Dutch) ... 51
Appendix B: Target Audience Needs Analysis Interview Guide (in Dutch) ... 52
Appendix C: Communication With (Potential) Participants... 53
Appendix D: Demographic Questionnaire (in Dutch) ... 54
Appendix E: CANE Questionnaire (In Dutch) ... 55
Appendix F: Interview Topic Guide (in Dutch) ... 57
Appendix G: Adaptation Process Presentation Checklist ... 59
Appendix I: Presentation Checklist ... 60
Figure 1: Generic model for educational design research (McKenney & Reeves, 2014) ... 8
Figure 2: Visual thinking introduction in existing training ... 12
Figure 3: Overview of the five step plan in existing training ... 12
Figure 4: Example used in Step 1 in existing training ... 13
Figure 5: Worked example used in Step 1 in existing training ... 13
Figure 6: Drawing exercise in existing training ... 13
Figure 7: Assignment in existing training ... 13
Figure 8: QRC as handout after existing training (page 1) ... 14
Figure 9: Splintt learning environment, version 3, 2014 ... 15
Figure 10: Model of Demonstration-Based Training ... 20
Figure 11: Overview of constructed training ... 24
Figure 12: Organizer and summaries in animation video ... 24
Figure 13: Organizer and summaries in text on screen ... 24
Figure 14: On-screen coach with animation ... 25
Figure 15: Sketched animation for instructional narrative ... 25
Figure 16: Humour in opening video ... 25
Figure 17: Action & reaction demonstrated in screencast ... 25
Figure 18: Worked example (assignment) for practice ... 25
Figure 19: Fully worked example ... 26
Figure 20: Process sheet, self-reflection questions ... 26
Figure 21: Evaluation procedure ... 27
Table 1: Participants' characteristics ... 28
Table 2: Items and reliability CANE Questionnaire ... 30
Table 3: Excerpt of Presentation Checklist Instrument ... 32
Table 4: Grade for the online training ... 34
Table 5: Results of statistical analysis for the effect of training on motivation ... 34
Table 6: Results for Effectiveness Value sub scale ... 35
5/66
Acknowledgement
When I started my studies the field of learning and instruction had my interest, and now I am sure that being an instructional designer is a part of me for life. However, this master thesis marks the end of an era for me: the end of being a student. The road to the completion of the thesis was a bumpy one, but I have learnt much along the way. The most important lesson is that when you are doing something difficult, there are so many people willing to help when you ask (and even when you don’t). In this preface, I would like to take the opportunity to thank all of them.
First of all, I owe a lot of thanks to my supervisor Hans van der Meij. He gave me confidence in my abilities when I needed it and always provided sharp, constructive and fair feedback. Thanks also to the second supervisor, Henny Leemkuil, for taking the time to read the thesis and suggesting ways to make it better. And thanks to the participants in the study for their time and cooperation and to the professionals at Splintt for their collaboration and help.
Furthermore, I would really like to thank my colleagues at GriDD, in particular my external supervisor Mark, Jeroen and Marjolijn, for all their support in finishing the study and thesis. Applying for an internship at GriDD was one of the best decisions I have ever made.
Also, it would have been infinitely harder to finish this thesis without my wonderful friends and family, who listened to my troubles, cheered me on and let me stay with them in Enschede or Wierden when needed. My parents are in their own category to that respect. Without them, I would not be where and who I am today. They have always believed in me, told me everything was possible and are simply the best parents one could wish for. Their passion for education and learning inspires me and has taught me to work hard while doing what you love. Finally, I want and need to thank Roel, who is my rock, my love. For putting up with me and always making me laugh.
6/66
Abstract
The client for this study, GriDD Consultancy B.V., saw a rising need for professionals to be able to create effective, visual presentations. They created face-to face training years ago but were interested to offer training online using instructional video and to objectively evaluate learning effects. The purpose of this study was therefore to design online training in which the creation of slideshows for oral presentations is taught to professionals using instructional video, and to evaluate its effects. The study is design-based, fits a pragmatic paradigm and uses mixed methods for this exploratory descriptive case study.
Training was designed and constructed using a Demonstration-Based Training approach enhanced with context-specific instructional features and based on analyses from practice and theory. Evaluation of training focused on its effects on motivation and task performance. No effect of training on motivation could be concluded from statistical analyses. A large significant effect of training was found for participants’ overall increase of performance of the task to create effective, visual
presentations. Additionally, a large significant effect was found for increased adherence to four cognitive communication principles related to task performance.
Theoretical implications for this study are its addition to the knowledge base on applying DBT approach to construct training and building further on the accessibility of a presentation design instrument to gain insight into one’s ability to create effective, visual presentations. Practically, the client for the study has gained effective online training to add to their list of services.
7/66
1.
Introduction
Lots of slide-assisted presentations are created on a daily basis; a frequently used estimate circling the internet speaks of more than 350 presentations per second (Parks, 2012). In this day and age, many professionals have created presentations in a business setting. Often people use Microsoft PowerPoint software to create their slides. Business presentations are used for many purposes, for instance to inform, persuade, propose a plan, explain a program, solicit input or motivate an audience (Yates & Orlikowski, 2007). Strong presentations can have very positive effects on the audience: they can lead to good recall and comprehension of information (Garner & Alley, 2013), positive credibility of the speaker (Levasseur & Kanan Sawyer, 2006) and audience engagement (Savoy, Proctor, & Salvendy, 2009). The need to be able to create effective presentations has become common practice and an expected, important skill in the workplace.
Unfortunately, criticism concerning PowerPoint presentations is very common as well. Almost everyone has multiple examples in mind of irrelevant, incomprehensible, long or boring presentations they sat through. Weak presentations can have a negative impact on the information processing of audience members (Tangen et al., 2011) and can lead to bad decision making (Tufte, 2003).
This criticism and the need for good presentations does not just follow from theory, but was also recognized in practice by the consultants at GriDD Consultancy B.V. (from now on referred to as GriDD), a consultancy agency based in the Netherlands. They see a rising need to develop the ability to create more effective presentations in many of their clients. Years ago, GriDD added support for presentation issues as one of the services the company provides and now they aim to improve their level of service. The company serves as a client for this design based master thesis.
1.1 Problem statement
GriDD was founded in 2008 and consists of ten professionals. Their mission is described as follows: “GriDD thinks of practical innovative concepts for effective information. The GriDD team is made up of pragmatic professionals, specialists as interface between the person, information and digital
means.”(GriDD, 2015). The organization offers services in the fields of user experience and digital tactics, human centred process design and effective content and storytelling. They mainly work in a business-to-business (B2B) setting, which means products, information and services are aimed at other businesses rather than at consumers. GriDD’s clientele consists mostly of large corporations and organizations in which the consultants work with educated professionals in middle management. The organisation focuses on knowledge driven organizations with complex information problems. GriDD aims to assist anyone who wants to use information more effectively to reach (business) goals.
In their way of working GriDD believes in the power of using visualization to communicate information effectively. In their experience, using visuals to explain information in optimal
combination with text, ensures better understanding, comprehension and recall. This is reflected in their meetings, where they both write and draw on a whiteboard, and of course in their presentations, which contain more visuals than text to support their story.
GriDD’s clients often use slideshows for oral presentations to communicate and share (complex) information and ideas to others. Most of them use default company or PowerPoint templates to create their presentations. Consultants at GriDD regularly heard clients speak of not being understood, information from their presentations being forgotten or having difficulties with creating presentations to fit their purposes. To help their clients with issues concerning presentation design and creation, GriDD developed training called ‘Presenting with visuals (original name in Dutch: ‘Presenteren met beeld). Training usually takes place in small groups either at the office or at the clients’ office location. The existing training received positive reactions from clients, but required a lot of planning to gather trainees and a qualified trainer present at a certain time and location. Additionally, training was never evaluated for learning effects so GriDD does not know whether their method is in fact objectively effective.
8/66
instructional video, for explanation.
1.2 Research design
The purpose of this study is to design online training in which the creation of slideshows for oral presentations is taught using instructional video, based on the content of GriDD’s existing offline training and aimed at their (potential) clients and to evaluate its effects.
The research is design-based and an exploratory descriptive case study in nature: the objective is to gain and describe insights into a specific training design and its effectiveness. These insights could be used to improve the training design and possibly advance educational practice.
The research model used is the generic model for educational design research by McKenney and Reeves (2014) is used (See Figure 1). This model describes essential components and is built based on their surveys and analyses of other existing models and frameworks. The model offers a systematic way of working for educational design research toward practical application and theoretical understanding.
This study fits a pragmatic research paradigm, which emphasises practical application of theory, workability in research and actual behaviour to determine effectiveness in which results count (Mertens, 2014).
Figure 1: Generic model for educational design research (McKenney & Reeves, 2014) In this thesis, all of the components of the research model are discussed in chapters. The exploration and analysis phase is described in chapter two. At its conclusion, research questions for the study are stated. In the third chapter both the theoretical basis for design and construction of training is described. The fourth chapter evaluates the constructed training in an empirical setting. The discussion and conclusion on theoretical understanding and maturing the intervention are found in the fifth and final chapter.
1.3 Scientific relevance
A body of research can be found on presentation slide design (e.g. Garner & Alley, 2013; Kosslyn, Kievit, Russell, and Shephard, 2012; Tangen et al., 2011) and there are relevant sources that provide guidelines on presentation creation (e.g. Duarte, 2008), but little can be found in terms of empirical research into effective training for this subject. Also, to the researcher’s knowledge, the
9/66
2.
Analysis phase
In the analysis phase the problem is further explored (McKenney & Reeves, 2014). First it is explored from a practical perspective and then from a theoretical perspective, resulting in the research
questions for this study.
2.1 Analyses of practice
In both in the analysis and instructional design phase, the researcher worked in close collaboration with the managing partner from GriDD, a subject matter expert and developer of the existing training (from now on referred to as SME). Apart from him, other experts or people from the target audience are consulted as well. Active participation and collaboration with experts and practitioners increases the relevance and practicality of the intervention (Van den Akker, 1999).
A summary of main guidelines follows from each analysis for instructional design and
content. These will be taken into account in the design and construction of training. The guidelines are numbered for easy reference.
2.1.1 Stakeholders needs analysis
Semi-structured interviews with three consultants at GriDD were used to gain a deeper understanding of the company’s needs concerning the design of online training.
Since GriDD does not have its own platform for online training, the organisation sought out partnership with Splintt. This organization offers their clients total solutions in the field of online learning programs and states: “It is our mission to ensure learning in a safe, efficient and practical way. Even better when we can mix it with a bit of fun.” (Splintt, 2016). The GriDD online training will be offered on their online learning platform and the organization will invest expertise and resources in the online training for GriDD. Therefore, Splintt’s expertise and possibilities and limitations of this learning environment should be taken into account and a manager from Splintt has answered five open questions on their company’s needs for training.
See Appendix A for the instrument used to interview the stakeholders: the Stakeholders Needs Analysis Questions Guide. Summaries of the main results are used to describe goals, design requirements and target audience characteristics for this online training in this paragraph.
Goals for online training The main goals of training are:
- Training should teach professionals to create effective, visual PowerPoint presentations to support oral speeches (from now on referred to as: effective, visual presentations) using the method from GriDD’s existing training ‘Presenting with visuals’. This refers to the
development of knowledge and skills: learners should be able to create effective, visual presentations. The focus of content in the online training should be on story architecture and slide design. Training should also be aimed at teaching learners the added value of visually rich presentations, which requires a change in attitude and leads to the second main goal.
- Training should be motivating to learn and create effective, visual presentations
Training teaches both the procedure and the reasoning behind the procedure. Learners should see the added value of training and be motivated to learn and apply what they have learnt. To illustrate, phrases provided by people from GriDD to describe how they would like learners to respond to training were: “Totally cool, I can work with this!” and “Wow, I would like to learn more about this”.
Design requirements
Apart from its main goal, other important traits for the online training were mentioned as well. These are grouped into the following requirements:
- Training should be a good experience for learners
10/66
be clear and accessible. It should use instructional video and visualizations appropriately, with a preference for multiple short videos instead of one longer video. Active training elements should be the majority of online training.
- Training should position GriDD as expert in this field
One of the reasons for creating the online training is to position GriDD’s field of expertise to a wider audience and share knowledge with the community. Therefore, it is important that the online training is recognizable as a GriDD product in ‘look’ and ‘feel’. With regard to the GriDD ‘look’, suggestions such as appropriate use of the GriDD name, referring to GriDD as source and proper branding were mentioned. The following words were used to describe the GriDD ‘feel’: professional, competent, informal, modern, dynamic, fun, fresh and light. Target audience characteristics
When asked about the target audience for the training, all consultants agreed that it should consist of (potential) clients for GriDD. These are described as educated professionals who work knowledge intensive organization and regularly create and use slideshows for oral presentations at work to communicate. Specifically, they are said to be professionals who want to achieve a (business) goal using slide-assisted presentations, for instance when they need to explain complex information (such as policy makers, engineers or consultants), have a (line) responsibility which requires them to argue decisions (such as managers or project leaders) or to need convey a specific message (such as sales people or evangelists). Also, they are said to be driven, critical, motivated to learn, fluent in Dutch and only satisfied when price, quality and impact of training align.
Guidelines for training design following from stakeholders needs analysis Training should:
1. teach professionals to create effective, visual PowerPoint presentations to support oral speeches using the method from GriDD’s existing training ‘Presenting with visuals’. 2. be motivating to learn and create effective, visual presentations.
3. be a good experience for learners. 4. position GriDD as expert in this field.
5. be aimed at (potential) clients for GriDD: educated professionals who work in knowledge intensive organization and regularly create and use slideshows for oral presentations at work. 2.1.2 Exploratory target audience needs analysis
The target audience for training was defined in the stakeholders needs analysis. To gain insights into their knowledge (needs) on the subject of presentation design and needs pertaining instructional video, an explorative analysis was performed by interviewing three clients of GriDD who fall within the target audience description. Interviewees were asked about the current situation and issues concerning creating presentations. Since video instruction will be used in training, they were also asked about their requirements for learning from video. See Appendix B for the questions asked in the Target Audience Needs Analysis Interview Guide. A summary of the main findings from the analysis is provided in this paragraph.
Current situation: trainee characteristics and goals
The clients who were interviewed state that many professionals in organisations create presentations; both managers and people on the work floor. They state everyone should be able to create a good presentation. The younger generation said to be more adept than older generations, for they grew up using the current technology and design principles. They are said to have more of a balance between the data to show and the story to tell, while the older generation is more used to lectures.
Interviewees state there are different expectations for different people. Managers are stated to give presentations for people outside of the organisation such as the surrounding ecosystem (e.g. stakeholders, clients). Presentations aimed at the surrounding ecosystem are under more scrutiny and they should have a clear storyline, be to the point and spot on, according to the interviewees.
11/66
presentations, lower quality is more acceptable.
People are said to have their own style of presenting. Most often, interviewees state the goal is to share knowledge and for everyone involved to be up to date. The focus is on subject matter; visuals are used in the form of screenshots are used to show work for instance. One of the interviewees says that: “Presentations are aimed at ‘showing people the plumbing and sharing complex information related to projects”.
Issues concerning creating presentations
Presenting is said to be a combination of content, form and personality by the interviewees. One of them states that often one or more of these variables is not of acceptable quality. Another says that weak presentations have no clear beginning or ending and the slides do not match the message. All of the interviewees that often there is no point to the message, presentations are given for the sake of presenting instead of having a clear goal. One of the interviewees stat that people just want to convey too much information, and that often presentations could be a lot shorter. Also, weak presentations are stated to be the ones that do not trigger understanding or do not challenge or support the audience. A interviewee added that in international settings, language can be a barrier for understanding.
It is stated by all interviewees that presenters should be able to convey the message short and to the point, but they know that creating a presentation that is to the point can be difficult. An
interviewee mentions that preparation makes a big difference, for instance thinking about the target audience and the goal of training. It is stated to be important the presenter knows what to convey and why. For the audience the goal should be as clear as it is to the presenter and there should be plenty of time to convey the message with room for questions.
Little text and lots of visuals are considered good practice by the interviewees. People are said to tend to use presentations created by others, which means bullet lists or text on slides are used to keep grip on the story, which is not always right for the audience. Too much text is not considered good in presentations, but too little text is also not great.
Requirements for the use of video for learning
Most of all interviewees agree that instructional video should be highly relevant. The information should be directly applicable to the work environment. It is stated that the benefits of watching instructional video should be clear and the message should come across logically. An interviewee states that when videos are boring or too long, people would stop watching. Multiple, short videos are stated to be preferred over longer videos. A reason given is because this provides more control over when, where and which videos to watch. Video should be fun, humorous, easily accessible, use lots of examples and show how things work or what effects are, according to the interviewees. A good storyline is considered to be very important.
Guidelines for training design following from exploratory target audience needs analysis Training should:
6. aim to teach learners with divergent learning needs (for example, younger versus older generation learners).
7. teach learners to define a goal for their presentation.
8. teach learners to create a presentation with a clear beginning and ending. 9. teach learners to create presentations that are short and to the point. 10. teach learners that preparation for a presentation is important. 11. teach learners to create balanced and appropriately designed slides. 12. use highly relevant videos in which benefits and the message are clear. 13. use short video(s).
14. use fun, humorous and easily accessible video in which examples are used. 2.1.3 Task analysis
12/66
For the analysis, a structure of knowledge technique is used: the technique emphasises the relation between the execution of the learning task and the way separate task elements are being taught (Plomp, Feteris, Pieters, & Tomic, 1992). Since the new online training ought to be based on the existing face-to-face training, the developer of the GriDD method was asked to reconstruct the training for the researcher. In an unstructured interview with the SME, the existing training procedure and content were discussed using a presentation and other documents used in training. Additionally, he was asked what essential key concepts ought to be included in the new online training. Insights from these analyses are described in the following sections to form a description of the existing GriDD training and key concepts for new training.
Since participation in training will become a part of the services GriDD offers for a fee, it is not possible to describe its content in details this thesis. For scientific, non-commercial ends readers can request more information on the method used in the original training, but in this thesis the description is limited to the general steps and the manner in which they are taught (e.g. explained from a slide, good example provided etc.)
Description of the existing GriDD training
The existing training ‘Presenting with visuals’ takes place in a group setting with one trainer. The training is flexible in duration, depending on delivery. Sometimes clients want just the explanation of the procedure, in which case the trainer uses a PowerPoint presentation to explain the method. Training lasts about one hour in this lecture setting.
Other clients want trainees to be active in training, then the PowerPoint presentation is used to explain the method after which learners actively work on creating an effective, visual presentation according to the explanation, in a workshop setting. In this workshop setting, training lasts about three hours.
Introduction
Training starts with a presentation in which the method to create effective, visual presentations is explained. A short introduction into the benefits of visual thinking is
provided, supported with a slide in the presentation (see Figure 2). Visual thinking is defined as ‘visually
supporting the thinking process in order be more effective’. It creates clarity in order to gain or capture insights for oneself or with others. In reference to presentations it refers to using appropriate visuals, so your audience understands you. The aim is not just aesthetic value, but to ease understanding and emphasise the story. Slides support the oral story. The idea is that using visuals in this manner, is the rationale behind creating effective, visual
presentations.
Next, the trainer asks about the learners’
experiences with presentations and introduces frequently stated issues: boring, uninspiring presentations which mostly consist of text in which a logical structure or storyline is lacking. The introduction ends with an overview of what will be discussed in training. Body
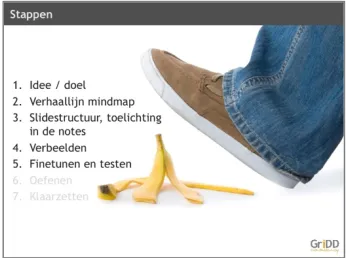
[image:12.595.354.525.387.513.2]The body of training consists of GriDD’s method: a five step plan to creating effective, visual presentations (See Figure 3). Steps can be seen as a sub task for executing the task of creating an effective, visual slideshow for oral presentation. Walking through these steps helps trainees to not slip up when creating presentations. Each step is explained using examples (See Figure 4 for an illustration),
Figure 2: Visual thinking introduction in existing training
[image:12.595.353.526.584.713.2]13/66
first the task is described followed by a worked out example of the task (See Figure 5 for an illustration).
The first step is to determine idea and goal for the presentation. Knowing why and for whom to present is seen as essential for a good presentation. This task is facilitated with a table listing questions to be answered by the participant.
The second step concerns creating a storyline: creating a mind map with all the information that make up the story of the presentation. Mind mapping is explained and steps to take to create a mind map are provided. Additionally, tips & tricks on how to create mind maps are provided.
The third step is to create a storyline structure in slides. First, it is explained how a story can be structured. Attention is focused on the procedure; how to relate (information from) the mind map to the slides. Gathering information and structuring this logically is shown as an essential part of creating an effective, visual presentation since it forms the basis for the visuals.
The fourth step is to visually support the text on the slides. The procedure is shown to use the appropriate visual for the story. The trainer explains which visuals are
appropriate for a certain goal and that these can be used both realistically and as a metaphor. Visuals refer to photos or illustrations, video, graphs, models and tables However, short text and short bullet lists could be included as well for specific reasons. Additionally, the trainer provides the learners with their own information design guidelines: Consistency, Colour, Contrast, Calligraphy and Pattern (CCCCP). He describes why these are important and how to apply the guidelines. To close, he mentions the importance of using copyright free visuals presentations, so as to not use visuals illegally.
The fifth and final step refers to fine-tuning the presentation. There is a need to test and refine the presentation. The trainer mentions why fine-tuning and practice is important and provides an example of how to do this.
Conclusion
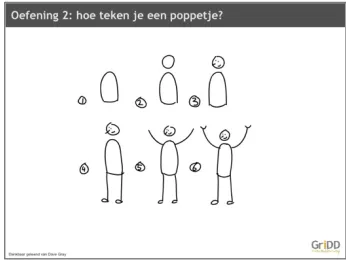
In closing the trainer switches to a related subject: visualising by drawing. Daring to draw is related to creating an effective, visual presentation according to the training, because it teaches you to visualize the way you want. The trainer challenges learners to draw using simple exercises (See Figure 6). This provides a ‘break’ for learners who, at this point, have been listening for a while or as a start of the workshop.
[image:13.595.353.526.72.205.2]After the exercise, the training may introduce an assignment. The assignment states to use the GriDD method to create a slide for a presentation of your own, as
[image:13.595.353.525.243.371.2]Figure 4: Example used in Step 1 in existing training
Figure 5: Worked example used in Step 1 in existing training
Figure 7: Assignment in existing training
[image:13.595.352.525.422.553.2] [image:13.595.352.526.610.742.2]14/66
an example of how you could do this for a real presentation (see Figure 7). Learners are assigned a limited amount of time.
After the drawing exercise, the trainer shares some of this own methods and tools which learners could look up in case they are interested to learn more. An overview of related topics taught by GriDD in similar training is also provided; on the spectrum the training ‘Presenting with visuals’ is shown to teach the basics. To wrap up, the trainer emphasises the rationale of training again.
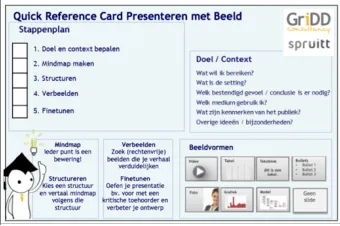
The learners receive a Quick Reference Card (QRC) for Presentation Design, an A6 format laminated card with the key insights from training (See Figure 8). Learners can use it as reference for the next time they create a presentation. Key concepts to be taught in the new, online training
Since existing training is offline and face-to-face, there are lots of opportunities to adapt its contents to the audience. The new online training aims to use video which is pre-recorded and means there are more limitations. In this section learning goals and key concepts are described, following from the interview with the SME and what he deems to be essential and less essential.
The first key concept in training is that learners know why to create effective, visual presentations. This means the rationale behind training, presentation will be better received and understood, when appropriate visuals are used in slides to convey a structured story, is understood.
The other key concept is that learners know how to create effective, visual presentations. All steps in GriDD’s five step method are assumed to be equally important to include in the new training, even though existing training seems to focus less on the fifth step (fine-tuning). For the steps it is both required that learners know why a step is important and learners are able to execute the step to create effective, visual presentations.
In the SME’s experience, it seems the workshop setting (in which trainees perform an assignment) is more effective than the lecture setting (in which trainees do not preform an
assignment). Therefore, it is key that instructional video is accompanied by active learning elements. Less essential information taught in training are the tips & tricks on mind mapping,
structuring and visualisation. Also, the drawing exercise is not essential to the learning task. Other topics, which are taught in other training at GriDD, are not essential to learning but mentioning them is desirable for sales and marketing purposes. Good and bad examples are often appreciated by the learners for reference but are not considered essential knowledge.
Guidelines for training design following from task analysis Training should:
15. teach learners the rationale behind creating effective, visual presentations.
16. teach learners how to create effective visual presentation using GriDD’s five step method: define goal & context, create a mind map, structure the story, visualize slides, fine-tune the presentation.
17. teach learners the rationale and execution method for each step in GriDD’s five step method 18. provide both instructional video and active learning elements.
19. provide tips & tricks fro mind mapping, structuring and visualization. 20. provide examples of presentation design for reference.
21. mention other topics for which training is available at GriDD. 2.1.4 View of the learning environment
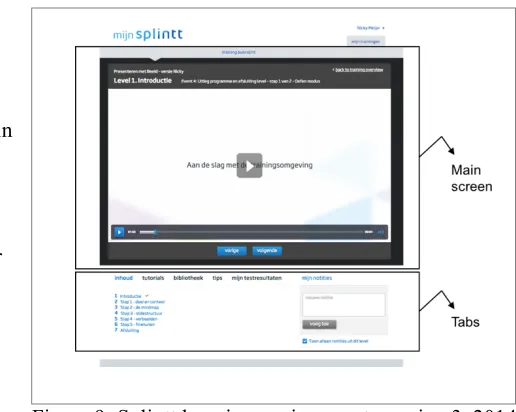
[image:14.595.354.524.74.187.2]The new online training ‘Presenting with visuals’ will be part of the e-learning platform by Splintt (See Figure 9). The organisation’s e-learning platforms are always in development, this section describes key elements of the learning environment used in this study, which is version 3 from 2014.
15/66
Training consists of one or more Levels. These are comparable with chapters in a book. Every Level consists of one or more Events, comparable to paragraphs in a book. Every Event consist of one or more Steps, comparable to the rest of the content in a book. A Step can contain video, audio or text.
The most dominating feature in the learning environment is the ‘main screen’, a large rectangle area in which video, audio or text is displayed (the aforementioned ‘Steps’). Users can navigate by clicking ‘vorige’ (previous) or ‘volgende’ (next); the blue buttons beneath the screen.
Below the main screen, tabs are shown where users can see an overview of training (‘inhoud’), find extra videos
(‘tutorials’), find documents relating to training (‘library’), find tips in the form of text (‘tips’), find test results (‘mijn testresultaten) and write notes (‘mijn notities’). These notes remain within the learning environment; they cannot be downloaded by the user.
Guidelines for training design following from a view of the learning environment Training:
22. should consist of Levels, Events and Steps in the learning environment.
23. should be designed so the main learning route can be accessed in and navigated through the main screen in the learning environment.
24. could provide additional material (text, documents, audio, video) in the tabs of the learning environment.
2.2 Analyses of theory
Apart from the practical perspective and guidelines, the concepts in this study are also explored from a theoretical perspective, to help define research questions. First, background is provided on designing slides for presentations. Then aspects of good presentation design are provided, followed by insights into attitude towards (learning to) create slideshows for presentations and ending with instructional design considerations.
2.2.1 Background on designing slideshows for presentations
In order to understand what constitutes a good presentation, it is important to provide some
background into the critique presentations have received over the years. The most common argument found that presentations hinder instead of enhance to cognitive information processing (e.g. Tufte, 2003; Garner, Alley, Gaudelli & Zappe, 2009; Kosslyn et al., 2012). Some background information on cognitive processing is provided to better understand why supporting these processes is important, then issues concerning slide design are explored to see how these processes are hindered.
Cognitive information processing
Cognitive processing relates to the way the human brain processes information it receives in terms of memory, perception and comprehension. One’s working memory is used for current processing of information and is assumed to have limited capacity to process a certain amount of information at a time. Baddeley and Hitch (1974) proposed a working memory theory consisting of three elements: the visual spatial sketchpad to store visual information, the phonological loop stores verbal auditory information and the central executive, the attentional controller. In a later version, the episodic buffer was added to the model and is assumed to be a limited capacity temporary storage system which integrates information and moves it in and out of long term memory (Baddeley, 2000).
[image:15.595.267.525.77.283.2]16/66
and store information in long term memory and to reduce working memory load (Sweller, Van Merrienboer, & Paas, 1998). Schema creation is described by them as an active process that can be influenced (helped or hindered) by the way information is delivered, presented or perceived. For instance, the slides used during a presentation can help or hinder the way your audience processes the information. Kosslyn et al. (2012, p.17) state that when “(..) presentation taxes information
processing, the audience members will have difficulty perceiving, remembering, or comprehending it”.
Issues concerning slideshow design for presentations
Several potential reasons for why presentations might violate cognitive information processing can be found in literature. Tufte (2003, p16) is a vocal critic of presentation design and his view, the popular software Microsoft PowerPoint has added greatly to current issues: “PP [PowerPoint] has a
distinctive, definite, well-enforced, and widely-practiced cognitive style that is contrary to serious thinking.”. According to the same article, presentations stand or fall with the quality of the content, and the hierarchical and linear default slide design format hurts content rather than enhances it. However, this software is widely used: a study by Thielsch and Perabo (2012) under 1014 participants, shows a strong preference for using Microsoft PowerPoint to use in order to create computer-based presentations. Garner et al. (2009) empirically found that common practice slides are heavily influenced by PowerPoint’s default styles and that these do not follow cognitive principles. They state that common practice slides hide connections between informational elements, contain too much text and do not contain images that promote optimal comprehension and retention.
Others (e.g. Shwom & Keller, 2003; Doumont, 2005; Kosslyn, 2007) have stated that it is not (just) the software that is to blame, but the people creating the presentations who do not ask
themselves for whom and why they are presenting. In their response to Tufte’s (2003) article, Shwom and Keller (2003, p.2) wrote: “(…) a bad PowerPoint presentation is a symptom of the writer’s failure to employ simple slide design principles, basic communication skills, and -most importantly-
fundamental rhetorical techniques.”
Another reason for weak presentations can be found in the twofold function of PowerPoint slides in organizations. Slides can be used to support oral presentations but also as documents to communicate ideas in the organization or project documentation (Yates & Orlikowski, 2007;
Schoeneborn, 2013). Slides for oral presentations are meant to be used to support a spoken story and slides as a document are meant to provide stand alone information, both a different cognitive
information design approach (e.g. the latter requires a greater amount of content to explain). This duality in function can become problematic when the same slides are used for both functions, which is therefore discouraged (Doumot, 2005; Duarte, 2008; Reynolds, 2008).
2.2.2 Aspects of effective slideshow creation for presentations for this study
Building on this background information on cognitive information processing and issues concerning the creation of slides, this paragraph states what is considered influential for effective presentation design in this study.
The method GriDD employs and on which the online training will be based, is largely influenced by popular books on the subject of presentation design. Duarte (2008) states in her
‘slide:ology’ approach that presenters should create ideas, not slides. In her book Duarte (2008) states that presenters should treat their audience as king and presentations as vehicles to spread ideas, cultivate relationships and design -not decorate- slides, in order to help the audience see what you are saying. In his ‘Presentation Zen’ approach Reynolds (2008) proposes three phases to presentation design: preparation, design and delivery. The delivery phase concerns actually giving the
presentation, states a few guidelines but is otherwise given the least attention. In the first phase creativity is important and presenters should plan analogously (away from the computer) questioning themselves around the key question ‘what is your main point and why does it matter’, after which they craft a story using brainstorming and storyboarding methods. When it comes to designing, Reynolds (2008, p.122) states it is important to make sure slides have a high signal-to-noise ratio: “the ratio of relevant to irrelevant elements or information in a slide or other display”. He also promotes the use of visuals in presentations, for he states these are remembered better than words.
17/66
in his multimedia learning theory that people learn better from word and pictures than from words alone. Multimedia learning theory builds on the assumption of limited working memory capacity and how to help information processing for learning. He formulated several cognitive multimedia
principles, such as the ‘coherence principle’ which states that people learn better when extraneous words, pictures and sounds are excluded rather than included (Mayer, 2001).
A very comprehensive overview of guidelines founded in research is provided by Kosslyn (2007) and Kosslyn et al. (2012). Kosslyn (2007) provides three goals that define effective
presentations: connecting with your audience, directing and holding attention and promoting understanding. Kosslyn et al. (2012) formulate eight comprehensive cognitive communication principles related to these goals and the information processing operations of encoding, working memory and accessing long term memory:
- Principle of Appropriate Knowledge: Communication requiring prior knowledge of pertinent concepts, jargon, and symbols.
- Principle of Discriminability: Two properties (such as two colors, degrees of gray, or sizes) cannot convey different information unless they differ by a large enough proportion to be easily distinguished.
- Principle of Compatibility: A message is easiest to understand if its form is compatible with its meaning.
- Principle of Limited Capacity: People have a limited capacity to retain and to process information and will not understand a message if too much information must be retained or processed.
- Principle of Informative Change: People expect changes in perceptual properties to carry information, and expect every necessary piece of information to be conveyed by such a perceptible change.
- Principle of Perceptual Organization: People automatically organize elements into groups, which they then attend to and remember.
- Principle of Salience states: Attention is drawn to large perceptible differences.
- Principle of Relevance: Communication is most effective when neither too much nor too little information is presented.
In their study, combining and building on relevant research on psychological processes, Kosslyn et al. (2012) have formulated specific rules for presentation design relating these principles, specifically aimed at slideshows for oral presentation. Apart from the eight cognitive principles they distinguish, Kosslyn et al. (2012) also include an ‘Over-Determined’ principle in which items are stated that relate to more than cognitive principle at the same time.
In this study, the ability to create effective, visual slides for oral presentations, is referred to as task performance. Good task performance is defined as a high level of adherence to the nine cognitive communication principles stated by Kosslyn et al. (2012).
2.2.3 Attitude towards (learning to) create slideshows for presentation
To create slideshows in a dissimilar way to how one has been doing it before, requires a change of mind set concerning the approach to what constitutes an effective presentation for professionals. This not always easily implemented as Nathans-Kelly and Nicometo (2014, p 49) state: “Changing slide design inside an organization can also mean a fundamental shift in how engineers, technical experts, and others communicate with each other.” So, not only should training aim to improve slide design, a change in attitude towards the presentation creation method is needed in order for professionals to actually start creating more effective presentations in organizations.
18/66
motivation problems related to goal commitment.
Commitment to a task follows from learners’ personal agency and emotional state (Bandura (1997); Ford (1992)). The degree to which learners perceive they are able to execute a task is referred to as self-efficacy and together with learner’ perception of support for executing a task, forms
learners’ personal agency. Emotion plays a role in motivation since, for instance, negative feelings such as anxiety and stress can be interpreted as signs of failure (Pajares, 1997) and thus negatively influence commitment to learn or execute a task.
The other aspect of the model refers to the mental effort learners are willing to apply. People are motivated to spend effort on a task when they value its effectiveness. This builds on the
expectancy-value theory as described by Eccles and Wigfield (1995). When learners are interested in a task, find it important or see its utility, their motivation increases to learn or to apply what was learnt.
In this study, motivation is defined as the commitment and necessary effort applied to (learning to) create effective, visual presentation, for which, following from the CANE Model by Clark (1998), personal agency, emotion and effectiveness value are assumed to be influential. 2.2.4 Instructional design for learning from video
Online training offers many possibilities for multimedia learning. Instructional video has become of popular use in multimedia learning and would fit GriDD’s need to take a visual approach in training and the requirement of the use of instructional video. The interest in learning from video has
significantly increased in recent years (Giannakos, 2013). In a literature review, Berk (2009) found that there is an empirical foundation of the use of video for learning; to increase memory,
comprehension, understanding and deeper learning. An empirical study by Kay and Kletskin (2012), showed learners found video useful, easy to use, effective as a learning tool and helpful for
knowledge gain.
Support for the use of instructional video can also be found in multimedia learning theory which states that students learn better from words and pictures than from words alone (Mayer, 2001). It assumes meaningful learning involves cognitive processing by actively organizing and integrating incoming visual and auditory information. Mayer (2001) proposed multimedia learning principles which take the issues of limited capacity of working memory into account and can be used for effective instructional design. Building on this research, eight guidelines for the design of instructional video are provided in Van der Meij and Van der Meij (2013). They define practical guidelines such as to make tasks clear and simple and to keep videos short. In a later study, they found using instructional video, constructed according to these guidelines, resulted in significant learning gains compared to paper based instruction (Van der Meij & Van der Meij, 2014).
Video can be used to model desired knowledge, skills and/or attitudes, which makes it a form of demonstration (Grossman, Salas, Pavlas, & Rosen, 2013). When training relies for a large part on instructional video for learning, a demonstration-based raining approach can be used.
Demonstration-Based Training (DBT) is defined as ‘a strategy of training development and delivery involving the
systematic design and use of observational stimuli intended to develop specific knowledge, skills and attitudes in the learner” (Rosen et al., 2010, p.597).
Well-designed DBT focuses the quality of the demonstration (e.g. in person or in video) with instructional features; information provided to learners or activities learners are presented with in addition to demonstration (Rosen et al., 2010). Combining demonstration with situation appropriate instructional features is considered to enhance leaning efficacy and make it a highly flexible training technique (Grossman et al., 2013).
DBT is rooted in Bandura’s (1986) Social Cognitive Theory and therefore based on four interlinked processes: attention, retention, production and motivation. In attentional processes learners must actively process what they are observing to learn, in retention processes what is observed must be stored to affect future behaviour, in production processes the stored knowledge must be
reconverted into overt actions and in motivational processes the perceived consequences of
performing the observed behaviour must be favourable enough to strengthen the likelihood of future performance (Rosen et al., 2010 p. 598).
19/66
2.3 Research questions
Following from the previous sections and the aim of this research, three main research questions were formulated. The first relates to the design and construction of training:
1. How to design online training, using instructional video, in which professionals learn to create slideshows for oral presentations, based on the existing offline training ‘Presenting with visuals’ by GriDD?
To answer to this first question, the following topics are studied: a) instructional features to facilitate the learning processes (attention, retention, production, motivation) stated in the Demonstration Based Training model (Rosen, 2010; Grossman, 2013), b) construction of training based on these defined instructional features and the guidelines defined in the analyses of practice.
In the analysis from practice the two main goals for training were provided and these are studied in the evaluation; learners should be motivated and able to create effective, visual slideshows for oral presentations. Definitions for these concepts (motivation and task performance) were
provided in the analyses from theory. This results in the following questions:
2. What are the effects of the online training ‘Presenting with visuals’ on the motivation of professionals to create effective, visual slideshows for oral presentations?
To answer this second question, the following topics are studied: a) participants’ overall opinion of training, b) increase of overall motivation to (learn to) create effective, visual presentations post training compared to pre training and c) increase of personal agency, positive emotion and effectiveness value post training compared to pre training and d) participants’ statements about participation in training, in terms of personal agency, positive emotion and effectiveness value.
3. What are the effects of the online training ‘Presenting with visuals’ on the task performance of professionals to create effective, visual slideshows for oral presentations?
20/66
3.
Design phase
Literature study was performed to design instructional features following a Demonstration-Based Training approach and related to guidelines following from the analyses from practice. A pragmatic and collaborative approach was then taken towards construction of training, based on these
instructional features and guidelines from practice. The role of the researcher is to develop a product in collaboration (Visscher-Voerman, Gustafson, & Plomp, 1999). The SME from GriDD was the main collaborator for design. All instructional material was constructed by the researcher, building on existing material at GriDD and in agreement with and reviewed by the SME.
Two other experts collaborated as well. One of the e-learning specialists from the stakeholder organisation Splintt was consulted on the topics relating to the implementation in the e-learning platform and with regard to intermediate products, such as the scripts for the videos. She has multiple years working experience in that field and was very helpful in all matters. The last person involved was a video expert. He filmed and edited the videos for training and gave advice. In collaboration with these experts, training was constructed in iterative steps.
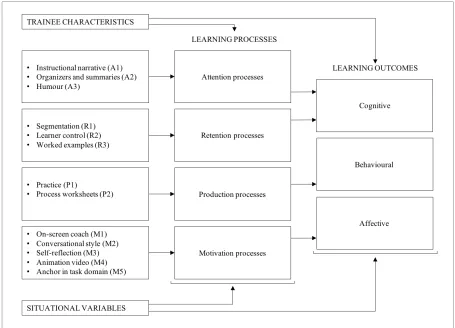
3.1 Demonstration Based Training (DBT) model
Grossman et al. (2013) present a theoretical DBT model in which instructional features, learning processes and outcomes are connected. An adapted version of this model used in this study is shown in Figure 10. Trainee characteristics are the features related to the target audience, such as experience creating presentations. Situational variables relate to the learning environment of training.
[image:20.595.72.527.409.737.2]The design and construction of instructional features to facilitate learning processes and outcomes are described in the following paragraphs. When an instructional feature is mentioned in this thesis, a reference number is provided related to the learning process the instructional feature is meant to facilitate, for instance ‘instructional narrative’ relates to attention processes and is referred to as ‘A1’. Related guidelines from practice are referred to with their number and short description.
21/66
3.2 Training design
3.2.1 Instructional features to facilitate attention processes
Instructional features designed to facilitate attention processes aim to ensure that learners attend to the appropriate information needed to reach their learning objectives (Grossman et al., 2013). A way to direct attention is the addition of an instructional narrative (A1). An instructional narrative is used to describe the reasoning behind and the utility of the instruction (Grossman et al., 2013). Smith and Ragan (1999) state that when it comes to learning attitudes, it is important to start with a persuasive message concerning the affective component: why is the demonstrated skill important? This structures the process of learning by focusing attention on critical aspects of performance (Rosen et al., 2010) and is preferably provided by a role model, a respected person who demonstrates the desired behaviour (Smith & Ragan, 1999). Inclusion of instructional narrative also matches guidelines from practice 2, 12, 15 and 17 which call to make the rationale behind training clear.
Another instructional feature is to add organizers andsummaries (A2). A summary is a brief description of the learning objectives of a demonstration and an organizer contains statements on what the instruction entails in terms already known to the learner (Grossman et al., 2013). In a study by Li (2012) a positive effect was found for the use of an advance organizer, introductory material to activate background knowledge, on learning outcomes. Adding organizers and summaries also provide overview therefore relating to guideline from practice 3, which states training should be clear and accessible.
The final attention strategy to discuss, is the use of humour (A3) to attend the learner to the material (Keller, 1987). This can refer to aspects such as making humorous analogies, telling jokes or just creating a light-hearted atmosphere that may make instruction more attractive to watch. Humour also relates to guideline from practice 14 which calls for fun and humour in video. However, it should be used carefully, since while appropriate humour is found to positively associate with student
learning, inappropriate forms of humour did not correlate with student learning and could even lead to directing attention the wrong way (Wanzer, Frymier, & Irwin, 2010).
3.2.2 Instructional features to facilitate retention processes.
Instructional features for retention aim to facilitate deep-level information processing (Grossman et al., 2013). An instructional measure to increase retention is segmentation (R1). When material is complex, demands of essential processing could overwhelm the learner (Mayer, 2008). The segmentation principle states that ‘learners understand multimedia explanation better when it is presented in learner-controlled segments rather than as continuous unit’ (Mayer & Moreno, 2003, p.47). With video this refers pacing options such as using start, stop and continue buttons to control video. And for instructional content is refers to presenting information in smaller segments.
Segmentation of multimedia instruction has been proven to facilitate basic (recall) and deep (application) knowledge acquisition (Lusk et al., 2009). Also, relating to segmentation, guidelines from practice 3, 13 and 22 call for (multiple) short videos and designing separate instruction elements.
Related to segmentation is the instructional feature of learner control (R2). Segmentation refers to instructor based segmentation and learner control to the level of freedom and decision making on the part of the learner on how learning is conducted. Instructional design should fit as much as possible the diverging needs and propensities of the intended audience (Van der Meij & Carroll, 1995). This also relates to guideline from practice 5 and 6. Providing learner control also incorporates guidelines from practice 23 and 24, which call for multiple learning routes within training. However, Kirschner, Sweller, and Clark (2006) state that guidance is still necessary for learners. It is important to state to allow learner control wisely and make sure balance control, structure and guidance (Salas, Tannenbaum, Kraiger, & Smith-Jentsch, 2012).
22/66
solving such problems in long term memory (Paas & Van Gog, 2006; Sweller & Cooper, 1985). Renkl (2011, p.272) states it is an appropriate instructional method, for instruction “should encourage learners to encode and interconnect both abstract concepts as well as abstract principles and concrete cases in which it is shown how this abstract knowledge is applied”. Also, good examples or ‘best practices’ let adult students know what they are doing compared to a known model (Cercone, 2008). Worked examples are also a way to incorporate guidelines from practice 14, 16, 17 and 20 related to teaching the execution of the learning task and use of examples.
3.2.3 Instructional features to facilitate production processes
Instructional features designed to facilitate production aim to provide opportunities in which
demonstrated behaviour can be applied (Grossman et al., 2013). The main instructional feature related to production is practice (P1). Support for this can be found in (Van der Meij & Van der Meij, 2016)who state that ‘the ultimate goal of observing a demonstration is for the user to be able to accomplish a task that is similar or related to the one demonstrated’.Practice opportunities should be appropriate for transfer of learning to the workplace (Salas et al., 2012). It is important for adult learners to link what they are learning with how this applies to their lives, so assignments should be relatable and preferably refer to real situations (Cercone, 2008). Also, creating practice opportunities in training can be considered an active learning element, which according to guidelines from practice 3 and 18 should be a large part of training.
To facilitate practice, another instructional feature can be applied: process worksheets (P2). Kirschner et al. (2006) name process worksheets as a good guided instruction measure, and it refers to a document providing problem solving phases of the task and/or hints that might help to complete a phase. Nadolski, Kirschner, and Merriënboer (2005) found that learners who were provided with this kind of guidance outperformed the ones who did not. Additionally, including process worksheets relates to guidelines from practice 19 and 24 whichstate additional information, not necessarily essential but beneficial to learning, could and should be provided.
3.3.4 Instructional features to facilitate motivation processes
Instructional features designed to facilitate motivation aim to encourage learners to acquire and apply the learning material (Grossman et al., 2013). Using social cues in instruction can influence
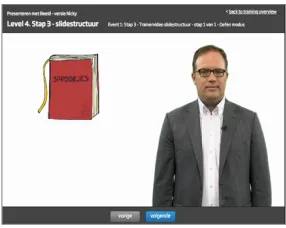
engagement and commitment to a task. When an instructional lesson “does not contain social cues, the learner does not feel engaged with the author and therefore will not work as hard to make sense of the material” (Clark & Mayer, 2008 p.163). One of the social cues distinguished, is the use of an on-screen coach (M1), in the form of real people using video and human voice or artificial characters using animation and computer voice. Homer, Plass, and Blake (2008) hypothesized that including a visible instructor in video could improve learner engagement. Support for this can be found in a study by Morain and Swarts (2012) who include picture-in-picture video of the narrator to heighten self-efficacy through identification, as an aspect of good instructional video. Kizilcec, Papadopoulos, and Sritanyaratana (2014) found that learners strongly preferred video instruction with a visible instructor to no instructor, and that they perceived this as more educational. An on-screen coach could provide an opportunity to comply with guideline from practice 4, which calls for positioning GriDD as an expert in the field, by using someone or something affiliated with the company as the on-screen coach.
Another social cue can lead to a sense of social partnership and improved learning, mentioned by Clark and Mayer (2008): using conversational style (M2) or polite wording in instructional
material. This means to favour using informal wording and speaking directly to the learner, over formal wording. It relates to guideline from practice 3, for it could make training more user friendly and accessible to learners.
To provide learners with opportunities an instructional feature to apply is self-reflection(M3). Self-reflection can be seen as a self-regulatory activity which maintain learners’ attention and keep them on task by encouraging self-monitoring of performance, comparison of progress to an end goal and adjustment of learning effort and strategy if appropriate (Salas et al., 2012). Prompting reflective questions at online training, for instance on how are they managing in the online course, should help adult learners focus their learning process and gain confidence (Cercone, 2008).
23/66
motivation. Animation is defined as ‘any application which generates a series of frames, so that each frame appears as an alteration of the previous one, and where the sequence of frames is determined either by the designer or the user’ (Bétrancourt & Tversky, 2000). Animation is found to develop higher motivation to learn science in terms of self-efficacy, interest and enjoyment, connection to daily life, and importance to their future compared to the control students according to Barak, Ashkar, and Dori (2011). This influences personal agency, for animation can be used to make abstract
concepts concrete thus improving understanding and improvement of perceived ability. Lee, Kazi, and Smith (2013) mention narrative animated sketches as a compelling new visual communication technique, drawing from sources stating sketches add personality, viewers of sketched drawing to be inclined to focus on high-level aspects instead of details. The role of animation video for increase of engagement relates it to guidelines from practice 3 and 14.
An instructional feature to influence the value of task effectiveness is to anchor the tool in the task domain (M5). This is one of the heuristics from user-centred design philosophy minimalism (Van der Meij & Carroll, 1995). When using video for demonstration of a procedure it is important to select meaningful training tasks: real tasks and components of instruction reflect the task structure. Other related heuristics to choose an action-oriented approach and support error recognition and recovery. In guideline from practice 12 this need for highly relevant video is also made apparent. When learning from demonstration, seeing the software used in video (in this case for instance PowerPoint) adds to its relevance and thus improves the motivation to spend mental effort. Screencasts can be very useful for this. They are defined as ‘capturing what you do on the computer screen with synced audio commentary’ (Lloyd & Robertson, 2012). Screencasts are stated to be attractive as a learning medium due to authenticity, multimedia affordances and a feeling of personal contact that they engender (Palaigeorgiou & Despotakis, 2010). Oehrli, Piacentine, Peters, and Nanamaker (2011) found in their study, as a good practice, that screencasts should be short (maximum of one or two minutes) but can be part of a sequence. Also, a good screencast should provide overview, describe a procedure, present a concept, elaborate on content, and focus attention (Sugar, Brown, & Luterbach, 2010). Van der Meij and Gellevij (2004) have formulated four components of a procedure (goal, action & reaction,
warnings and problem solving) with guidelines that can be used to design procedural screencasts.
3.3 Construction of training
In this paragraph the construction of training is described and shown, based on instructional features and guidelines from practice.
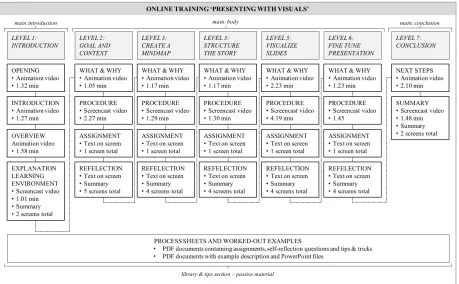
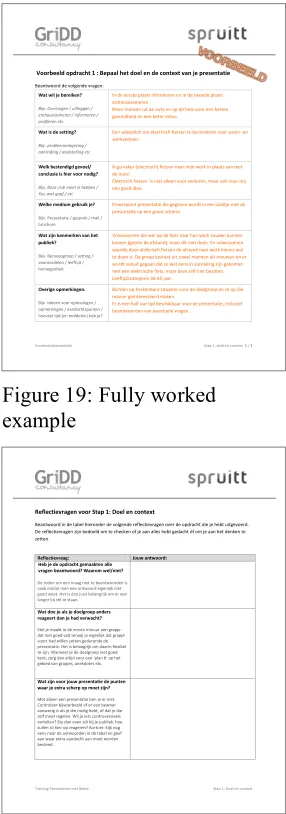
An overview of the instructional content of training is shown in Figure 11. Segmentation (R1) is applied and visible in Figure 11 in the overview of construction. Training consists of seven Levels: an Introduction Level (1) and a Conclusion Level (7) precede and conclude the body of training (Level 2 – 6). Levels consist of separate Events; instructional elements grouped under a Level. There are 26 Events in training. Sixteen Events are videos, nine animation videos (such as ‘what & why’ and seven screencast videos (such as ‘procedure’), with durations ranging from 1.05 minutes to 4.19 minutes. The learner is able to stop, play, fast forward and rewind each video. Other Events consist of text on screen, which can cover one (such as ‘assignment’) or multiple screens (such as ‘reflection’). The assignment displays the process of the worked example (R3) for that learning task and it was designed to be able to see the whole task at the same time, since steps are closely related. The
reflection contains self-reflection (M3) questions for the learner, designed in multiple screens because the questions are not closely related and separating them emphasises each individual question.