on Scalable Information Systems
Research Article
An Experimental Study with Tensor Flow for
Characteristic mining of Mathematical Formulae from a
Document
K.
N.
Brahmaji Rao
1,*,
G.
Srinivas
2and P.
V.
G.
D. Prasad Reddy
11Andhra University, Visakhapatnam, Andhra Pradesh, India 2ANITS, Visakhapatnam, Andhra Pradesh, India
Abstract
Through this article a deep learning technique is proposed for the extraction and classification of mathematical keywords from textual documents. Extraction of math keywords from textual data is predominant problem as textual documents contain a culmination of mathematical symbols and literals from natural language such as alphabets and words. Separation of these textual words embedded in the mathematical formulae is a complex task. Our proposed technique solves this critical problem of extracting mathematical keywords from textual documents using techniques such as stemming, tokenization and clustering mathematical keywords based on a training set of mathematical keyword and formulae pairs. The performance of the proposed technique is measured using the metrics such as retrieval time, Sensitivity, Accuracy, FPR, FNR, and FDR are used for appraisal of the proposed technique.
Received on 17 January 2019, accepted on 20 May 2019, published on 10 June 2019
Copyright © 2019 K. N. Brahmaji Rao et al., licensed to EAI. This is an open access article distributed under the terms of the Creative Commons Attribution licence (http://creativecommons.org/licenses/by/3.0/), which permits unlimited use, distribution and reproduction in any medium so long as the original work is properly cited.
doi: 10.4108/eai.10-6-2019.159097
*Corresponding author. Email:[email protected]
1. Introduction
TensorFlow is used for the high performance of numerical computation. It is an open source software library. It is flexible for simple deployment of computation across different platforms. It was developed by Google Brain team within Google’s AI organization. It is flexible for numerical computations used in many scientific fields and gives strong support for machine learning and deep learning.
Text can be classified as well as clustered by using Tensorflow. The chief advantage of Tensorflow is that it is a base documentation thatcan be used to generate Deep
Learning models directly. The text classification with Tensorflow will be separated into numerous segments.
The first segment deals the text pre-processing and formation of the container of words. Second segment trains the text classifier and finally performs the testing using the classifier [1,2,3,4,5,6,7,8].
1.1 Stemming
For example, after stemming following words “writing”, “written”, and “writer” ends up with their root word “write”.
1.2 Tokenization
The words in a sentence are called Tokens. Tokenization is a process of finding unique words in the text from a given piece of text.
Tokenization splits the sentence “C Programming Language” in to a set of token list [“C”, “Programming”, and “Language”] [4].
1.3 Bag of Words
The Bag of Words is the process of generating an exclusive list of words. It acts as a tool for characteristic generation.
2. Steps involved in the retrieval of Math
formulae with TensorFlow
2.1 Training the Data
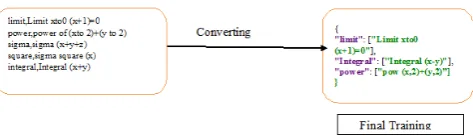
After the preparation of data, we have to train the model. In the proposed approach, we first take a CSV file which is a sample data. In the first column the file contains the entire formula notation and the second column contains related text for that. Likewise, we have to prepare huge data sample. After preparing the huge data sample the CSV file need to be converted in to JSON File by importing required python libraries [4].
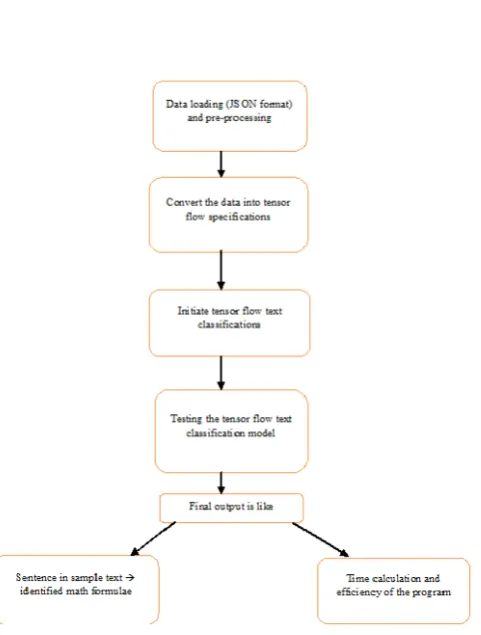
2.2 Loading and Pre-processing of Data
In this step, we load the attained JSON data that we have created for training. Let us presume that we have that json data stored in a file named “testdata.json”. After loading the data, we would have to perform some required operations called pre-processing for cleaning the data like elimination of bag of words, tokenizing, stemming etc. The exclusive stemmed words in all the sentences provided for training are placed in one list. The other list clutches the different categories. The “docs” list is the output of this step which includes the words from each sentence and which category the sentence fit in. The document is([“limit”, “x to 0”, “y to 0”], “sigma”) is an example [4].
2.3 Convert the processed data to
Tensorflow requirements and instigate
Tensorflow text categorization
After the above two steps the documents are in text form, a bag of words to be applied in order to translate the sentence in to numeric array. As Tensorflow being a math library accepts the data in the numeric form. A deep Neural Network is developed and used for the training of the proposed model. Now the categorization of Tensorflow text document is performed on documents in the right form [4].
2.4 Assessment of the Tensorflow
Categorization Model
After the completion of training, the text file should be loaded into our program and then parse every line in the text file with our neural network training model to check with how much accuracy the model retrieves math formulae.
During training, the model was able to correctly classify all the sentences. The accuracy and efficiency of retrieval depends on the size of the training document. For example primarily we train our model with 25 lines of text data and the testing is performed with a document contains 10 lines of text file and the accuracy is around 98%. In this model we also calculated the time for performing complete program and for the above document with 10 lines of text its takes around 18-20 milliseconds. Depending on the size of text sample the time and accuracy will increase [4].
CSV to JSON conversion
Figure 2. Training model and testing with text file
3. Experimental Analysis and
Results
For calculating the efficiency of the text document first the JSON file should be prepared for training. The JSON file is prepared from CSV file which contains more than 120 different formulae. Now the JSON format is loaded into our program to train the data. After training the data, some sample text files are loaded for checking the efficiency of program based on how the training sample identifies formulae in the text file. The efficiency of various sizes of test documents are matched with training document and the results are tabulated in tables 1-3[9, 10, 11, 12, 13, 14, 15 ,16 ,17].
3.1 Efficiency
Efficiency is measured as the number of formulae retrieved from the number of the number of formulae in the training document. The efficiency of the proposed math formulae retrieval system depends on the size of the training data. The efficiency is increased with increased number of math data in the training document.
Efficiency = (number of lines identified correctly/total number of lines)*100 (1)
Table 1. The above tabulated value represents overall Efficiency Measure with Tensorflow from a
document of 20 samples.
20 Number of
testing formulae Number of formulas retrieved
Total efficiency
Addition 19 95%
Combination 19 95%
Differentiation 20 100%
Exponential 18 90%
Factorial 19 95%
Integral 19 95%
Limit 20 100%
Permutation 18 90%
Sigma 16 80%
Square root 16 80%
Square 16 80%
Trigonometric 19 95%
Table 2. The above tabulated value represents Overall Efficiency Measure with Tensorflow from a
document of 40 samples.
40 Number of
testing formulae Number of formulas retrieved
Total efficiency
Addition 38 95%
Combination 39 97.5%
Differentiation 40 100%
Exponential 38 95%
Factorial 39 97.5%
Integral 39 97.5%
Limit 40 100%
Permutation 36 90%
Sigma 34 85%
Square root 36 90%
Square 34 85%
Trigonometric 38 95%
Table 3. The above tabulated value represents overall Efficiency Measure with Tensorflow from a
60 Number of
testing formulae Number of formulas retrieved
Total efficiency
Addition 58 96.7%
Combination 60 100%
Differentiation 60 100%
Exponential 59 98.3%
Factorial 59 98.3%
Integral 58 96.7%
Limit 60 100%
Permutation 58 96.7%
Sigma 56 100%
Square root 58 100%
Square 57 95%
Trigonometric 59 98.3%
From the above tables 1-3 the efficiency of math formulae retrieval with Tesorflow is measured and from the table it is concluded that the efficiency is more if number of samples increases. i.e. for example out of 20 lines of text file if the program identifies around 19 lines then efficiency of proposed model is 95%. The efficiency always depends on the size of training sample.
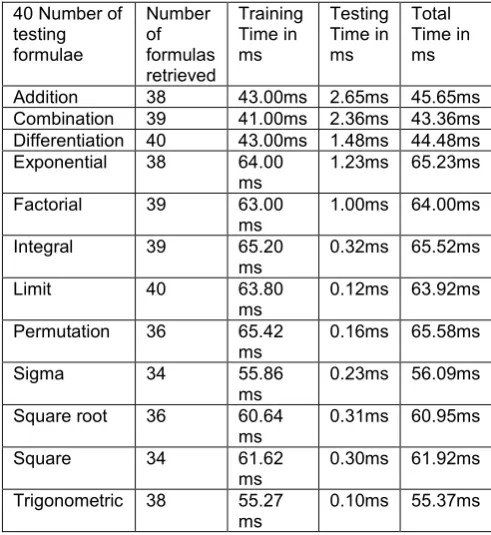
3.2 Time Analysis
We conducted quite a few experiments to calculate the time taken for preparing the training model and for testing with various sizes of sample text files. In our experimentation we prepared the training model with over 120 lines of text in JSON format. Now the sample text files contains more than 20 lines are tested with the training document and the output of the program obtained within 40-60 milliseconds of time with high accuracy. Note the time may vary from one computer to another depending upon the ram and computer specifications the time calculations for various sizes of testing formulae are accessible in table 4-6 [9, 10, 11] From the above tables 3-6 it is clear that the training time and testing time required gradually decreases as the number of formulae increases.
Table 4. The above tabulated value represents time taken for retrieving matched formulae with Tensorflow from a document of 20 samples along
with testing time and training time.
20 Number of testing formulae Number of formulas retrieved Training Time in ms Testing Time in ms Total Time in ms
Addition 19 41.00ms 1.33ms 42.33ms
Combination 19 41.00ms 0.43ms 41.43ms
Differentiation 20 41.00ms 0.48ms 41.48ms
Exponential 18 60.00
ms 1.23ms 61.23ms
Factorial 19 60.00 0.90ms 60.90ms
ms
Integral 19 63.20
ms 0.30ms 63.50ms
Limit 20 61.80
ms 0.09ms 61.89ms
Permutation 18 62.42
ms 0.06ms 62.48ms
Sigma 16 51.97
ms 0.13ms 52.10ms
Square root 16 58.54
ms 0.11ms 58.65ms
Square 16 58.40
ms 0.10ms 58.50ms
Trigonometric 19 51.07
ms 0.01ms 51.08ms
Table 5. The above tabulated value represents time taken for retrieving matched formulae with Tensorflow from a document of 40 samples along
with testing time and training time.
40 Number of testing formulae Number of formulas retrieved Training Time in ms Testing Time in ms Total Time in ms
Addition 38 43.00ms 2.65ms 45.65ms
Combination 39 41.00ms 2.36ms 43.36ms
Differentiation 40 43.00ms 1.48ms 44.48ms
Exponential 38 64.00
ms 1.23ms 65.23ms
Factorial 39 63.00
ms 1.00ms 64.00ms
Integral 39 65.20
ms 0.32ms 65.52ms
Limit 40 63.80
ms 0.12ms 63.92ms
Permutation 36 65.42
ms 0.16ms 65.58ms
Sigma 34 55.86
ms 0.23ms 56.09ms
Square root 36 60.64
ms 0.31ms 60.95ms
Square 34 61.62
ms 0.30ms 61.92ms
Trigonometric 38 55.27
ms 0.10ms 55.37ms
Table 6. The above tabulated value represents time taken for retrieving matched formulae with Tensorflow from a document of 60 samples along
with testing time and training time.
60 Number of testing formulae Number of formulas retrieved Training Time in ms Testing Time in ms Total Time in ms
Combination 60 41.15ms 2.41ms 43.56ms
Differentiation 60 43.22ms 1.61ms 44.83ms
Exponential 59 64.34ms 1.35ms 65.69ms
Factorial 59 63.41ms 1.12ms 64.53ms
Integral 58 65.27ms 0.32ms 65.59ms
Limit 60 64.01ms 0.12ms 64.13ms
Permutation 58 66.16ms 0.16ms 66.32ms
Sigma 56 56.01ms 0.23ms 56.24ms
Square root 58 60.77ms 0.31ms 61.08ms
Square 57 61.72ms 0.30ms 62.02ms
Trigonometric 59 55.34ms 0.10ms 55.44ms
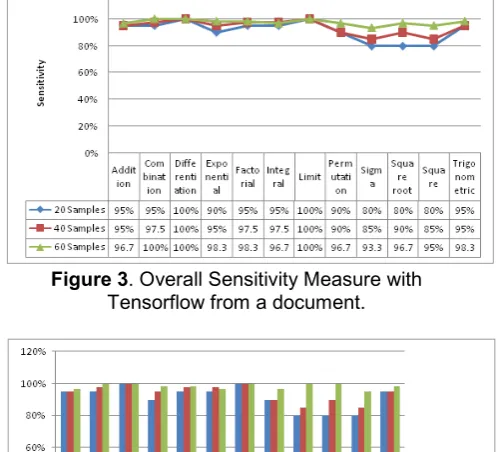
3.3 Sensitivity Measure
Sensitivity is used to measure the ratio of actual math keywords that are exactly matched with the training document from the text file, supplied as an input. The overall Sensitivity Measure with Tensorflow model is presented in tables 7-9 and from the tables it is obvious that with huge training data more number of matched math formulae from the text document will be retrieved results high sensitivity.
Sensitivity can be expressed as:
Sensitivity (S) = 𝑛𝑛(𝑇𝑇𝑇𝑇)
𝑛𝑛(𝑇𝑇𝑇𝑇)+𝑛𝑛(𝐹𝐹𝑛𝑛) (2)
Where,
n(Tp) = Number of True Positives n(Fn) = Number of False Negatives
Table 7. The above tabulated value represents overall Sensitivity Measure with Tensorflow from a
document of 20 samples.
20 Number of
testing formulae 𝒏𝒏(𝑻𝑻𝑻𝑻) 𝒏𝒏(𝑭𝑭𝒏𝒏) Sensitivity
Addition 19 1 95%
Combination 19 1 95%
Differentiation 20 0 100%
Exponential 18 2 90%
Factorial 19 1 95%
Integral 19 1 95%
Limit 20 0 100%
Permutation 18 2 90%
Sigma 16 4 80%
Square root 16 4 80%
Square 16 4 80%
Trigonometric 19 1 95%
Table 8. The above tabulated value represents overall Sensitivity Measure with Tensorflow from a
document of 40 samples.
40 Number of
testing formulae 𝒏𝒏(𝑻𝑻𝑻𝑻) 𝒏𝒏(𝑭𝑭𝒏𝒏) Sensitivity
Addition 38 2 95%
Combination 39 1 97.5%
Differentiation 40 0 100%
Exponential 38 2 95%
Factorial 39 1 97.5%
Integral 39 1 97.5%
Limit 40 0 100%
Permutation 36 4 90%
Sigma 34 6 85%
Square root 36 4 90%
Square 34 6 85%
Trigonometric 38 2 95%
Table 9. The above tabulated value represents overall Sensitivity Measure with Tensorflow from a
document of 60 samples.
60 Number of
testing formulae 𝒏𝒏(𝑻𝑻𝑻𝑻) 𝒏𝒏(𝑭𝑭𝒏𝒏) Sensitivity
Addition 58 2 96.7%
Combination 60 0 100%
Differentiation 60 0 100%
Exponential 59 1 98.3%
Factorial 59 1 98.3%
Integral 58 2 96.7%
Limit 60 0 100%
Permutation 58 2 96.7%
Sigma 56 4 93.3%
Square root 58 2 96.7%
Square 57 3 95%
Trigonometric 59 1 98.3%
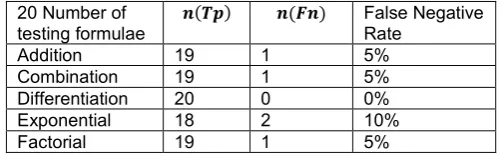
3.4 False Negative Rate
FNR is the number of Math formulae those responding negative on the test, means the formulae which are wrongly retrieved as obtainable in tables 10-12. The data in the tables illustrates that FNR value decrease with increase in the number of formulae in the text document.
FNR-False Negative Rate= n(Fn)/ n(Fn)+ n(Tp) (3)
Table 10. The above tabulated value represents overall FNR Measure with Tensorflow from a
document of 20 samples.
20 Number of
testing formulae 𝒏𝒏(𝑻𝑻𝑻𝑻) 𝒏𝒏(𝑭𝑭𝒏𝒏) False Negative Rate
Addition 19 1 5%
Combination 19 1 5%
Differentiation 20 0 0%
Exponential 18 2 10%
Integral 19 1 5%
Limit 20 0 0%
Permutation 18 2 10%
Sigma 16 4 20%
Square root 16 4 20%
Square 16 4 20%
Trigonometric 19 1 5%
Table 11. The above tabulated value represents overall FNR Measure with Tensorflow from a
document of 40 samples.
40 Number of
testing formulae 𝒏𝒏(𝑻𝑻𝑻𝑻) 𝒏𝒏(𝑭𝑭𝒏𝒏) False Negative Rate
Addition 38 2 5%
Combination 39 1 2.5%
Differentiation 40 0 0%
Exponential 38 2 5%
Factorial 39 1 2.5%
Integral 39 1 2.55%
Limit 40 0 0%
Permutation 36 4 10%
Sigma 34 6 15%
Square root 36 4 10%
Square 34 6 15%
Trigonometric 38 2 5%
Table 12. The above tabulated value represents overall FNR Measure with Tensorflow from a
document of 60 samples.
60 Number of
testing formulae 𝒏𝒏(𝑻𝑻𝑻𝑻) 𝒏𝒏(𝑭𝑭𝒏𝒏) False Negative Rate
Addition 58 2 3.33%
Combination 60 0 0%
Differentiation 60 0 0%
Exponential 59 1 1.66%
Factorial 59 1 1.66%
Integral 58 2 3.33%
Limit 60 0 0%
Permutation 58 2 3.33%
Sigma 56 4 6.67%
Square root 58 2 3.33%
Square 57 3 5%
Trigonometric 59 1 1.66%
3.5 False Positive Rate
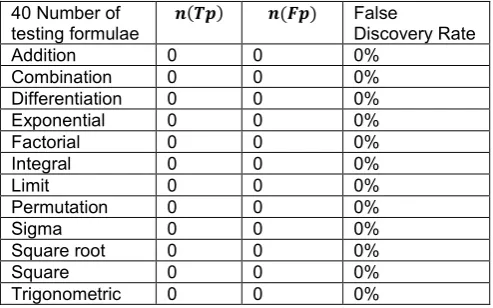
FPR is the number of Math formulae, those responding positive on the test, means the math formulae which are correctly retrieved from the test document which are available in the training document as shown in tables 13-15. The value FNR is mainly dependent on false positives. The number unwanted formulae retried with Tensorflow is almost zero as the procedure of retrieval of math formulae mainly depends on the training data.
FPR-False Positive Rate = n(Fp)/ n(Fp)+ n(Tn) (4)
Table 13. The above tabulated value represents overall FPR Measure with Tensorflow from a
document of 20 samples.
20 Number of
testing formulae 𝒏𝒏(𝑻𝑻𝒏𝒏) 𝒏𝒏(𝑭𝑭𝑻𝑻) False Positive Rate
Addition 0 0 0%
Combination 0 0 0%
Differentiation 0 0 0%
Exponential 0 0 0%
Factorial 0 0 0%
Integral 0 0 0%
Limit 0 0 0%
Permutation 0 0 0%
Sigma 0 0 0%
Square root 0 0 0%
Square 0 0 0%
Trigonometric 0 0 0%
Table 14. The above tabulated value represents overall FPR Measure with Tensorflow from a
document of 40 samples.
40 Number of
testing formulae 𝒏𝒏(𝑻𝑻𝑻𝑻) 𝒏𝒏(𝑭𝑭𝑻𝑻) False Discovery Rate
Addition 0 0 0%
Combination 0 0 0%
Differentiation 0 0 0%
Exponential 0 0 0%
Factorial 0 0 0%
Integral 0 0 0%
Limit 0 0 0%
Permutation 0 0 0%
Sigma 0 0 0%
Square root 0 0 0%
Square 0 0 0%
Trigonometric 0 0 0%
Table 15. The above tabulated value represents overall FPR Measure with Tensorflow from a
document of 60 samples.
60 Number of
testing formulae 𝒏𝒏(𝑻𝑻𝒏𝒏) 𝒏𝒏(𝑭𝑭𝑻𝑻) False Positive Rate
Addition 0 0 0%
Combination 0 0 0%
Differentiation 0 0 0%
Exponential 0 0 0%
Factorial 0 0 0%
Integral 0 0 0%
Limit 0 0 0%
Permutation 0 0 0%
Sigma 0 0 0%
Square root 0 0 0%
Square 0 0 0%
Trigonometric 0 0 0%
FDR is a much unfussy consideration. It is a ratio between the number of unwanted math formulae retrievals in a text document divided by total number of retrievals after comparison with training document and are accessible in tables 16-18. The value of FDR for different range of samples is 0% means no unwanted formulae are retrieved with proposed approach.
FDR - False Discovery Rate = n(Fp)/n(Fp)+ n(Tp) (5)
Table 16. The above tabulated value represents overall FDR Measure with Tensorflow from a
document of 20 samples.
20 Number of
testing formulae 𝒏𝒏(𝑻𝑻𝑻𝑻) 𝒏𝒏(𝑭𝑭𝑻𝑻) False Discovery Rate
Addition 19 0 0%
Combination 19 0 0%
Differentiation 20 0 0%
Exponential 18 0 0%
Factorial 19 0 0%
Integral 19 0 0%
Limit 20 0 0%
Permutation 18 0 0%
Sigma 16 0 0%
Square root 16 0 0%
Square 16 0 0%
Trigonometric 19 0 0%
Table 17. The above tabulated value represents overall FDR Measure with Tensorflow from a
document of 40 samples.
40 Number of
testing formulae 𝒏𝒏(𝑻𝑻𝑻𝑻) 𝒏𝒏(𝑭𝑭𝑻𝑻) False Discovery Rate
Addition 38 0 0%
Combination 39 0 0%
Differentiation 40 0 0%
Exponential 38 0 0%
Factorial 39 0 0%
Integral 39 0 0%
Limit 40 0 0%
Permutation 36 0 0%
Sigma 34 0 0%
Square root 36 0 0%
Square 34 0 0%
Trigonometric 38 0 0%
Table 18. The above tabulated value represents overall FDR Measure with Tensorflow from a
document of 60 samples.
60 Number of
testing formulae 𝒏𝒏(𝑻𝑻𝑻𝑻) 𝒏𝒏(𝑭𝑭𝑻𝑻) False Discovery Rate
Addition 58 0 0%
Combination 60 0 0%
Differentiation 60 0 0%
Exponential 59 0 0%
Factorial 59 0 0%
Integral 58 0 0%
Limit 60 0 0%
Permutation 58 0 0%
Sigma 56 0 0%
Square root 58 0 0%
Square 57 0 0%
Trigonometric 59 0 0%
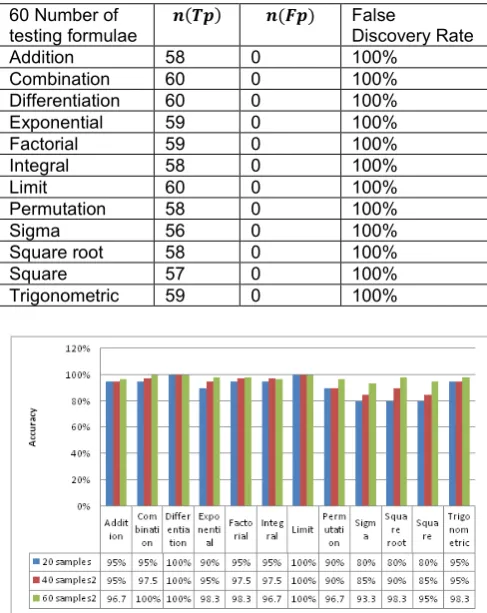
3.7 Accuracy
The accuracy of a test is its ability to categorize the retrieval of not needed and required math formulae acceptably. The accuracy can be calculated with the quantity of true positive and true negative in all assessed cases as shown in tables 19-21. The Accuracy of retrieval of math formulae increases with increase in number of samples.
Accuracy ACC = n(Tp)+n(Tn)/n(Tp)+n(Tn)+n(Fp)+n(Fn)
(6)
Table 19.The above tabulated value represents overall Accuracy Measure with Tensorflow from a
document of 20 samples.
20 Number of testing formulae
𝒏𝒏(𝑻𝑻𝑻𝑻) 𝒏𝒏(𝑭𝑭𝑻𝑻) 𝒏𝒏(𝑻𝑻𝒏𝒏) 𝒏𝒏(𝑭𝑭𝒏𝒏) Accuracy
Addition 19 0 0 1 95%
Combination 19 0 0 1 95%
Differentiation 20 0 0 0 100%
Exponential 18 0 0 2 90%
Factorial 19 0 0 1 95%
Integral 19 0 0 1 95%
Limit 20 0 0 0 100%
Permutation 18 0 0 2 90%
Sigma 16 0 0 4 80%
Square root 16 0 0 4 80%
Square 16 0 0 4 80%
Trigonometric 19 0 0 1 95%
Table 20. The above tabulated value represents overall Accuracy Measure with Tensorflow from a
document of 40 samples.
40 Number of testing formulae
𝒏𝒏(𝑻𝑻𝑻𝑻) 𝒏𝒏(𝑭𝑭𝑻𝑻) 𝒏𝒏(𝑻𝑻𝒏𝒏) 𝒏𝒏(𝑭𝑭𝒏𝒏) Accurac y
Addition 38 0 0 2 95%
Combination 39 0 0 1 97.5%
Differentiatio
n 40 0 0 0 100%
Exponential 38 0 0 2 95%
Factorial 39 0 0 1 97.5%
Integral 39 0 0 1 97.5%
Limit 40 0 0 0 100%
Permutation 36 0 0 4 90%
Square root 36 0 0 4 90%
Square 34 0 0 6 85%
Trigonometri
c 38 0 0 2 95%
Table 21. The above tabulated value represents overall Accuracy Measure with Tensorflow from a
document of 60 samples.
60 Number of testing formulae
𝒏𝒏(𝑻𝑻𝑻𝑻) 𝒏𝒏(𝑭𝑭𝑻𝑻) 𝒏𝒏(𝑻𝑻𝒏𝒏) 𝒏𝒏(𝑭𝑭𝒏𝒏) Accuracy
Addition 58 0 0 2 96.7%
Combination 60 0 0 0 100%
Differentiation 60 0 0 0 100%
Exponential 59 0 0 1 98.3%
Factorial 59 0 0 1 98.3%
Integral 58 0 0 2 96.7%
Limit 60 0 0 0 100%
Permutation 58 0 0 2 96.7%
Sigma 56 0 0 4 93.3%
Square root 58 0 0 2 98.3%
Square 57 0 0 3 95%
Trigonometric 59 0 0 1 98.3%
3.8 Positive Predictive Value
Positive predictive value (PPV) is a measure of significant
occurrences amid the retrieved occurrences it is also
known as precision. The PPV value with the proposed approach is 100% for different number of samples with different dominating types of formulae as shown in tables 22-24.
Positive Predictive value (PPV) =n(Tp)/ n(Tp)+n(Fp) (7)
Table 22. The above tabulated value represents overall PPV Measure with Tensorflow from a
document of 60 samples.
20 Number of
testing formulae 𝒏𝒏(𝑻𝑻𝑻𝑻) 𝒏𝒏(𝑭𝑭𝑻𝑻) False Discovery Rate
Addition 19 0 100%
Combination 19 0 100%
Differentiation 20 0 100%
Exponential 18 0 100%
Factorial 19 0 100%
Integral 19 0 100%
Limit 20 0 100%
Permutation 18 0 100%
Sigma 16 0 100%
Square root 16 0 100%
Square 16 0 100%
Trigonometric 19 0 100%
Table 23. The above tabulated value represents overall PPV Measure with Tensorflow from a
document of 60 samples.
40 Number of
testing formulae 𝒏𝒏(𝑻𝑻𝑻𝑻) 𝒏𝒏(𝑭𝑭𝑻𝑻) False Discovery Rate
Addition 38 0 100%
Combination 39 0 100%
Differentiation 40 0 100%
Exponential 38 0 100%
Factorial 39 0 100%
Integral 39 0 100%
Limit 40 0 100%
Permutation 36 0 100%
Sigma 34 0 100%
Square root 36 0 100%
Square 34 0 100%
Trigonometric 38 0 100%
Table 24. The above tabulated value represents overall PPV Measure with Tensorflow from a
document of 60 samples.
60 Number of
testing formulae 𝒏𝒏(𝑻𝑻𝑻𝑻) 𝒏𝒏(𝑭𝑭𝑻𝑻) False Discovery Rate
Addition 58 0 100%
Combination 60 0 100%
Differentiation 60 0 100%
Exponential 59 0 100%
Factorial 59 0 100%
Integral 58 0 100%
Limit 60 0 100%
Permutation 58 0 100%
Sigma 56 0 100%
Square root 58 0 100%
Square 57 0 100%
Trigonometric 59 0 100%
Figure 3. Overall Sensitivity Measure with Tensorflow from a document.
Figure 4. Efficiency Measure with Tensorflow from the document.
4. Conclusion
In this article an approach which retrieves mathematical formulae was projected. The efficiency of the wished-for procedure presented in terms of time analysis and accuracy. The proposed Tensorflow based math classification retrieves all the math formulae that are matched with data in the training document. The efficiency of proposed method is evaluated in terms of metrics like Sensitivity, Efficiency, Accuracy, PPV FDR, FPR and FNR. As more number of matched formulae and no unwanted formulae are retrieved with Tensorflow based math classification it out performs in terms of efficiency. The efficiency increases with increase in the number of math formulae in training document. The proposed method with Tensolflow produces best results in
terms of Sensitivity, Specificity, PPV, False Positive Rate and False Negative Rate.
References
[1] K Ma, S Cheung Hui and K Chang, “Feature Extraction and Clustering-based Retrieval for Mathematical Formulas”, The 2nd International Conference on Software Engineering and Data Mining, pp. 372-377, 2010.
[2]S Harshanath Samarasinghe and S Cheung Hui, “Mathema- tical Document Retrieval for Problem Solving”, International Conference on Computer Engineering and Technology, pp.583-587, 2009.
[3] J Misutka and L Galambos, “Mathematical Extension of Full Text Search Engine Indexer”, Proc. 3rd International Conference on Information and Communication Technologies: From Theory to Applications (ICTTA 08), pp. 1-6April 2008.
[4] Web Link to TensorFlow, Last accessed on 15th may 2019 https://sourcedexter.com/tensorflow-text-classification-python/. [5] B R Miller and A Youssef, “Technical Aspects of the Digital Library of Mathematical Functions”, in Annals of Mathematics and Artificial Intelligence, Springer Netherlands, pp. 121-136, 2003.
[6] H Zhang, T B and M S Lin, “An Evolutionary K means Algorithm for Clustering Time Series Data”, Proc. International Conference on Machine Learning and Cybernetics, pp. 1282-1287, 2004.
[7] R Munavalli and M R MathFind, “A Math-aware Search Engine”, Proc. Annual International ACM SIGIR Conference on Research and development in information retrieval, pp.735-735, 2006.
[8] M Kohlhase, “Markup for Mathematical Knowledge”, An Open Markup format for Mathematical Documents, Ver. 1.2, Lecture Notes in Computer Science, pp. 13-23, Springer Berlin,2006.
[9] G Appa Rao, K Venkata Rao, P V G D Prasad Reddy and T Lava Kumar, “An Efficient Procedure for Characteristic mining of Mathematical Formulas from Document”, International Journal of Engineering Science and Technology (IJEST), Vol. 10 No.03, pp152-157, Mar 2018.
Computer Sciences and Engineering, Volume-6, Issue-4, pp 400-403, Apr 2018.
[11] G AppaRao, G Srinivas, K Venkata Rao and P V G D Prasad Reddy, “a partial ratio and ratio based fuzzy-wuzzy procedure for characteristic mining of mathematical formulas from documents”, IJSC- ICTACT Journal on Soft Computing, Vol 8, Issue 4, pp 1728-1732, July 2018.
[12] M Peng, D Chen, Q Xie, Y Zhang, H Wang, G Hu, W Gao, Y Zhang, “ Topic-Net Conversation Model ”, International Conference on Web Information Systems Engineering, pp.483-496, 2018.
[13] M Peng, Q Xie, Y Zhang, H Wang, X Zhang, J Huang, G Tian, “ Neural Sparse Topical Coding ”, Proceedings of the 56th Annual Meeting of the Association for Computational Linguistics (volume 1: Long Papers), pp.2332-2340, 2018. [14] M Peng, Q Xie, H Wang, Y Zhang, G Tian, ” Bayesian Sparse Topical Coding ”, IEEE Transactions on Knowledge and Data Engineering, pp.1080-1093, 2018.
[15] H Wang and Y Zhang, “An Efficient Framework for The Analysis of Big Brain Signals Data”, Australasian Database Conference, pp.199-207, 2018.