1
A. Ignatius Agung Wibowo1,* ,B. Mohammad Zarar Mohamed Jenu1 and C.Alireza Kazemipour 1
1Faculty of Electrical & Electronic Engineering, UTHM
*Corresponding email: agung@uthm.edu.my
Abstract
An open area test site (OATS) for electromagnetic compatibility (EMC) antennas calibration will be built at the campus of Universiti Tun Hussein Onn Malaysia (UTHM) in Batu Pahat, Johor, Malaysia. The calibration of the EMC antenna mainly is to determine the antenna factor (AF). The development of the test site will be through modeling, simulation, selection of test site location, test site construction, and evaluation phases. The location of the test site will be selected so that it will have low ambient noise. The test site will be constructed based on the specification obtained from the model and simulation. Site attenuation measurements will be performed to evaluate the quality of the test site. This paper discusses a preliminary design and development of the test site includes feasibility study, design of the site construction, and measurements on site attenuation for site validation.
Keywords:Electromagnetic compatibility, antenna, open field test site, measurement.
International Journal of Integrated Engineering (Issue on Electrical and Electronic Engineering)
2 1. INTRODUCTION
The rapid development of domestic and commercial electrical and electronic equipments increased the demand for electromagnetic compatibility (EMC) test to comply radiated emission requirements from governing body. EMC testing can be in the form of conducted and radiated emissions measurements. For radiated emissions the most commonly used measurement techniques are antenna-based measurements in screened rooms, anechoic chambers, open area test sites (OATS), and gigahertz transverse electromagnetic (GTEM) cells.
An OATS often becomes a choice for EMC testing because it is fast, efficient and low cost compared to the other techniques. The OATS should be located in an area of low RF ambient. It must be far away from above ground or underground electromagnetic reflecting objects.
In the OATS, the electromagnetic field emanating from the equipment under test (EUT) is measured using an antenna. To obtain valid measurements, the antenna must be precisely calibrated. The calibration of the EMC antenna is to determine the antenna factor (AF) [3]. In general, AFs provided with the antenna usually are not adequate for valid measurement. AF is a parameter of an antenna which relates the value of the incident electromagnetic field to the voltage at the output of the antenna.
An OATS can be classified as a calibration test site (CALTS) or compliant test site (COMTS). A CALTS is an OATS that complies with the tightly specified site attenuation specifications. A CALTS is used for determining the parameters of an EMC antenna. A COMTS is an OATS that has less stringent specifications than a CALTS. A COMTS is used for performing radiated emission measurement [1].
The validation of a test site is performed using site attenuation (SA) measurement. Site attenuation is defined as the minimum site insertion loss measured between two polarization-matched antennas located on a test site when one antenna is moved vertically over
a specified height range and the other is set at a fixed height. Normalized site attenuation (NSA) is the site attenuation which is divided by the product of the antenna factors for the two antennas used. For a COMTS, NSA must be within 4 dB while for a CALTS, NSA must be within 1 dB of the theoretical NSA in the frequency range of 30–1000 MHz [1].
Basically there are two calibration methods i.e. the standard site method (SSM) and the reference antenna method (RAM). The SSM requires a standard antenna calibration site. There must be three SA measurements under identical geometries using three different antennas taken in pairs. The antenna factors for each antenna are then calculated. The RAM uses a tuned half-wave dipole antenna as a reference to derive the AF of the unknown antenna. In this method a field is generated using any type of antenna. The field is then measured using he reference antenna and the unknown antenna. The difference in the measured field strength is the difference in AFs between the reference antenna and the unknown antenna [3].
2. FEASIBILITY STUDY
A feasibility study has to be done to evaluate the candidate location for the test site. Ambient noise must be the fist to be considered in the feasibility study. If the ambient noise in a location is too excessive then the test site can not be built in that place. CISPR 16-1 uses 6 dB measurement signal level above the ambient noise to categorize the quality of a test site. The best one if the measurement signals are 6 dB above the ambient noise for the entire measurement range [1].
An ambient noise measurement has been performed at the candidate location of the test site in UTHM campus area using a log periodic antenna EMCO 3146 in the frequency 200 – 1000 MHz [6]. The result is shown in Fig. 1.
Significant amount of noise appears at the
frequencies of
390, 462, 633, 921, 930, 939,and addit be in is con 3. T Th CAL requi i.e. 2 Fi Fig. Fig 0 10 20 30 40 50 BH De p th (m ) 1 wood n pil reinf con grou wa found almo tion the mea n those frequ nsidered feas
TEST SITE C he test site w LTS, therefo
ired site will 20 m length b
ig. 1 Ambient propo
2 Geological
g. 3 Conceptua
1 5 10
Lensa Sand Sinkhole Pinna m de les
30 - 40 forced ncrete und ater ost everywh asurement in uencies. Ther sible to build
CONSTRUCTI
which will b re the size be the obstr by 17.3 m wi
t electromagne osed CALTS l
structure at U
al design of th
15 20
Distance(m)
Very Soft to Ver
Hard Clay Limestone acles m gr ere nowada n this site w refore the lo d a test site.
ION
be built is a of the min ruction free e idth [1][2].
etic noise arou location
UTHM campu
he site constru
25 30
ry Stiff Clay
e
Ground Water Tab
Sinkhole Pinna mesh round g 3 3 ays. In will not ocation 10 m nimum ellipse, und us area uction T qu str be fro wa wh gro de 4. dis qu is T an the ge illu me A wa ele tra rec fro Th fre ma spe str Fig 35 BH2 le cles V groundin
- 4 m
The concrete uality data ructure data a Since the so
supported om cracking ater table is hich makes
ound plane. sign of the si
SITE ATTE
SA measure stance has b uality of the
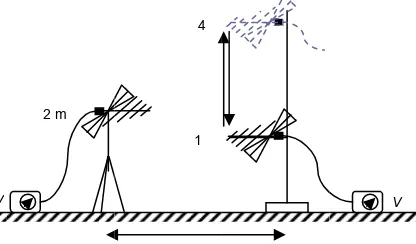
shown in Fig The measure tennas orien e ground. ometry kno ustrated in easurement. A waveform as fed to th ectromagneti ansmit anten ceive antenn om the transm he process equency 30
aximum pe ectrum anal rength receiv
g. 4 Antenna c 2 m
e base will b (boring lo as depicted in oil is very so
using wood and slow dr found to be
easier for Fig. 3 sh ite construct
ENUATION M ment for 3 m been perform site [7]. The g. 4.
ements were nted horizont
Mesh groun own as Spe
Fig. 5 w
m produced b e transmit a ic field. T nna was kep
na scanned mit antenna was done 0 MHz to
ak was th lyzer which ved by the rec
configuration 4
1
3
be designed u og) and ge
n Fig. 2. oft, the concr den piles to
ropping. The very shallow r grounding hows the co
ion.
MEASUREME
m separation med to eval e measureme
e performed w tally with re nd plane w cial Plane was used
by a signal g antenna to c The height pt constant w the field em from 1 m up e repeatedl
1000 MH hen recorded measured t ceive antenn
for NSA mea
using soil eological
rete must avoid it e ground w (1 m) g of the
onceptual ENT n antenna luate the ent setup with two espect to with the
I [5] as in this generator create an of the while the manating p to 4 m. ly from Hz. The d by a the field na.
asurement
International Journal of Integrated Engineering (Issue on Electrical and Electronic Engineering)
4 Fig. 5 Mesh ground plane geometry
The theoretical SA is related to the antenna factors of the receive and transmit antennas as given by the following formula [4]:
max 1 . 279
D M
T R
E f
AF AF
A (1)
where
fM : frequency (MHz)
AFR : antenna factor of receiving antenna (dB/m)
AFT : antenna factor of transmitting antenna
(dB/m)
EDmax : maximum electric field in
receiving-antenna height-scan range from a theoretical half wave dipole with 1pW of radiated power.
The theoretical NSAs (NSAt) for each frequency were then calculated using the following formula:
T R t
AF AF
A
NSA (2)
The measured NSAs (NSAm) for each
frequency were calculated from the measurement data using the following formula [1]:
NSAm= VDIRECT – VSITE – AFT – AFR (3)
where
VDIRECT : received voltage measured at the
spectrum analyzer when the cable from the signal generator and the
cable to the spectrum analyzer are directly connected.
VSITE : received voltage measured at the
spectrum analyzer when the cables are connected to the respective antennas.
AFT : the transmit antenna factor AFR : the receive antenna factor
The results of the measurements and calculations are listed in Table 1 and plotted as a graph as shown in Fig. 6. It can be seen that the measured NSA curve is quite close to the theoretical NSA curve. Around 70% measured NSAs are within 1 dB band and only 2 are outside 4 dB band. It means that the quality of the site is quite good although is not valid yet for antenna calibration. Some improvements have to be taken on the equipments and measurement method in order to get better result.
Table 1: NSA Measurement Data for Horizontal Polarization
f
(MHz)
VDIRECT
(dBµV)
VSITE
(dBµV)
AFT
(dB/m)
AFR
(dB/m)
NSAm
(dB)
NSAt
(dB) 30 96.626 58.352 14.8 18.9 4.574 15.8
40 96.483 63.633 12 12.7 8.150 11.3
50 96.335 72.514 10.4 9 4.422 7.8
60 96.290 74.934 9.7 7.1 4.556 5
70 96.127 77.221 9.5 6.9 2.506 2.8
80 96.076 77.271 9.7 7.7 1.405 0.9
90 95.885 77.034 10.3 8.8 -0.248 -0.7
100 95.827 77.530 10.9 9.2 -1.803 -2
120 95.569 80.158 11.8 7.9 -4.289 -4.2
140 95.540 81.135 12.4 8.2 -6.194 -6
160 95.483 80.280 13 9.7 -7.497 -7.4
180 95.266 80.038 13.6 10.1 -8.472 -8.6
200 95.076 79.672 15 10.2 -9.795 -9.6
250 94.877 77.362 12.3 12.5 -7.285 -11.9
300 94.685 75.752 14.6 14.2 -9.867 -12.8
400 94.178 77.406 15.8 16.4 -15.428 -14.8
500 93.491 74.779 17.9 17.9 -17.088 -17.3
600 93.165 71.576 18.9 20.3 -17.611 -19.1
700 92.816 68.033 21.6 22 -18.817 -20.6
800 92.191 70.166 21.4 22.2 -21.575 -21.3
900 91.858 68.686 22.7 23.6 -23.128 -22.5
5 Fig. 6 Comparison between theoretical and
measured NSA at candidate location
7. CONCLUSION
A preliminary study on the development of an antenna calibration open field test site has been presented. The feasibility study reveals that the test site is feasible to be built at the candidate location. A conceptual design of the site construction has been created. It can be developed further by the contractor of the test site construction. The preliminary measurements on the site attenuation have been performed and analysed. The results are promising and the development of an antenna calibration open field test site in UTHM can be continued.
ACKNOWLEDGMENT
The authors thank EMC Center Universiti Tun Hussein Onn Malaysia Johor for providing facilities to do this research work.
REFERENCES
[1] IEC, Specification for Radio Disturbance and Immunity Measuring Apparatus and Methods, CISPR 16-1, 2007.
[2] ANSI, American National Standard Guide for Construction of Open-Area Test Sites for Performing Radiated Emission
Measurements, ANSI C63.7, 1998.
[3] ANSI, American National Standard for Electromagnetic Compatibility – Radiated
Emission Measurements in Electromagnetic Interference (EMI)
Control – Calibration of Antennas, ANSI
C63.5, 1989.
[4] J. A. A. Smith, R. F. German and J. B. Pate, “Calculation of Site Attenuation from Antenna Factors,” IEEE Transactions on Electromagnetic Compatibility, vol. EMC-24, No. 3, August 1982.
[5] S. Battermann and H. Garbe, “Effects of Realistic Ground Planes to NSA-measurement of Open Area Test Sites (OATS),” in 27th General Assembly of the International Union of RadioScience (URSI), Nederlands, 2002.
[6] S. S. Sinan, Ambient Noise Reduction in Open Area Test Site(OATS) Measurement,
Thesis, UTHM, 2009.
[7] H. Z. Abidin, Evaluation of Normalized Site Attenuation of an Open Area Test Site, Thesis, UTHM, 2009.
NSA for horizontal polarization
‐30
‐20
‐10 0 10 20 30
0 100 200 300 400 500 600 700 800 900 1000
f (MHz)
NS
A
(d
B
)