Performance Comparison between EAFD and Conventional
Supplementary Cementing Materials
Amir Fauzi1, 2, Muhd Fadhil Nuruddin1, Syukri2
1 Civil and Environment Department, Universiti Teknologi PETRONAS, Perak, Malaysia 2 Civil Department, Politeknik Negeri Lhokseumawe, Aceh, Indonesia
*Corresponding E-mail: [email protected]
Received 7 January 2016; Revised 30 January 2016; Accepted 8 February 2016
Abstract
Sustainability of concrete construction necessitates exploring potential renewable resource, especially from industrial waste products. Electric arc furnace dust (EAFD), a by-product of the modern electric arc furnace (EAF) process from the steel manufacturing industry has an adverse impact on the environment. Utilizing EAFD in concrete production as a cement replacement material together with silica fume (SF) and fly ash (FA) has raised the interest of many researchers. This study investigates the use optimum 5% EAFD content refers to both 15% SF and 20% FA in water binder ratio of 0.5 and sand to cement ratio of 2. The aim of this study is to obtain the percentage replacement levels of EAFD that are equivalent to the SF and FA regarding workability, setting time, compressive strength and resistance to rapid chloride permeability. The compressive strength results showed that replacement of 5% SF and 15% FA are the equivalent replacement levels to 3% EAFD. Similarly, results from resistance to rapid chloride permeability showed that the optimum EAFD content performed better than the replacement levels of FA. However, SF replacement levels showed the best resistance to rapid chloride permeability. Therefore, 3% replacement of EAFD provided an intermediate performance between the optimum SF and FA contents and exceeded that of the control.
Keywords: Chemical composition, particle size, workability, setting time, compressive strength, rapid
chloride permeability
1.0 Introduction
Utilization of the modern Electric Arc Furnace (EAF) process in the manufacturing of steel from sponge iron, scrap metal, and other steel wastes is unavoidable nowadays [1]. The production of steel using EAF process is accompanied by waste dust identified as Electric Arc Furnace Dust (EAFD) [2-3]. The amount of EAFD generated from steel production is estimated to be approximately 2% of steel weight [3]. So that, the EAFD was interesting to be investigated [4].
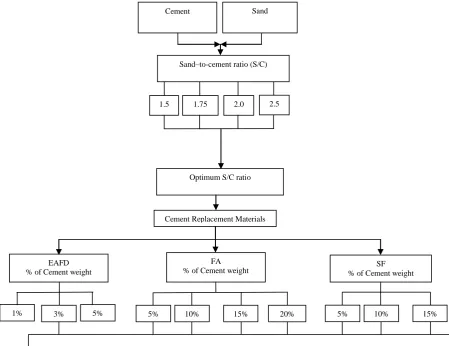
It was documented that the most abundant heavy metals found in EAFD are zinc (Zn), lead (Pb), iron (Fe) and other miscellaneous heavy metals [5], so that the EAFD was classified as a hazardous material. The EAFD have particle sizes range from 2.8 to 176 µm and the majority (94%) of the particle size is smaller than 5.5 µm in diameter [6, 7].
0 10 20 30 40 50 60 70 80 90 100
0.01 0.1 1 10 100 1000 10000
C
o
m
m
u
la
ti
v
e
fr
eq
u
en
cy
(%)
Particle size (µm)
SF EAFD PC FA
2.0 Materials
This investigation used Portland cement (PC) complying with ASTM C150/C150M [9] as a base material in concrete, while, SF complying with ASTM C1240 [10] and FA complying with ASTM C618 [11] as replacement material that have established as supplementary cementing materials. The EAFD was objective material sourced from a local steel producer, Southern Steel Company, Malaysia. The particle size distributions of PC, SF, FA and EAFD was determined using laser scattering particle size distribution analyzer (LA 950 VR) as showed in Figure 1. The figure shows the PC has a particle size of 11µm while the SF, FA, and EAFD powders is 0.2, 10 and 3 µm, respectively. It means that EAFD is finer than both of cement and FA but is still coarser than SF.
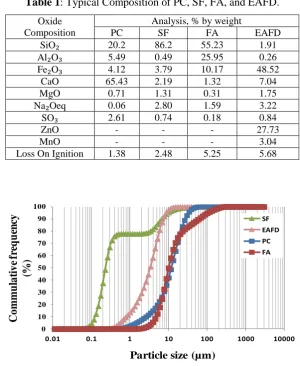
The chemical analysis of PC, SF, FA and EAFD is summarized in Table 1. It shows that the element of Fe, Zn, and Ca in EAFD is insignificant percentage compared to SF and FA. It is predicted that the higher contents of Zn and Fe elements are a negative impact on early fresh properties of concrete such as setting time and early compressive strength.
Table 1: Typical Composition of PC, SF, FA, and EAFD.
Oxide Composition
Analysis, % by weight
PC SF FA EAFD
SiO₂ 20.2 86.2 55.23 1.91
Al₂O₃ 5.49 0.49 25.95 0.26
Fe₂O₃ 4.12 3.79 10.17 48.52
CaO 65.43 2.19 1.32 7.04
MgO 0.71 1.31 0.31 1.75
Na₂Oeq 0.06 2.80 1.59 3.22
SO₃ 2.61 0.74 0.18 0.84
ZnO - - - 27.73
MnO - - - 3.04
Loss On Ignition 1.38 2.48 5.25 5.68
Cement Sand
Sand–to-cement ratio (S/C)
1.5 1.75 2.0 2.5
Optimum S/C ratio
Cement Replacement Materials
EAFD % of Cement weight
FA
% of Cement weight % of Cement weight SF
5% 10% 15% 20%
3%
Workability, setting time, compressive strength and rapid chloride permeability
5% 10% 15%
3.0 Methodology
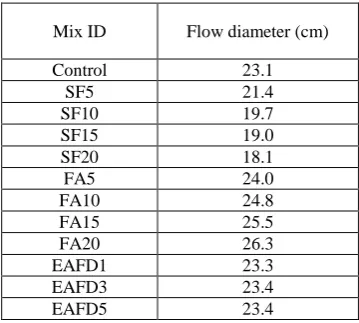
A flow chart for the experimental program is shown in Figure 2. The procedure starts with the selection of four different mix characteristics that provide an economical mixture with expected properties. Four different mix characteristics are cement content, water content, sand content, and the replacement level of supplementary cementitious materials (SCMs). A water-to-cement ratio of 0.5 was selected. It is two variables in this procedure. They are sand to water-to-cement ratio (S/C) of 1.5, 1.75, 2.0 and 2.5, respectively, and different cement replacement levels of up to 15% SF, 20% FA and 5% EAFD. These percentages were based on optimum cement replacement in concrete mixtures from previous research except EAFD. The S/C ratio obtained from the optimum value of compressive strength at 7 days was used in the normal concrete mixtures. The value obtained in each test result is from an average of three samples. The parameters of mixtures tested were conducted under workability, setting time, compressive strength and rapid chloride permeability.
Figure 2: Flow chart of the experimental program
4.0 Results and Discussions
4.1
Optimization of sand-to-cement ratio (S/C)It identifies that at the early age of 1 to 7 days, the maximum compressive strength is consistent in S/C ratio of 2. So that, this S/C ratio is as a bench mark of this investigation.
Figure 3: Compressive strength of different S/C ratio
4.2 Workability
The average flow diameter of each mortar mixture was measured using the flow table in accordance with ASTM C230 / C230M [14]. The results are shown in Table 2. It is notable that the addition of SF percentage decreases workability while increase percentage of FA improves workability with respect to the control mixture. However, it is shown that EAFD has workability almost similar like control although the percentage added. This phenomenon means that it is opposite properties between SF and FA to demand the water which the SF powder in concrete mixture absorbs the water, whereas the FA powder release. Yet, EAFD does not effect to demand the water in the concrete mixture. It is because of the particle size of SF is lesser than FA, whereas particle size of EAFD is a normal size between SF and FA so that it kept water stability.
Table 2: Average flows in diameter of mortar mixtures
Mix ID Flow diameter (cm)
Control 23.1
SF5 21.4
SF10 19.7
SF15 19.0
SF20 18.1
FA5 24.0
FA10 24.8
FA15 25.5
FA20 26.3
EAFD1 23.3
EAFD3 23.4
EAFD5 23.4
0 10 20 30 40 50
1 2 3 4
C
O
M
P
R
ES
SIV
E
STRE
NGTH
(M
P
a)
1
d
3
d
7
d
1.5 1.75 2.0 2.25 Sand/Cement
4.3 Setting Time
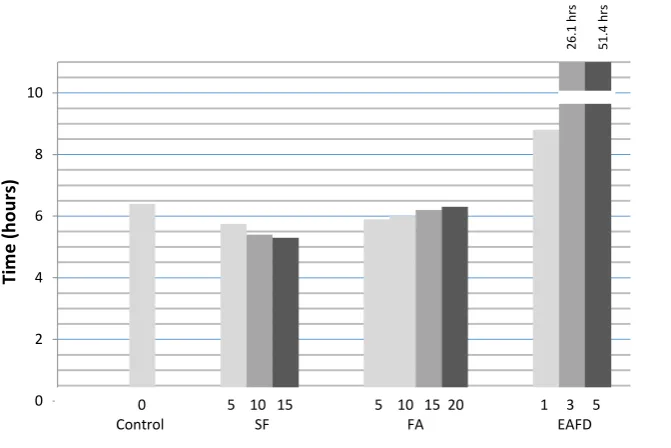
Figure 4 shows the setting times of mortar mixtures with use SF, FA, and EAFD. It is noted that the presence of 1%, 3% and 5% EAFD significantly increase the final setting time. It is obvious that when the percentage of EAFD increased, it brings to prolong setting time of 8.8 hours, 26.1 hours and 51.4 hours, respectively. It is suspected because of Zn and Mn elements present in EAFD which it is not in SF and FA. In addition, the percentage of Fe element also affects to prolong setting time. It can be seen from Table 1 that percentage of Fe element in EAFD is significant compared to FA and SF. It is obvious that it is the opposite condition of SF which when the replacement percentage increased, the final setting time will decrease. Whereas, it is a concomitant condition in FA, which replacement percentage increased, the final setting time is increased. Finally, when the EAFD replacement increased, the final setting time is significantly increased. It means that it is critical as it extends the setting time of the mortar mixture more than one day. Therefore, higher replacement level of EAFD is not practical.
Figure 4:Final setting times
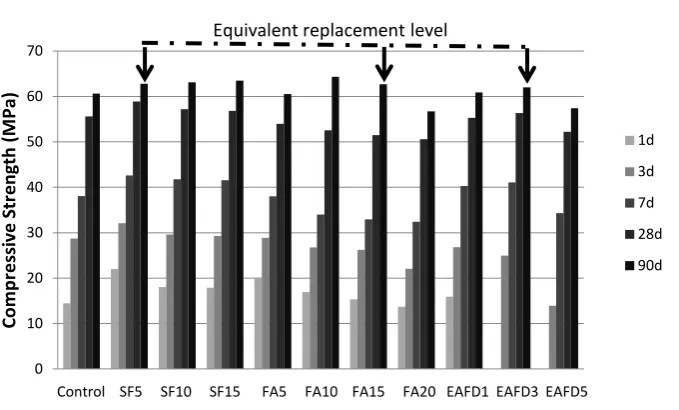
4.4 Compressive Strength
Equivalent replacement levels of SF and FA for the optimum EAFD content were determined in this part of the study. The replacement levels of up to 15% for SF, up to 20% FA for FA and up to 5% for EAFD. This replacement was investigated to get equivalent replacement levels of EAFD refer to SF and FA. The compressive strength, for curing ages of 1, 3, 7, 28 and 90 days is presented in Figure 5. Equivalent replacement levels of optimum EAFD to SF and FA can be easily determined considering the best performance of compressive strength particularly at 28 and 90 days. First day compressive strength, 3% and 5% EAFD replacement was still fresh and has no compressive strength due to the concrete is not setting yet. As refer to the final setting time in Figure 4 that EAFD with 3% and 5% replacement of cement have prolonged setting time for 26.1 hours and 51.4 hours, respectively, which it means that the concrete start to be hard after that time. It is not similar to 1% EAFD which the concrete has been hard after 8.8 hours or 2 hours after normal final setting time so that the compressive strength is directly gained after 1 day. At the later ages, the compressive strength of 3% EAFD is higher than that given by the control and
0 2 4 6 8 10
1 2 3 4
Ti
m
e
(h
o
u
rs)
0 5 10 15 5 10 15 20 1 3 5 Control SF FA EAFD
26
.1
h
rs
51
.4
h
and 15% FA, respectively. From this study, it is noted that there are two options to use EAFD in concrete viz. 1% EAFD for short-term investigation and 3% EAFD for gain best compressive strength.
Figure 5: Compressive strength
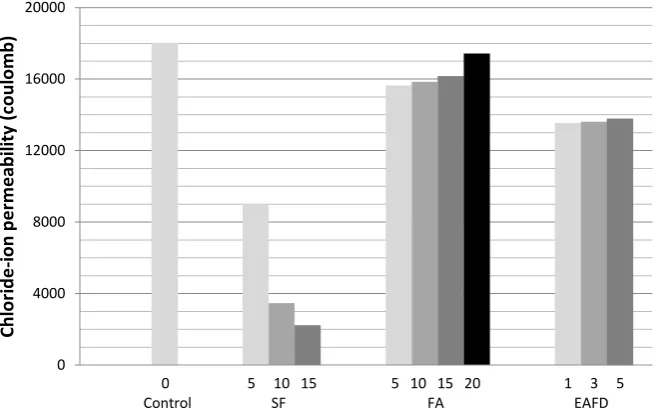
4.4 Rapid Chloride Permeability Test (RCPT)
The rapid chloride penetration test (RCPT) relies on the electrical charge passing through the mortar mixtures. This test was done in accordance with ASTM C1202 [13]. It is known that the amount of electrical charge passes into the mortar sample is much higher than that in the corresponding concrete one. Figure 6 shows the RCPT results of control, SF, FA, and EAFD mixtures. In general, SF, FA and EAFD mixtures are lower electrical charge values than the control mixture, which higher chloride penetration resistance means lower permeability. Furthermore, SF mixtures show the lowest electrical charge values and it is an abrupt reduction in the chloride permeability from lower to a higher replacement level of SF. It is opposite with FA which the chloride permeability is increased along to increase the replacement. In addition, even the chloride permeability of FA is lower than control but it is still higher compare to SF and EAFD. Furthermore, increase replacement percentage of EAFD up to 5% does not affect to increase chloride permeability. However, it is still lower than FA. It can be concluded that the filling effect due to the fine particles in EAFD is predominant at W/B ratio of 0.5 and the nature of calcium hydroxyl zincate gel (C-Z-H) formed under these conditions due to the presence of Zn ions.
0 10 20 30 40 50 60 70
1 2 3 4 5 6 7 8 9 10 11
Co
m
p
re
ssi
ve
S
tr
e
n
gth
(
M
Pa)
1d
3d
7d
28d
90d
Control SF5 SF10 SF15 FA5 FA10 FA15 FA20 EAFD1 EAFD3 EAFD5
Figure 6:Rapidchloride permeability test
5.0 Conclusions
On the basis of the equivalent replacement level concept and the results obtained from this research work, the following conclusions can be drawn as follows:
1. The particle size of EAFD is finer than cement and FA but is coarser than SF.
2. The use of EAFD prolonged setting time of mortar mixtures due to the high content of Zn.
3. Optimum replacement of EAFD is 3% which it is equivalent to 5% SF and 15% FA refer to compressive strength.
4. Rapid chloride permeability reveal that 3% EAFD provided an intermediate performance between 5%SF and 15% FA.
References
[1] P. Oustadakis, P.E. Tsakiridis, A. Katsiapi, and S.A. Leonardou, “Hydrometallurgical Process for Zinc Recovery from Electric Arc Furnace Dust (EAFD) Part I: Characterization and Leaching by Diluted Sulphuric Acid”. Journal of Hazardous Materials, 179: p. 1-7, 2010.
[2] R.A. Janjua, “Optimization of Electric Arc Furnace Dust Recycling and Zinc Recovery by Scrap De-zincing”. Bergakademie Freiberg genehmigte, p. 113, 2008.
[3] G. Laforest, and J. Duchesne, “Characterization and Leachability of Electric Arc Furnace Dust Made from Remelting of Stainless Steel”. Journal of Hazardous Materials, B 135: p. 156–164, 2006.
[4] M. Maslehuddin, et al, “Effect of Electric Arc Furnace Dust on the Properties of OPC and Blended
Cement Concretes”. Construction and Building Materials, 25(1): p. 308-312, 2011.
[5] J.A. De Araújo, and V. Schalch, “Recycling of Electric Arc Furnace (EAF) Dust for Use in Steel Making Process”. Journal of Materials Research and Technology, 3(3): p. 274-279, 2014.
[6] U. Bulut, A. Ozverdi, and M. Erdem, “Leaching Behavior of Pollutants in Ferrochrome Arc Furnace Dust and Its Stabilization/Solidification Using Ferrous Sulphate and Portland cement. Journal of hazardous materials, 162(2): p. 893-898, 2009.
[7] T. Sofilic, et al, “Characterization of Steel Mill Electric-Arc Furnace Dust”. Journal of Hazardous Materials, B 109: p. 59-70, 2004.
[8] A.S. De Vargas, et al, “Investigation of Potential Uses of Electric Arc Furnace Dust (EAFD) in Concrete”. Cement Concrete Research, 36: p. 1833-1841, 2006.
[9] ASTM C150/C150M, “Standard Specification for Portland cement”, ASTM international, 2012. 0
4000 8000 12000 16000 20000
1 2 3 4
Ch
lo
ri
d
e
-i
o
n
p
e
rm
e
ab
ili
ty
(c
o
u
lo
m
b
)
Axis Title
[11] ASTM C618, “Standard Specification for Coal Fly Ash and Raw or Calcined Natural Pozzolan for Use in Concrete”, ASTM International, 2012.
[12] ASTM C230 / C230M, “Standard Specification for Flow Table for Use in Tests of Hydraulic Cement”, ASTM international, 2008.