Horn-Shaped Structure Attached to the Ring-Shaped Ion Velocity
Distribution during Magnetic Reconnection with a Guide Field
∗
)
Shunsuke USAMI
1,2), Ritoku HORIUCHI
1,3)and Hiroaki OHTANI
1,3)1)National Institute for Fusion Science, National Institutes of Natural Sciences, Toki 509-5292, Japan 2)University of Tokyo, Tokyo 113-8654, Japan
3)Sokendai (The Graduate University of Advanced Studies), Toki 509-5292, Japan
(Received 9 January 2019/Accepted 25 June 2019)
The characteristic feature of a “horn-shaped velocity distribution” in magnetic reconnection in the presence of a guide field is investigated by means of simulation and theory. Particle simulations show that a horn-shaped velocity structure is formed in the downstream, concomitant with a ring-shaped velocity distribution studied in the preceding works. The theory which explains the motion of ions responsible for the horn-shaped structure is constructed as an extension of the basic theory for the ring-shaped structure. In the extended theory, ions are accelerated in the inflow direction by an electrostatic field in the separatrix, and thus the gyration speed of such ions in the downstream is larger than that for the basic theory. Test particle simulations confirm that some ions behave as in the extended theory and form the horn-shaped velocity structure.
c
2019 The Japan Society of Plasma Science and Nuclear Fusion Research
Keywords: particle simulation, magnetic reconnection, ion heating, PASMO, spherical tokamak DOI: 10.1585/pfr.14.3401137
1. Introduction
Magnetic reconnection is one of the fundamental pro-cesses seen in various plasmas [1], in which magnetic en-ergy is rapidly converted to kinetic and thermal enen-ergy of plasma particles. Fusion plasmas are deeply associated with magnetic reconnection processes from both negative and positive aspects. Sawtooth crash or oscillation, which is thought to be related to reconnection, in a tokamak de-vice is a negative aspect. When sawtooth crash or oscil-lation occurs, the stored energy in the core is released to the periphery region [2]. Hence, the control of sawtooth crash and oscillation is an important issue for fusion plas-mas in tokamaks. On the other hand, magnetic reconnec-tion has a positive aspect for merging plasmas in spherical tokamaks, in which plasmas with quite highβare created by plasma heating during magnetic reconnection and are confined [3, 4]. The mechanism of the heating in spherical tokamaks, however, remains unsolved.
We explore the heating mechanism during magnetic reconnection by means of simulation and theory in this work. It is a quite useful and commonly used method to ob-serve and analyze velocity distribution functions for mag-netic reconnection studies as shown, for example, in Refs. [5–11]. One can derive where plasma particles are accel-erated or heated and what mechanism acts for the plasma acceleration and heating by analyzing velocity distribution. In preceding simulation works by Usamiet al.[12, 13], on
author’s e-mail: usami.shunsuke@nifs.ac.jp
∗)This article is based on the presentation at the 27th International Toki
Conference (ITC27) & the 13th Asia Pacific Plasma Theory Conference (APPTC2018).
the basis of analyzing ion velocity distribution, an eff ec-tive heating mechanism during magnetic reconnection in the presence of a guide field was proposed. The essential point of the mechanism is that ions behave as nonadiabatic upon crossing the separatrix, and ring-shaped ion velocity distributions are formed in the downstream of reconnec-tion.
In this paper, an additional anomalous structure, which is observed in the velocity space and is attached to a ring-shaped velocity distribution, is discussed. The or-ganization of this paper is as follows. In Sec. 2, we high-light particle simulation results and review the formation process of a ring-shaped structure of an ion velocity distri-bution. In Sec. 3, an additional structure, called a “horn-shaped structure,” found in particle simulations is shown. We extend the theory for the ring-shaped distribution to explain the formation process of the horn-shaped struc-ture. In addition, we investigate the motion of ions forming the horn-shaped structure by means of test particle simula-tions. Lastly, section 4 provides a summary of this work.
2. Review of the Ring-Shaped
Struc-ture in Velocity Distribution
2.1
Particle simulation method and result
In order to investigate the ion heating mechanism dur-ing magnetic reconnection in the presence of a guide mag-netic field, we carry out two-dimensional particle simu-lations, since nongyrotropic motions of plasma electrons and ions, which can not be computed by fluid models, play essential roles in magnetic reconnection, in particular, forc
2019 The Japan Society of Plasma
plasma heating during magnetic reconnection.
For particle simulations, we use the PASMO code [14,15], in which an open boundary condition is employed. Plasmas are pushed by a driving electric fieldEd imposed on the upstream boundary. The driving fieldEd supplies particles satisfying a shifted Maxwellian velocity distri-bution so that plasmas flow into the simulation domain from the upstream boundary. The fieldEdzis set to zero at the initial time, begins to grow first near the center of the upstream boundary, and eventually has a constant value
E0 in the entire upstream boundary, where Edz is the z -component ofEd. On the other hand, through the down-stream boundary, plasma particles can enter and exit freely. As the initial condition, we take a one-dimensional Harris-type equilibrium with a uniform guide field as Ho-riuchi and Sato first applied [16]. That is, we setBx(y) =
Bx0tanh(y/L) andBz(y) = Bz0 for the magnetic field and
P(y) = P0+B2x0/(8π)sech
2(y/L) for the plasma pressure,
where Bx0, Bz0, and P0 are constants and L is a
spa-tial scale. The temperature is uniform, and the ion tem-perature is taken to be equal to the electron temtem-perature:
Ti0/Te0 =1.0.
The simulation parameters are denoted as follows. The simulation domain size is 10.54(c/ωpi)×2.63(c/ωpi), wherecis the speed of light andωpiis the ion plasma fre-quency. The initial numbers of electrons and of ions are 14,090,240, respectively. The ion-to-electron mass ratio is taken to bemi/me=100. The ratio of the electron plasma frequency to the electron gyrofrequency isωpe/ωce =6.0, whereωce =eBx0/(mec) is defined. Thus, the Alfvén speed is expressed asvA/c = 0.037 for the total magnetic field
B0 =
B2
x0+B2z0. The time step isωpiΔt = 0.0052, and the grid spacing isΔg/(c/ωpi)=0.010.
We demonstrate results of a simulation run under the following parameter values: Bz0/Bx0 = 2, L/(c/ωpi) = 0.66, P0/(B2x0/8π) = 0.35, and E0/Bx0 = −0.04. This
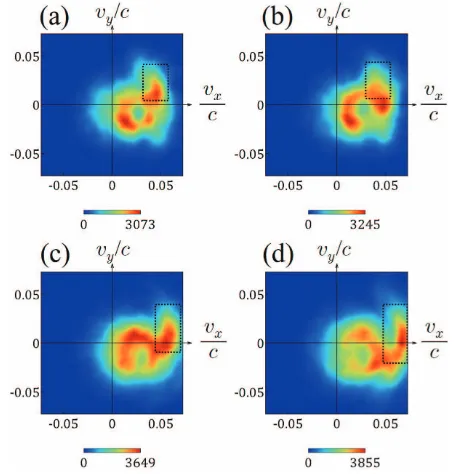
simulation run is the same as a run which has been per-formed in Refs. [12, 13]. Figure 1 (a) shows the spatial profile of the ion temperature perpendicular to the local magnetic field as color contours and the magnetic field lines atωpit = 775. Magnetic reconnection is driven by inflow plasmas supplied from the upstream boundary, and the reconnection point (the X-point) is located at the cen-ter of the simulation domain (x,y) (0,0). An ambipo-lar reconnection outflow emanates from the X-point. We can clearly see that the ion temperature rises mainly in the downstream. Figures 2 (a) - (d) display ion velocity distri-butions at the local areas (A) - (D) represented in Fig. 1, respectively. As Refs. [12] and [13] demonstrated, ring-shaped velocity distributions are formed, which means that the velocity distributions are expanded and ions are eff ec-tively heated in the downstream.
2.2
Basic theory
The formation process of the ring-shaped velocity
dis-Fig. 1 (a) Spatial profiles of the ion temperature perpendicular to the local magnetic field as the color contours and the magnetic field lines. (b) Spatial profile of the electric field Ey. The local areas (A) - (D) indicated in the panels (a)
and (b) are in the downstream, primarily where the ion temperature is increased. In the lower-side separatrix for x>0 and in the upper-side separatrix forx<0, a strong Eyexists.
Fig. 2 Ion velocity distributions in the local areas (A) - (D) of Fig. 1. The regions surrounded by the dotted lines denote horn-shaped structures. In all the panels (a) - (d), ring-shaped and horn-ring-shaped structures are shown.
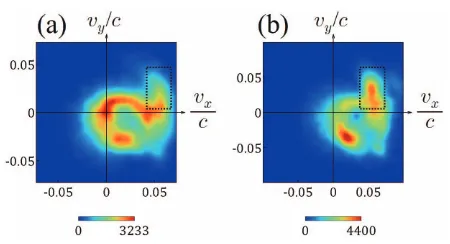
suf-Fig. 3 Ion velocity distributions (a) at an earlier phase for the same run of simulations as in Fig. 2, and (b) for a dif-ferent run of simulations under a different value of the driving electric field. The regions surrounded by the dot-ted lines denote horn-shaped structures. Horn-shaped and ring-shaped structures are seen in both panels.
ficiently small so that we regard it as zero for the ideal case. Here it is assumed for simplification that in the down-stream, the reconnection outflow is in thexdirection and its speed isuout, and the guide magnetic field in thez
di-rection and the convective electric field in theydirection are uniform. The other components of the electromag-netic field can be ignored because they are much smaller. The ions move in thexdirection owing to theE×Bdrift while in gyromotion around the guide magnetic field in the downstream. It is characteristic that the drift speed is equal touout, and the gyration speed is also equal to uout. The
ring-shaped velocity distribution consists of such ions. The effective temperature of the ions forming the ring-shaped distribution is simply given asTi=1/2miu2out.
3. Horn-Shaped Structure in Velocity
Distribution
3.1
Particle simulation result
In the velocity distribution of Fig. 2, we can observe another characteristic structure surrounded by dotted lines, in addition to the ring-shaped structure. We call this a “horn-shaped structure or distribution.” Such horn-shaped structures are seen not only for this run of simulations, but also for various runs of simulations. We further show ion velocity distributions in Fig. 3. The panel (a) is an ion ve-locity distribution at an earlier phase (ωpit =258) for the same run of the simulations as in Fig. 2, and the panel (b) is an ion velocity distribution for a different run of simu-lations with a different value of the driving electric field
E0/Bx0 = −0.06. Horn-shaped structures can be seen in
both cases.
3.2
Extended theory
We extend the basic theory in order to explain the for-mation mechanism of a horn-shaped structure. If some ions are accelerated in theydirection by an electrostatic fieldEyin the separatrix, they have a finite speedvywhen they enter the downstream [8, 17, 18]. Actually, Fig. 1 (b)
shows that Ey is strong in the lower-side separatrix for
x>0 and in the upper-side separatrix forx<0. In some observational studies in the geomagnetosphere, it has been reported that ions are accelerated by an electric field in the separatrix [19, 20].
Let the entry velocity of the ions be (0,vy0), where it
is noted that the value ofvy0 can be different for each ion.
For the electromagnetic field in the downstream, we em-ploy the same assumption as the basic theory. In the down-stream, the motion of the ions is theE×Bdrift while in gyromotion as described in the basic theory. The gyration speed, however, is different from the gyration speed in the basic theory. The gyration speed is given as
u2
out+v2y0,
which is larger thanuout. In the velocity space, the ions are
located outside a circle whose radius isuout(a ring-shaped
structure). Under the above situation, let us observe a ve-locity distribution in a local area. Assuming that gyromo-tion phases of the ions are limited within a narrow range, the velocity distribution formed by the ions is not a ring-shape, but a horn-shape.
In the extended theory, it is essential that ions are not sufficiently accelerated in the x direction in the separa-trix. If an ion is accelerated in the xandydirections in the separatrix, it has a finite entry velocity (vx0,vy0). The
gyration speed is expressed as
(uout−vx0)2+v2y0. The
large vx0 makes the gyration speed of the ion decrease.
Consequently, a horn-shaped structure would not be seen, because a structure formed by such ions whose gyration speed is smaller would overlap the ring-shaped distribu-tion.
3.3
Test particle simulation
In order to show that a horn-shaped structure is formed by ions expressed by the extended theory, we perform test particle simulations. The method for test particle simu-lations is as follows. Before test particle simusimu-lations, we perform a particle simulation by using the PASMO code and obtain the electromagnetic field data under a steady state of magnetic reconnection. The equations of motion for test ion particles are calculated in the given electromag-netic field.
We trace the motions of 60,000 test ion particles, and demonstrate the positions of the ion particles at various times (a)ωpiτ =0, (b) 60, (c) 120, and (d) 240 in Fig. 4. For distinguishing the time in the test particle simulation from the time in the particle simulations by the PASMO code, we use τ as the time in the test particle simula-tion. The panel (a) shows that the initial positions of the test ions are set on the upper-side upstream boundary
y/(c/ωpi)=1.31 and on the lower-side upstream boundary
posi-Fig. 4 Positions of the ion particles calculated by a test particle simulation at various times. The black and blue points denote the ions coming from the upper-side and lower-side upstream boundaries, respectively.
tions are on the upper- and lower-side upstream boundary, respectively. Each test ion has an initial velocity equal to the ion fluid velocity, which has been obtained by the par-ticle simulation, at each local position. Atωpiτ=60 (the panel (b)), the ions from the upper-side upstream move in the−ydirection, and the ions from the lower-side upstream move in theydirection. Atωpiτ=120 (the panel (c)), the black and blue points mix. Hence, we can find that the ions coming from both sides converge and co-exist in the same region. Atωpiτ =240 (the panel (d)), which is the termination time of the test particle simulation, a large part of ions already escaped from the simulation domain across the downstream boundary.
We would like to explain that the formation of a horn-shaped structure is responsible for ions coming from the lower-side upstream. We plot the orbit, velocity, and ki-netic energy of a typical ion particle in Fig. 5. Here, we call an ion particle described by the extended theory “EX-ion,” while we call an ion expressed within the basic theory “BS-ion.” The solid lines denote a typical EX-ion, and the dashed lines represent a BS-ion, which was introduced in Ref. [13], for comparison.
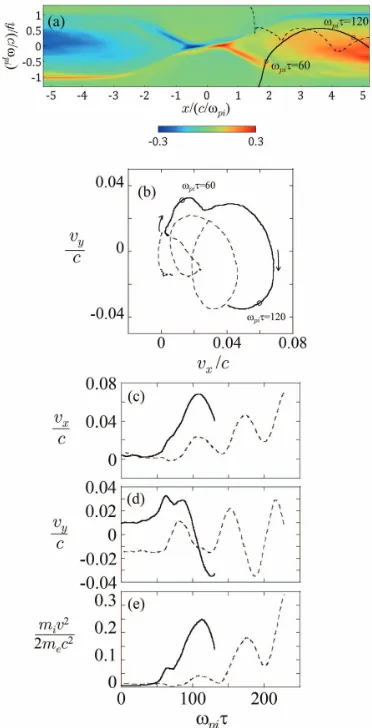
Figure 5 (a) shows the orbits of the ion particles, where the color contours indicate the electric fieldEy. Let us concentrate on the half regionx>0. We find that the lower-side separatrix is wider than the upper-side separa-trix, and a largeEyexists in the lower-side separatrix. The EX-ion is accelerated in theydirection across the lower-side separatrix. In the downstream, the EX-ion moves in thexdirection with oscillating owing to theE×Bdrift and the gyromotion. The amplitude of the gyration is larger
Fig. 5 Motion of an ion particle calculated by a test particle sim-ulation. The panels (a), (b), (c), (d), and (e) plot the orbit in the (x,y) plane, the orbit in the (vx,vy) plane, the time
evolution ofvx,vy, and the kinetic energy, respectively.
The solid and dashed lines denote ions based on the basic and extended theories, respectively. The color contours in the panel (a) indicate the electric fieldEy.
than that for the BS-ion.
Figure 5 (b) shows the ion orbits in the velocity space (vx,vy). When the EX-ion enters the downstream atωpiτ 60, the EX-ion has a largevy. Hence, the velocity circle of the EX-ion is larger than that of the BS-ion.
Further, we plot the time development of velocity componentsvxandvyin Figs. 5 (c) and (d). Atωpiτ60, when the EX-ion enters the downstream, the EX-ion has a small vx and a largevy, which is consistent with the ex-tended theory. After that, vx is increased and vy is de-creased because of the transformation from vy tovx ow-ing to the gyromotion. In contrast, atωpiτ 140, when the BS-ion is in the downstream (This is the re-entry. See Ref. [13] for details.),vxandvy of the BS-ion are small, which is consistent with the basic theory.
EX-ion further gains kinetic energy from the convective electric field, the main component of which isEy. Com-pared with the BS-ion at the same timeτ, the EX-ion has much larger kinetic energy. We can explain the larger in-crease in the kinetic energy of the EX-ion as follows. In both the basic and the extended theories, the electromag-netic field is assumed to be uniform. However, in particu-larEybecomes larger in a deeper downstream (xis larger). The EX-ion moves to the deeper downstream (strongerEy region) earlier than the BS-ion. Hence, at the same timeτ, the kinetic energy of the EX-ion is much larger than that of the BS-ion.
We discuss not only the behavior of a single particle, but also motions of many particles. In the following fig-ures, we display not only the particles which are in a local area at the instanceωpiτ = 240, but the particles which were and are in a local area byωpiτ=240. In other words, we record the particle data everyωpiδτ =3, and treat an identical particle at a past time as a different particle. Thus, it is noted that some particles are displayed in the follow-ing figures multiple times. The reason is as follows. We set all the ion particles on the upstream boundary atωpiτ=0. We do not supply new particles after the initial time. Under a steady state of reconnection, however, particles should continuously flow inward from the upstream with a con-stant flux. Instead of continuous supply of particles from the upstream, we accumulate the temporal sequence data of the particles duringωpiτ = 0 - 240 in order to mimic continuous inflow plasmas under a steady state.
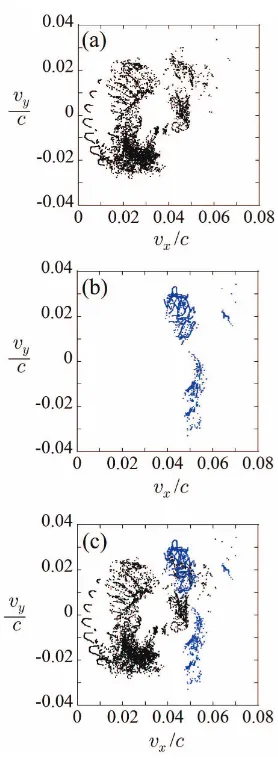
In Fig. 6, we plot velocities (vx,vy) of the particles in-side the local area whose location is the same as the area (A) of Fig. 1. The panels (a) and (b) show the ions from the upper-side upstream and from the lower-side upstream, respectively. A ring-shaped structure is clearly seen in the panel (a) and a horn-shaped structure is found in the panel (b). We can understand that the ions from the upper-side upstream dominantly form the ring-shaped structure and the ions from the lower-side upstream form the horn-shaped structure. The panel (c), which is a superimposed figure of the panels (a) and (b), reproduces the entire struc-ture seen in Fig. 2 (a).
Here, it is noted that horn-shaped structure has a fi-nite width in the direction of the ring center and hence the horn is attached to the ring. The ion velocity distri-butions obtained in our particle simulations also indicate that the horns are attached to the rings. A reason for the attachment of the rings and the horns can be explained as follows. An electrostatic field in the separatrix is not uni-form [11]. Ions from the lower-side upstream pass through slightly different positions in the lower-side separatrix and are accelerated to slightly different entry velocities. Thus, the horn-shaped structure has a finite width in the direction of the ring center and thus is attached to the ring-shaped structure. Discussed in more detail, the acceleration in the
xdirection byEx, which decreases the gyration speed, i.e., the velocity radius in the velocity space as described in
Fig. 6 Positions of the ions inside the local area (A) in Fig. 1 cal-culated by a test particle simulation. The panel (a) shows that the ions from the upper-side upstream form the ring-shaped structure, and the panel (b) displays that the ions from the lower-side upstream form the horn-shaped struc-ture. The panel (c) is a superimposed figure of the panels (a) and (b).
Sec. 3.2, plays a partial role in a finite width of the horn-shaped structure. The same holds true for the basic the-ory. A finite width of the ring also contributes to the at-tachment between the ring and the horn. In the idealized case of the basic theory, the ion entry speed is regarded as zero. However, the entry velocities of ions are small, but not completely zero. The ions have slightly different entry velocities, because a non-uniform electrostatic field, which is weaker than in the lower-side separatrix, exists in the upper-side separatrix. This makes the width of ring-shaped structures be finite.
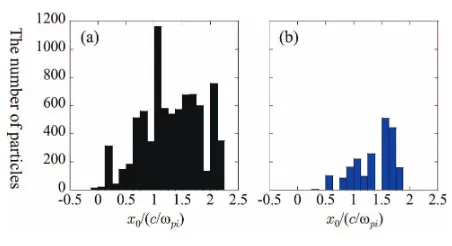
Fig. 7 The number of ion particles vs the initial positions (a) for the ions from the upper-upstream and (b) for the ions from the lower-upstream, inside the local area (A) of Fig. 1.
x-positions of ions which are inside the local area, (a) for the particles from the upper-side upstream and (b) for the particles from the lower-side upstream. Among the total number of ions, the ratio of the ions from the upper-side upstream and from the lower-side upstream are approx-imately 80% and 20%. Ions whose initial positions are within a wide range of−0.013<x0/(c/ωpi)<2.17 (a stan-dard deviation of 0.52) from the upper-side upstream can enter the local area (A), while ions whose initial positions are within a narrow range of 0.190<x0/(c/ωpi)<1.79 (a standard deviation of 0.34) from the lower-side upstream can enter the local area (A). This result would be one of the important factors leading to bias of gyromotion phases of the ions from the lower-side upstream inside the local area. In other words, it would be inevitable that upon en-tering the downstream across the lower-side separatrix, al-most ions obtain gyromotion phases which will occupy the dotted-line box in Fig. 2 (a) when they later arrive at the position of the boxed area (A).
4. Summary
By means of particle and test particle simulations and theory, we have studied a horn-shaped structure of ions in the velocity space in magnetic reconnection with a guide magnetic field. In particle simulations, the horn-shaped structure has been found as an additional structure to a ring-shaped velocity distribution. In our previous works, we have constructed the basic theory explaining the forma-tion process of the ring-shaped structure. In this work, we have improved the basic theory to construct the extended theory for the formation mechanism of the horn-shaped structure. In the basic theory, ions enter the downstream across the separatrix with zero velocity. In the extended theory, ions are accelerated perpendicular to the outflow direction (in the inflow direction) upon crossing the sepa-ratrix, and thus enter the downstream with a finite velocity perpendicular to the outflow. The gyration speed of the ions is larger than that for the basic theory. By means of test particle simulations, it has been confirmed that the mo-tion of ions coming from the lower-side upstream is based
on the extended theory, because a strong electrostatic field exists in the lower-side separatrix (for the x >0 region). Furthermore, test particle simulations have demonstrated that the ions responsible for the extended theory inside a local area have gyromotion phases limited within a nar-row range, and consequently the horn-shaped structure is formed in the velocity space.
In this work, we have focused on the formation pro-cess of anomalous velocity distributions in the downstream region close to the X-point (within∼ 5c/ωpi). A larger-scale simulation, for instance, Ref. [21] indicates that the ion acceleration mechanism is changed in the far down-stream region. In such a far downdown-stream, ion velocity dis-tributions will be changed from the ring-shaped and horn-shaped structures.
Acknowledgments
This simulation work was performed on “Plasma Simulator” (FUJITSU FX100) at the National Institute for Fusion Science. This work was partially sup-ported by a Grant-in-Aid for Scientific Research from the Japan Society for the Promotion of Science (KAK-ENHI 16K17847), the Research Cooperation Program on “Hierarchy and Holism in Natural Sciences” and “Mag-netic Reconnection Studies with Ki“Mag-netic Simulations” at the National Institutes of Natural Sciences, the Gen-eral Coordinated Research at the National Institute for Fusion Science (NIFS17KNWS003, NIFS18KNTS055, NIFS17KNSS100), and “Joint Usage/Research Center for Interdisciplinary Large-scale Information Infrastruc-tures” and “High Performance Computing Infrastructure” in Japan.
[1] M. Yamada, R. Kulsrud and H. Ji, Rev. Mod. Phys.82, 603 (2010).
[2] H.K. Park, N.C. Lühmann Jr., J.H. Donn, I.G.J. Glassen, C.W. Domie, E. Mazzucato, T. Munsat, N.J. van de Pol, Z. Xia and TEXTOR team, Phys. Rev. Lett. 96, 195003 (2006).
[3] Y. Ono, Y. Hayashi, T. Ii, H. Tanabe, S. Ito, A. Kuwahata, T. Ito, Y. Kamino, T. Yamada, M. Inomoto and TS-Group, Phys. Plasmas18, 112113 (2011).
[4] Y. Ono, H. Tanabe, T. Yamada, M. Inomoto, T. Ii, S. Inoue, K. Gi, T. Watanabe, M. Gryaznevich, R. Scannell, C. Michael and C.Z. Cheng, Plasma Phys. Control. Fusion
54, 124039 (2012).
[5] M. Hoshino, T. Mukai, T. Yamamoto and S. Kokubun, J. Geophys. Res.103, 4509 (1998).
[6] M. Hesse, M. Kuznetsova and J. Birn, Phys. Plasmas11, 5387 (2004).
[7] J.F. Drake, P.A. Cassak, M.A. Shay, M. Swisdak and E. Quataert, Astrophys. J.700, L16 (2009).
[8] C.Z. Cheng, S. Inoue, Y. Ono and R. Horiuchi, Phys. Plas-mas22, 101205 (2015).
[9] S. Zenitani, H. Hasegawa and T. Nagai, J. Geophys. Res. Space Physics122, 7396 (2017).
Plasmas25, 122111 (2018).
[11] M. Hesse, C. Norgren, P. Tenfjord, J.L. Burch, Y.-H, Liu, L.-J. Chen, N. Bessho, S. Wang, R. Nakamura, J.P. Eastwood, M. Hoshino, R.B. Torbert and R.E. Ergun, Phys. Plasmas25, 122902 (2018).
[12] S. Usami, R. Horiuchi and H. Ohtani, Phys. Plasmas24, 092101 (2017).
[13] S. Usami, R. Horiuchi, H. Ohtani, Y. Ono and H. Tanabe, Plasma Fusion Res.13, 3401025 (2018).
[14] W. Pei, R. Horiuchi and T. Sato, Phys. Rev. Lett. 87, 235003 (2001).
[15] H. Ohtani and R. Horiuchi, Plasma Fusion Res. 4, 024 (2009).
[16] R. Horiuchi and T. Sato, Phys. Plasmas4, 277 (1997).
[17] N. Aunai, G. Belmont and R. Smets, J. Geophys. Res.116, A09232 (2011).
[18] R. Horiuchi, S. Usami and H. Ohtani, Plasma Fusion Res.
9, 1401092 (2014).
[19] J.R. Wygant, C.A. Cattell, R. Lysak, Y. Song, J. Dombeck, J. McFadden, F.S. Mozer, C.W. Carlson, G. Parks, E.A. Lucek, A. Balogh, M. Andre, H. Reme, M. Hesse and C. Mouikis, J. Geophys. Res.110, A09206 (2005).
[20] L.-J. Chen, N. Bessho, B. Lefebvre, H. Vaith, A. Fazakerley, A. Bhattacharjee, P.A. Puhl-Quinn, A. Runov, Y. Khotyaintsev, A. Vaivads, E. Georgescu and R. Torbert, J. Geophys. Res.6, A12213 (2008).