R E S E A R C H A R T I C L E
Open Access
Applying machine learning to predict
future adherence to physical activity
programs
Mo Zhou
1*, Yoshimi Fukuoka
2, Ken Goldberg
3, Eric Vittinghoff
4and Anil Aswani
5Abstract
Background:Identifying individuals who are unlikely to adhere to a physical exercise regime has potential to improve physical activity interventions. The aim of this paper is to develop and test adherence prediction models using objectively measured physical activity data in the Mobile Phone-Based Physical Activity Education program (mPED) trial. To the best of our knowledge, this is the first to apply Machine Learning methods to predict exercise relapse using accelerometer-recorded physical activity data.
Methods:We use logistic regression and support vector machine methods to design two versions of a Discontinuation Prediction Score (DiPS), which uses objectively measured past data (e.g., steps and goal
achievement) to provide a numerical quantity indicating the likelihood of exercise relapse in the upcoming week. The respective prediction accuracy of these two versions of DiPS are compared, and then numerical simulation is performed to explore the potential of using DiPS to selectively allocate financial incentives to participants to encourage them to increase physical activity.
Results:we had access to a physical activity trial data that were continuously collected every 60 sec every day for 9 months in 210 participants. By using the first 15 weeks of data as training and test on weeks 16–30, we show that both versions of DiPS have a test AUC of 0.9 with high sensitivity and specificity in predicting the probability of exercise adherence. Simulation results assuming different intervention regimes suggest the potential benefit of using DiPS as a score to allocate resources in physical activity intervention programs in reducing costs over other allocation schemes.
Conclusions:DiPS is capable of making accurate and robust predictions for future weeks. The most predictive features are steps and physical activity intensity. Furthermore, the use of DiPS scores can be a promising approach to determine when or if to provide just-in-time messages and step goal adjustments to improve compliance. Further studies on the use of DiPS in the design of physical activity promotion programs are warranted.
Trial registration:ClinicalTrials.govNCT01280812Registered on January 21, 2011.
Keywords:Physical activity, Exercise relapse, Adherence, Machine learning
© The Author(s). 2019Open AccessThis article is distributed under the terms of the Creative Commons Attribution 4.0 International License (http://creativecommons.org/licenses/by/4.0/), which permits unrestricted use, distribution, and reproduction in any medium, provided you give appropriate credit to the original author(s) and the source, provide a link to the Creative Commons license, and indicate if changes were made. The Creative Commons Public Domain Dedication waiver (http://creativecommons.org/publicdomain/zero/1.0/) applies to the data made available in this article, unless otherwise stated. * Correspondence:[email protected]
1Department of Industrial Engineering and Operations Research, University of
Background
Despite the health benefits of physical activity, adherence to physical activity programs can be challenging. Low adher-ence to a prescribed physical activity regime can signifi-cantly diminish the short- and long-term benefits of such programs. Factors that are associated with adherence are barriers for activity, self-efficacy, exercise history, health condition, stress, social support, physical environment, and cognitive activities [1–4]. Early prediction of individuals who are likely to relapse can significantly improve adher-ence to physical activity interventions. However, continu-ously measured objective physical activity data are rarely available to researchers to develop such prediction models. For example, the NHANES 2003–2004 and 2005–2006 studies include only 7 consecutive days of accelerometer-measured data in 9601 adults and 5030 children [5,6]. For-tunately, we had an opportunity to access to the physical activity trial data that were continuously collected every 60 sec every day for 9 months in 210 participants [7].
Adherence can vary on a day-to-day basis with even usually-adherent individuals having temporary relapses [8]. Inadequate skills and knowledge for high-risk situa-tions are a leading factor in temporary relapse. Such re-lapse often results in an“abstinence violation effect” that leads to a perceived loss of control and eventually total re-lapse [9–11]. Much work on predicting adherence has fo-cused on the use of sociodemographics and self-reported questionnaire data [12–14]. However, real-time data col-lection such as from electronic health records (EHR), wearable devices, or mobile phones can potentially in-crease the prediction accuracy of adherence. One ap-proach [15] used EHR data to construct a Markov chain model to predict medication adherence, where the model states were frequency of taking medication. Unfortunately, this kind of model is not applicable to personalized inter-ventions where adherence is measured relative to a base-line that varies for each individual. Another approach [16] used mobile data to construct a utility-function model of behavior in weight loss programs. Though the model is personalized to the baseline physical activity of each indi-vidual, this model predicts future physical activity and not adherence. Given the potential value of predicting adher-ence to medical treatments using EHR and mobile data, there is a need for the development and validation of new models that can make such predictions.
Review of Mobile technologies and physical activity Physical activity promotion programs can benefit from ad-herence predictions. The 2018 National Physical Activity Guidelines for American recommend that adults engage in at least 150 min to 300 min a week of moderate-intensity, or 75 min to 150 min a week of vigorous-intensity aerobic physical activity, or an equivalent combination of moderate-and vigorous-intensity aerobic activity [17]. However,
objectively measured physical activity data indicated that only a small proportion of American adults met the guide-lines [18]. Furthermore, physical activity programs suffer from exercise relapses and low adherence, which hinders individuals from meeting the guidelines. Despite the poten-tial of leveraging mobile technologies with activity trackers and wearable devices to provide accurate real-time mea-surements of physical activity and deliver interventions to encourage adherence, [19–22] the capacity of these tech-nologies in automating and personalizing physical activity promotion programs is only beginning to be explored. Re-cent studies have found that mobile-based lifestyle modifi-cation programs with a reduced number of coaching sessions can achieve statistically significant increases in physical activity [23–34]. Encouraged by this success, a more recent question is whether it is feasible to use mobile technologies to deliver fully-automated or nearly-fully-auto-mated physical activity promotion programs. One study [23] sent personalized messages based on self-reported as-sessments, but did not use objectively measured data for personalization. Our prior study, a fully-automated physical activity intervention with a personalized goal setting feature, validated the feasibility of adopting additional levels of auto-mation to improve the efficacy of such programs in a cost-effective way [35]. Full automation can enable further scal-ing of these programs to larger populations and accurate prediction of adherence is important.
Review of warning scoring in healthcare
Several warning scores have been developed in healthcare for the purpose of predicting adverse medical events at an early stage so that medical interventions can be delivered before significant patient state deterioration occurs. Early Warning Scoring (EWS) is a popular system for bedside patient assessment [36–38]. It is based on the physiologic assessment of multiple vital signs (e.g., respiration, heart rate, body temperature, etc.) and abnormal observations, which trigger immediate notifications that lead to early in-terventions to prevent critical events from happening. Val-idated EWS algorithms are also used to provide guidance for optimizing patient management and guiding resource allocation within healthcare organizations [39,40].
Despite the wide adoption of EWS systems in critical care medicine, similar types of warning scores have not been developed for or applied to physical activity inter-ventions. Since exercise relapse tends to hinder further participation in physical activity, an early warning scor-ing system with accurate predictions on exercise relapse can be used to guide the provision of immediate inter-ventions and has the potential to increase adherence.
Aims
of a Discontinuation Prediction Score (DiPS), which uses each individual’s past data (e.g., physical activity dur-ation, physical activity intensity and goal achievement) to assign a numeric value that quantifies their likelihood of discontinuing physical activity in the upcoming week. The potential utility of DiPS is to provide guidance for provision of just-in-time interventions for individuals who are more likely to have an exercise relapse. We con-ducted a simulation to compare the cost-effectiveness of a DiPS-based policy in promoting adherence. To the best of our knowledge, this is the first to apply Machine Learning methods to predict exercise relapse using ac-celerometer-recorded physical activity data.
This paper is organized as follows: We first describe the dataset of the Mobile Phone-Based Physical Activity Education program (mPED). Then we describe our
fea-ture engineering procedure, where the raw data for each individual is converted into a set of summary statistics for each individual. Next, we define two versions of DiPS using logistic regression and SVM, and quantify the pre-diction accuracy of DiPS using an out-of-sample evalu-ation methodology. Lastly, we discuss how DiPS can be integrated into physical activity promotion programs and present a simulation to explore the potential benefit of using DiPS-based interventions to increase adherence in a cost-effective way.
Methods
Study design and data description
This is a secondary data analysis of the mPED study which is a randomized controlled trial (RCT). The main results of the trial were published in [7]. The study protocol was approved by the University of California, San Francisco Committee on Human Research (CHR) and the mPED Data and Safety Monitoring Board.
The mPED dataset
In this paper, we used the data of 210 community dwell-ing physically inactive women, age 25 to 69 years. In brief, this mPED trial was an unblinded, parallel ran-domized controlled trial (RCT) conducted with three groups (CONTROL, REGULA, and PLUS groups). The trial consisted of a 3-week run-in period, a 3-month intervention period using the app, accelerometer, and brief counseling to increase physical activity, and a 6-month maintenance period using accelerometer (and the app) to maintain activity. The run-in period was con-ducted to collect average baseline physical activity (daily steps and MVPA). The CONTROL group was asked to use an accelerometer for the entire 9-month (36-week) study period, but did not receive any physical activity intervention. In contrast, the REGULAR and PLUS groups received the identical physical activity interven-tion, consisting of accelerometer, brief in-person
counseling sessions, and mPED trial app for the first 3 months (12 weeks). Once registering each participant’s average baseline daily steps onto the mPED trial app, the app started displaying her weekly daily step goals which were set to increase at a 20% rate from her average base-line daily steps. Once her daily step goals reached 10,000 steps, she was asked to maintain at least 10,000 steps per day, 7 days a week during the remaining study period. Personalized automated feedback was provided daily via the mPED trial app. In the 6-month (24-weeks) mainten-ance period, the PLUS group kept both the mPED trial app and accelerometer, while the REGULAR group kept using only the accelerometer. The overall participant re-tention rate was 97.6% at 9 months (36 weeks)[7]. In the mPED trial, physical activity was measured using a tri-axial accelerometer (HJA-350IT, Active style Pro, Omron Healthcare Co., Ltd.). This accelerometer has been previously validated [41, 42]. The accelerometer automatically reset the count each midnight,and allowed participants to view their counts for the past 7 days dur-ing the 3-month intervention and 6-month maintenance period. They were instructed to place the accelerometer on the waist in line with the middle of the thigh of their dominant leg and wear it from the time they got up in the morning until they went to bed at night every day except when showering, bathing, swimming, or sleeping at night. Activity data from the most recent 150 days were automatically stored and directly downloaded to a computer in our research office. The following types of physical activity data were collected:
METs data
The mean intensity value of a 1-min epoch is calculated as the average value of six 10s epochs. Based on the METs recordings, physical activity is automatically clas-sified as no measurement, lifestyle activity and walking activity. Moderate to vigorous intensity physical activity (MVPA) is METs≥3.
Steps data
The accelerometer provides information on the steps value of a 1-h epoch and daily steps.
Features
We extracted a set of interpretable features from the ob-jectively measured physical activity data. For each par-ticipant, we defined the following features:
1. Week numbert: the number of weeks in the study. 2. Average daily steps: average of daily steps from the first day of the run-in period to the last day of week
t−1.
4. Last week average daily steps: average of daily steps in weekt−1.
5. Average goal achieving percentage: percentage of step goals achieved from the first day of the run-in period to the last day of weekt−1.
6. Last week goal achieving percentage: percentage of step goals achieved in weekt−1.
7. Average MVPA minutes in the morning: average number of minutes with METs≥3 in the morning (3:00–9:59) from the first day of the run-in period to the last day of weekt−1.
8. Initial MVPA minutes in the morning: average number of minutes with METs≥3 in the morning (3:00–9:59) in the run-in period.
9. Last week MVPA minutes in the morning: average number of minutes with METs≥3 in the morning (3:00–9:59) in weekt−1.
10. Average MVPA minutes in the afternoon: average number of minutes with METs≥3 in the afternoon (10:00–14:59) from the first day of the run-in period to the last day of weekt−1.
11. Initial MVPA minutes in the afternoon: the average number of minutes with METs≥3 in the afternoon (10:00–14:59) in the run-in period.
12. Last week MVPA minutes in the afternoon: average number of minutes with METs≥3 in the afternoon (10:00–14:59) in weekt−1.
13. Average MVPA minutes in the evening: average number of minutes with METs≥3 in the evening (15:00–3:00) from the first day of the run-in period to the last day of weekt−1.
14. Initial MVPA minutes in the evening: average number of minutes with METs≥3 in the evening (15:00–3:00) in the run-in period.
15. Last week MVPA minutes in the evening: average number of minutes with METs≥3 in the evening (15:00–3:00) in weekt−1.
16. Average MVPA intensity: average METs readings for METs≥3 from the first day of the run-in period to the last day of weekt−1.
17. Initial MVPA intensity: average METs readings for METs≥3 in the run-in period.
18. Last week MVPA intensity: the average METs readings for METs≥3 in weekt−1.
Daily steps reflect the participant’s overall daily phys-ical activity. Goal-achieving percentage demonstrates the participant’s response to step goals. MVPA in different time in day expresses the preferred time in day of per-forming MVPA, and MVPA intensity is coarsely indica-tive of the type of physical activity performed. We separated a day into three intervals: morning (3:00–9: 59), afternoon (10:00–14:59), and evening (15:00–3:00) because prior clustering analysis on this dataset [43]
identified three clusters of individuals who tend to do physical activity in the morning (3:00–9:59), afternoon (10:00–14:59), and evening (15:00–3:00), respectively.
Restated, our defined set of features includes daily steps, goal-achieving percentage, MVPA in the morning, MVPA in the afternoon, MVPA in the evening and MVPA intensity: The complete set of features includes all 18 features listed above, where we included the set of features for the run-in period, in the last week and over the entire study period. The set of features for the run-in period are run-included to account for the run-initial differ-ences between participants. The features on last week behavior capture the immediate past performance. The features on average behavior demonstrate the overall performance of the participant so far during the study. The week number is included to model the changes in behavior over time.
Analytical methods
In this section, we first define the Discontinuation Pre-diction Score (DiPS) in the context of a clinical trial. Then we move on to introduce the statistical models (i.e., logistic regression and Support Vector Machine) used to develop this score.
DiPS definition
DiPS aims to predict the probability of having exercise relapse (binary) for a particular participant at each week of a physical activity promotion program based on re-corded physical activity data in the early weeks. DiPS outputs a score (between 0 and 1) to suggest how likely is the participant to have an exercise relapse for the fol-lowing week. For this paper, we use [0,1] as the interval for DiPS since the model output is a probability. We fur-ther define that a participant is having an exercise re-lapse in a given week if the average steps in that week is lower than the average steps in the run-in period. The reason we use the run-in period average is that the mPED trial was designed so that true baseline steps data is collected from each participant during the run-in period. Since the aim of these programs is to increase participants’ daily steps, comparison with the run-in average serves as a useful signal reflecting the progress of the participant.
run-in average steps. Therefore in the training phase, DiPS can be regarded as a binary variable (since it is ei-ther 0 or 1). But in the prediction phase, DiPS is a con-tinuous variable in the range of [0,1], indicating the likelihood of achieving an above run-in step in the fol-lowing week.
Pre-processing
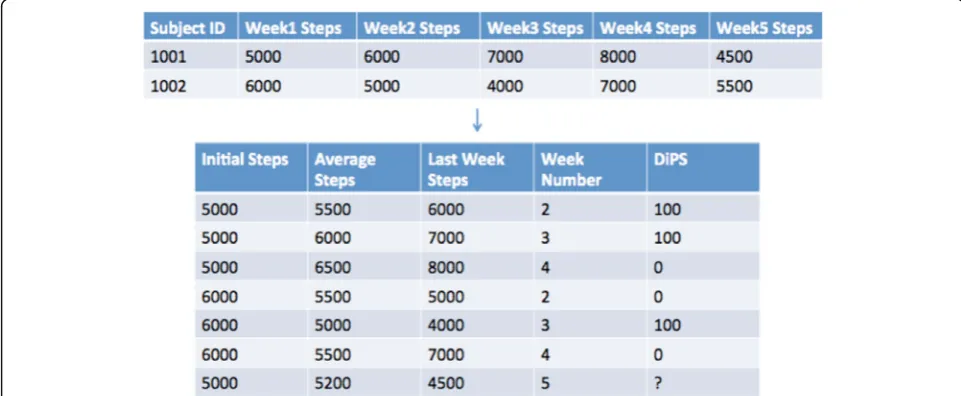
Recall that the mPED dataset contains 210 participants. If we regard each participant as a single data point, our sample is too small for the model to learn. Therefore, we first augmented the training data by assuming that the relationship between weeki and i +1is independent of the relationship between week j and j +1 for i≠j, and under this assumption, we can augment the training data to include features for each participant for each observed week. For instance, assume we are at weeknof the study and we want to train the model, then instead of using a single observation for each participant using data in week n−1 as the response variable, our new approach creates a set of observations for the participant, where each observation uses data in week 3, 4, ..,n−1as the response variable and the corresponding features are from weeks prior to that week. For example, suppose we are at the end of week 5 of the study and would like to generate observations for participant 1001. Then the augmented training data contains 3 observations for par-ticipant 1001, i.e., the complete set of features for week 2, 3 and 4; and the response variable is the observed DiPS of participant 1001 in week 3, 4 and 5 respectively, i.e., 0 if the participant’s average step in that week is below the participant’s average step in the run-in period,
1 otherwise. Figure 1 illustrates a simplified example of this training data augmentation procedure.
Statistical models
We developed two versions of DiPS using logistic regres-sion (LR) and Support Vector Machine (SVM). These two methods are standard machine learning methods for classification. We used these two methods because they are well-established off-the-shelf methods. LR has strong interpretability which is important for model validation and SVM is served as a validation method to evaluate the robustness of this modeling approach to physical ac-tivity data. Tree-based models are not evaluated in this paper because their feature importance is difficult to in-terpret and different evaluation methods can lead to drastically different feature importance ranking.
Logistic regression
Since our response variable (exercise relapse or not) is binary, our problem is a classification problem. There-fore, logistic regression is a favorable statistical approach because it has high interpretability and works well in practice. Logistic regression models the log-odds using an affine function.
The output of a prediction of the logistic regression model for a given set of estimated parameters is a numerical value indicating the likelihood of exercise relapse. In addition to prediction, a fitted logistic re-gression model can be valuable for interpretation, be-cause we can identify the importance of features by considering their corresponding coefficients. We used the glm function with the binomial family in R [44] for LR implementation.
SVM
Support Vector Machine (SVM) is a classification method that uses separating hyperplanes. SVM selects the hyperplane that gives the largest maximum distance to the training examples. We used the svm function in the e1071 package in R [44] for SVM implementation, and [45] provides more theoretical details about the SVM method.
Train and test data
We trained the models using the preprocessed data col-lected in the first 15 weeks of the study. Then we used the trained model to predict exercise relapse for weeks 16–30. We compared our logistic regression (LR) model with 18 extracted features to the SVM model to demon-strate prediction accuracy.
Simulation
In order to explore the potential benefit of using DiPS-based intervention, we used simulation to compare a DiPS-based intervention to a random intervention and a steps-based intervention, by assuming a simple dynamic step model with financial incentives. Our model assumes that for each participant, his/her steps for day n +1 is determined as follows:
stepsnþ1 ¼α∙stepsnþCþϵ
where α is the correlation between steps for day n and steps for day n + 1, andCis a constant. Here,ϵis a ran-dom variable that captures day-to-day fluctuations in physical activity, and we use the model that ϵ is a uni-form distribution with range−E to E for a constant E. We further assume that steps0is the average steps
dur-ing the run-in period. We used the mPED data to fit the above model for each participant so that thei-th partici-pant has model parameters {αi,Ci,Ei}. We used these parameters when conducting our simulation.
In the simulation, we compare the number of adherent participants after a 3-month intervention period, where adherence is as defined in the methodology section: a participant is adherent if his/her steps in the latest week is greater or equal than his/her steps in the run-in period. We consider the following three policies for an intervention to increase adherence:
1. Random intervention: the probability of giving intervention for a given day and a given participant isp∗.
2. Step based intervention: give intervention if observed daily step is below some thresholdstep∗. 3. DiPS based intervention: give intervention if
predicted DiPS score is below some thresholdDiPS∗.
For simplicity, we assume the intervention is a financial incentive (i.e., some dollar value for each intervention) and that giving the intervention will lead to an increase of 500 steps for that day. (The actual responsiveness to a fixed financial incentive will vary for each participant, and this sensitivity can be adaptively estimated for each par-ticipant using machine learning [16,46]. We did not esti-mate this sensitivity for the simulation because financial incentives were not used in the mPED trial, and so the data needed to be able to estimate sensitivity is not avail-able.) Therefore, after the parameter estimation phase, we use the resulting parameters to simulate data for a new study using one of the three intervention policies. For-mally, we have:
stepnþ1¼α∙stepnþCþϵþ500un
where un follows one of the three intervention policies described above:
1. unhas a Bernoulli distribution with success probabilityp∗.
2. un¼ 1;if stepn−1<step
0;otherwise
3. un¼ 1;if DiPSn<DiPS
and n mod7is1ði:e:;first day of weekÞ 0;otherwise
For this simulation, DiPS is computed using the steps data and the week number since we do not observe the other features. Also, the first two policies are assessed daily, while the DiPS policy is assessed weekly and its intervention occurs only on the first day of the week when the predicted DiPS is smaller than the threshold. We select a sequence of values for p∗,step∗,DiPS∗, com-pute spending for each scenario and compare adherence results under the three policies for the set of thresholds with comparable total spend.
Results
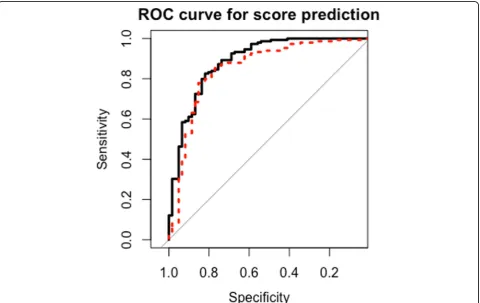
thresholds for the two models both have high accuracy (> 80%) and high specificity (>80%).
Table 2 displays the confusion matrix of the observed and predicted class for week 20 using the LR model with a threshold of 0.5 (this is an example threshold, and not ne-cessarily the optimal). DiPS obtains an accuracy of 85% (179) and a specificity of 67% (141). The prediction accur-acies in other weeks are comparable to week 20, confirming the overall robustness of the model. Note the above analysis was conducted on all participants, disregarding the randomization group. Therefore, we conducted additional analysis to evaluate whether the performance of the algo-rithm is consistent with different randomization groups. We conducted the ROC and AUC analysis for each of the individual groups on their test data from weeks 16–30 and
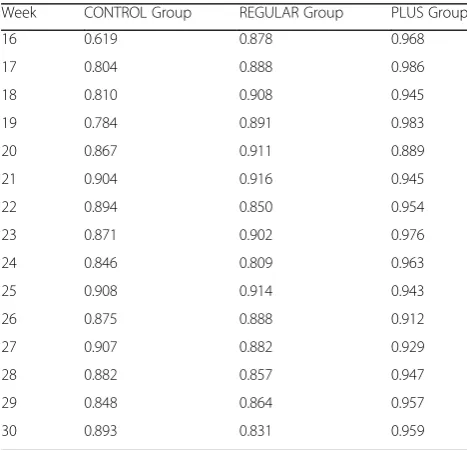
present the results in Table3. The outcome indicates that in the beginning weeks of the maintenance period, the test AUC of the CONTROL Group is lower than that of the other two groups. But toward later weeks, the test AUC of the CONTROL group increases. The PLUS group has the highest test AUC for all weeks during the maintenance period, except for week 20. The test AUC on the REGU-LAR group is between those of the CONTROL group and the PLUS group for 5 of the 20 weeks.
Model interpretation
An advantage of using LR as the machine learning methods is its interpretability. For a fitted LR, the import-ance of each feature can be assessed using the coefficients.
Table 1Test AUC for predicting weeks 16–30 using the fitted model
Week 16 17 18 19 20 21 22 23
LR 0.932 0.861 0.900 0.893 0.892 0.925 0.884 0.916
SVM 0.905 0.866 0.886 0.879 0.882 0.900 0.862 0.894
Week 24 25 26 27 28 29 30 Mean
LR 0.876 0.920 0.912 0.900 0.900 0.915 0.899 0.902
SVM 0.825 0.900 0.904 0.885 0.905 0.889 0.899 0.886
Table 4 shows the feature importance for the fitted LR model using data collected during the first 15 weeks. Week number is highly significant (p-value<0.001), and the negative coefficients indicate that as the study pro-gressed, participants were more likely to have exercise re-lapses. Initial steps, mean steps and last week steps are also all highly significant in predicting exercise relapse (p -value <0.001). In addition to steps, physical activity intensity turns out to be a predicative feature. The positive coefficient of last week intensity indicates that if a partici-pant was doing higher intensity physical activity, she was less likely to have an exercise relapse.
Simulation
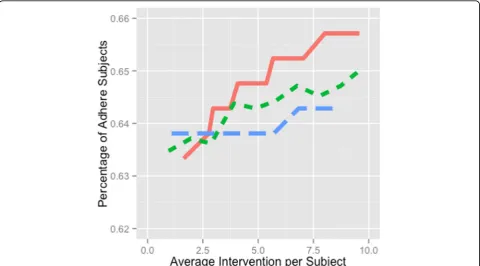
By assuming a simple dynamic step model with financial incentives, we used simulation to compare a DiPS-based intervention to a random intervention and a step-based intervention. Figure 3shows the percentage of adherent participants versus number of interventions per partici-pant for the three intervention policies. The steps policy (blue longer dash line) leads to the largest percentage of adherent participants when on average less than 2.6
interventions were delivered to each participant. As we increase the number of interventions, the DiPS policy (red solid line) leads to the largest percentage of adhere participants. The random policy (green short dash line) and steps policy (blue longer dash line) have lower per-formance, and the random policy appears to perform slightly better than the step-based policy.
Discussion
Accuracy and interpretation of DiPS
The results of our model suggest that DiPS has test ac-curacy around 80% and makes robust predictions across different weeks in this study sample. This suggests that DiPS could be a useful scoring for researchers and clini-cians to tailor and adapt physical activity interventions to prevent exercise relapses. Note that this paper is less focused on finding the “best” ML method for this pre-diction problem, but rather validating that ML methods can be applied to the physical activity domain with high robustness. As a next step, we will evaluate/validate this framework against other ML methods, such as tree-based models.
The most predictive features coming out of the LR DiPS model are: week number, steps data (including initial aver-age daily steps, averaver-age daily steps, last week steps), and physical activity intensity data. In contrast, preferred MVPA time in day was not significant. Furthermore, the coefficient
Table 2Confusion matrix of the observed and predicted class for week 20 using the augmented Logistic Regression approach with a threshold of 0.5
True Class
Relapse Not Relapse Total
Predicted class Relapse 25% (53) 23% (49) 102
Not Relapse 4% (8) 48% (100) 108
Total 61 149 210
Table 3Test AUC for predicting weeks 16-30 for each group using the fitted model
Week CONTROL Group REGULAR Group PLUS Group
16 0.619 0.878 0.968
17 0.804 0.888 0.986
18 0.810 0.908 0.945
19 0.784 0.891 0.983
20 0.867 0.911 0.889
21 0.904 0.916 0.945
22 0.894 0.850 0.954
23 0.871 0.902 0.976
24 0.846 0.809 0.963
25 0.908 0.914 0.943
26 0.875 0.888 0.912
27 0.907 0.882 0.929
28 0.882 0.857 0.947
29 0.848 0.864 0.957
30 0.893 0.831 0.959
Table 4Feature importance for the fitted augmented Logistic Regression model for week 20
Feature Coefficient P-value
Intercept 1.378 0.033
Week number −0.122 <0.001
Initial average daily steps −0.001 <0.001
Average daily steps 0.0008 <0.001
Last week average daily steps 0.0004 <0.001
Initial MVPR morning −0.029 0.138
Initial MVPR afternoon 0.027 0.041
Initial MVPR evening 0.015 0.242
Average MVPR morning 0.067 0.02
Average MVPR afternoon −0.037 0.103
Average MVPR evening 0.005 0.805
Last week MVPR morning −0.032 0.058
Last week MVPR afternoon 0.001 0.920
Last week MVPR evening −0.003 0.797
Initial MVPA intensity −0.158 0.479
Average MVPA intensity −0.354 0.280
Last week MVPA intensity 0.515 <0.001
Average goal achieving percentage 0.161 0.849
of initial average daily steps is negative, indicating that par-ticipants with a higher physical activity level during the run-in period tended to have exercise relapse more often on average. This is intuitive since we define exercise relapse to be a comparison between current week steps and initial steps, thus higher initial steps means a more difficult base-line to beat. Furthermore, last week daily steps and average daily steps have positive coefficients, indicating that partici-pants who were more active in the last week and over the entire study period were less likely to have exercise relapses.
Efficient resource allocation using DiPS
The potential of DiPS to provide real-time feedback for generating just-in-time interventions for individuals likely to have an exercise relapse was explored through a simula-tion that compared the cost-effectiveness of different pol-icies to allocate financial incentives to encourage selected individuals to increase their physical activity (Fig.3).
Simulation outcome indicates that a DiPS-based inter-vention is more effective in enhancing adherence, compared to step-based and random interventions. Real-time interventions that improve adherence through mo-bile devices have not yet been implemented in physical activity intervention studies. Cadmus-Bertram conducted
a study to track adherence using Fitbit, but no interven-tion was given in accordance to the collected data [46]. Other studies introduced human moderation to monitor adherence, and then schedule in-person sessions or intervention calls to improve adherence [47, 48]. How-ever, it is important to note that the simulation makes many assumptions and is conducted to explore the benefit that could potentially result, rather than to valid-ate the model. Thus an empirical study is warranted to confirm the simulation findings.
Incorporation of DiPS into physical activity promotion programs
DiPS can be potentially incorporated into mobile tech-nology based physical activity promotion programs that collect real-time activity data. With the recent rapid de-velopment of motion sensors and wearable devices, pre-diction models, such as DiPS, using real-time activity data, will allow researchers and clinicians to provide automatically generate individualized, just-in-time inter-ventions. For example, intervention messages can be de-livered through push notifications for app-based programs or through text messages. Such interventions can be triggered automatically when a low DiPS is pre-dicted. The content of such interventions can provide an
interactive dialog to identify the reason for relapse and provide personalized suggestions. In addition, DiPS can also assist in adjusting automated, personalized goals where future step goals are reduced for those who are ready to experience exercise relapse. In our recent trials, like other trials, we found that personalized automated personalized goal setting is more effective than standard goal setting [35, 49–53]. Thus, DiPS has great potential. However, several limitations need to be acknowledged. First, the trial data used in this paper were collected from only physically inactive female adults. Thus, DiPS scoring will need to be tested and validated in other populations, such as male adults and children. Second, since we did not have objectively measured physical ac-tivity data beyond 9 months, prediction of DiPS scoring beyond this time period might be lower than our find-ings in this study. Therefore, the efficacy of DiPS scoring for physical activity intervention needs to be tested in a full-scale RCT in the near future.
Conclusion
DiPS is a machine learning-based score that uses logistic regression or SVM on objectively measured step and goal data, and it was able to accurately predict exercise relapse with a sensitivity of 85% and a specificity of 67%. In addition, simulation results suggest the potential benefit of DiPS as a score to allocate resources in order to hope-fully provide more cost-effective interventions for increas-ing adherence. However, DiPS will need to be validated in larger and different populations, and its efficacy will need to be examined in a full-scale RCT in the near future.
Abbreviations
AUC:Area Under Curve; DiPS: Discontinuation Prediction Score; EWS: Early Warning Score; LR: Logistic Regression; METs: Metabolic Equivalents; mPED: Mobile Phone-Based Physical Activity Education; MVPA: Moderate to vigorous intensity physical activity; RCT: Randomized controlled trial; ROC: Receiver Operating Characteristics; SVM: Support Vector Machine
Acknowledgements
Not applicable.
Authors’contributions
YF, the principal investigator and EV, the principal biostatistician, designed the mPED trial and collected all trial data. MZ and AA analyzed and interpreted the patient data using Machine Learning approaches. AA and KG provided valuable insights on the Machine Learning approach and were major contributors in writing the paper. All authors read and approved the final manuscript.
Funding
This project is supported in part by funding from the UC Center for Information Technology Research in the Interest of Society (CITRIS), and the Philippine - California Advanced Research Institutes (PCARI) grant IIID-2015-07. This project is also supported by a grant (R01HL104147) from the Na-tional Heart, Lung, and Blood Institute, by the American Heart Association, and by a grant (K24NR015812) from the National Institute of Nursing Re-search. The study sponsors had no role in the study design; collection, ana-lysis, or interpretation of data; writing the report; or the decision to submit the report for publication.
Availability of data and materials
The datasets used for this paper are available from the corresponding author on reasonable request.
Ethics approval and consent to participate
The study protocol was approved by the University of California, San Francisco Committee on Human Research (CHR) (IRB Number: 10–04566) and the mPED Data and Safty Monitoring Board. Written informed consent was obtained from all participants. This study was registered with the
clinicaltrials.gov(NCT01280812).
Consent for publication
Not applicable.
Competing interests
The authors declare that they have no competing interests.
Author details
1Department of Industrial Engineering and Operations Research, University of
California at Berkeley, 4141 Etcheverry Hall, Berkeley, CA 94720, USA. 2Department of Physiological Nursing, School of Nursing, University of
California at San Francisco, 2 Koret Way, N631, San Francisco 94143, USA. 3Department of Industrial Engineering and Operations Research & Electrical
Engineering and Computer Sciences, University of California at Berkeley, 425 Sutardja Dai Hall, Berkeley, CA 94720-1777, USA.4Department of
Epidemiology & Biostatistics, School of Medicine, University of California at San Francisco, 550 16th. Street, San Francisco, CA 94158, USA.5Department of Industrial Engineering and Operations Research, University of California at Berkeley, 4119 Etcheverry Hall, Berkeley, CA 94720-1777, USA.
Received: 21 May 2019 Accepted: 6 August 2019
References
1. Gujral S, McAuley E, Oberlin LE, Kramer AF, Erickson KI. The role of brain structure in predicting adherence to a physical activity regimen. Psychosom Med. 2018;80(1):69.
2. Booth ML, Owen N, Bauman A, Clavisi O, Leslie E. Social–cognitive and perceived environment influences associated with physical activity in older Australians. Preventive medicine. 2000;31(1):15-22.
3. Harris TJ, Owen CG, Victor CR, Adams R, Cook DG. What factors are associated with physical activity in older people, assessed objectively by accelerometry? Br J Sports Med. 2009;43(6):442-50.
4. Jefferis BJ, Sartini C, Lee IM, et al. Adherence to physical activity guidelines in older adults, using objectively measured physical activity in a population-based study. BMC Public Health. 2014;14(1):382.
5. Centers for Disease Control and Prevention, National Center for Health Statistics, US Department of Health and Human Services. National Health and Nutrition Examination Survey Data for 2003.https://wwwn.cdc.gov/ nchs/nhanes/continuousnhanes/default.aspx?BeginYear=2003. Accessed 1 Apr 2017.
6. Centers for Disease Control and Prevention, National Center for Health Statistics, US Department of Health and Human Services. National Health and Nutrition Examination Survey Data for 2005.https://wwwn.cdc.gov/nchs/ nhanes/continuousnhanes/default.aspx?BeginYear=2005. Accessed 1 Apr 2017. 7. Fukuoka Y, Haskell W, Lin F, Vittinghoff E. Short- and long-term effects of a
Mobile phone app in conjunction with brief in-person counseling on physical activity among physically inactive women: the mPED randomized clinical trial. JAMA Netw Open. 2019;2(5):e194281 PMID:31125101. 8. Stetson BA, Rahn JM, Dubbert PM, et al. Prospective evaluation of the
effects of stress on exercise adherence in community-residing women. Health Psychol. 1997;16:515–20.
9. Marlatt GA, Gordon JR. Relapse prevention: maintenance strategies in addictive behavior change. New York: Guilford Press; 1985.
10. Simkin LR, Gross AM. Assessment of coping with high-risk situations for exercise relapse among healthy women. Health Psychol. 1994;13(3):274. 11. Marcus BH, Forsyth LH, Stone EJ, et al. Physical activity behavior change:
issues in adoption and maintenance. Health Psychol. 2000;19(1S):32. 12. McCaul KD, Glasgow RE, Schafer LC. Diabetes regimen behaviors: Predicting
13. Stone VE, Jordan J, Tolson J, et al. Perspectives on adherence and simplicity for HIV-infected patients on antiretroviral therapy: self-report of the relative importance of multiple attributes of highly active antiretroviral therapy (HAART) regimens in predicting adherence. J Acquir Immune Defic Syndr. 2004;36(3):808–16.
14. Lin JH, Zhang SM, Manson JE. Predicting adherence to tamoxifen for breast cancer adjuvant therapy and prevention. Cancer Prev Res. 2011;4(9):1360–5. 15. Mason JE, England DA, Denton BT, et al. Optimizing statin treatment
decisions for diabetes patients in the presence of uncertain future adherence. Med Decis Mak. 2012;32(1):154–66.
16. Aswani A, Kaminsky P, Mintz Y, Flowers E, Fukuoka Y. Behavioral modeling in weight loss interventions. Eur J Oper Res. 2019;272(3):1058-72. 17. US Department of Health and Human Services. Physical Activity Guidelines
for Americans; 2018.https://health.gov/paguidelines/second-edition/pdf/ PAG_ExecutiveSummary.pdf. Accessed 10 Mar 2019.
18. Schuna JM, Johnson WD, Tudor-Locke C. Adult self-reported and objectively monitored physical activity and sedentary behavior: NHANES 2005–2006. Int J Behav Nutr Phys Act. 2013;10(1):126.
19. Althoff T, Sosǐc R, Hicks JL, et al. Large-scale physical activity data reveal worldwide activity inequality. Nature. 2017;547(7663):336–9.
20. Case MA, Burwick HA, Volpp KG, et al. Accuracy of smartphone applications and wearable devices for tracking physical activity data. JAMA. 2015;313(6):625–6. 21. Fujiki Y. iPhone as a physical activity measurement platform. InCHI'10
Extended Abstracts on Human Factors in Computing Systems. 2010. (pp. 4315-4320). ACM.
22. Hekler EB, Buman MP, Grieco L, et al. Validation of physical activity tracking via android smartphones compared to ActiGraph accelerometer: laboratory-based and free-living validation studies. JMIR Mhealth Uhealth. 2015;3(2):e36. 23. Bauer S, de Niet J, Timman R, et al. Enhancement of care through
self-monitoring and tailored feedback via text messaging and their use in the treatment of childhood overweight. Patient Educ Couns. 2010;79(3):315–9. 24. Beasley JM, Riley WT, Davis A, et al. Evaluation of a PDA-based dietary
assessment and intervention program: a randomized controlled trial. J Am Coll Nutr. 2008;27(2):280–6.
25. Burke LE, Conroy MB, Sereika SM, et al. The effect of electronic self-monitoring on weight loss and dietary intake: a randomized behavioral weight loss trial. Obesity. 2011;19(2):338–44.
26. Fjeldsoe BS, Miller YD, Marshall AL. MobileMums: a randomized controlled trial of an SMS-based physical activity intervention. Ann Behav Med. 2010;39(2):101–11. 27. Fukuoka Y, Gay CL, Joiner KL, et al. A novel diabetes prevention intervention
using a mobile app: a randomized controlled trial with overweight adults at risk. Am J Prev Med. 2015;49(2):223–37.
28. Fukuoka Y, Vittinghoff E, Jong SS, et al. Innovation to motivation-pilot study of a mobile phone intervention to increase physical activity among sedentary women. J Prev Med. 2010;51(3):287–9.
29. Hurling R, Catt M, De Boni M, et al. Using internet and mobile phone technology to deliver an automated physical activity program: randomized controlled trial. JMIR. 2007;9(2):e7.
30. Joo NS, Kim BT. Mobile phone short message service messaging for behaviour modification in a community-based weight control programme in Korea. J Telemed Telecare. 2007;13(8):416–20.
31. King AC, Ahn DK, Oliveira BM, et al. Promoting physical activity through hand-held computer technology. Am J Prev Med. 2008;34(2):138–42. 32. Patrick K, Raab F, Adams MA, et al. A text message–based intervention for
weight loss: randomized controlled trial. JMIR. 2009;11(1):e1.
33. Riley WT, Rivera DE, Atienza AA, et al. Health behavior models in the age of mobile interventions: are our theories up to the task? Transl Behav Med. 2011;1(1):53–71.
34. Fukuoka Y, Vittinghoff E, Hooper J. A weight loss intervention using a commercial mobile application in Latino Americans—Adelgaza trial. Transl Behav Med. 2018;8(5):714–23.
35. Zhou M, Fukuoka Y, Mintz Y, et al. Evaluating machine learning based automated personalized daily step goals delivered through a Mobile phone app: a randomized controlled trial. JMIR Mhealth Uhealth. 2018;6:e28. 36. Kyriacos U, Jelsma J, Jordan S. Monitoring vital signs using early warning
scoring systems: a review of the literature. J Nurs Manag. 2011;19(3):311–30. 37. McGinley A, Pearse RM. A national early warning score for acutely ill
patients. BMJ. 2012;e5310.
38. Paterson R, MacLeod D, Thetford D, Beattie A, Graham C, Lam S, et al. Prediction of in-hospital mortality and length of stay using an early warning scoring system: clinical audit. Clinical Medicine. 2006;6(3):281–4.
39. Vorwerk C. MEWS: predicts hospital admission and mortality in emergency department patients. Emerg Med J. 2009;26(6):466.
40. Williams B, Alberti G, Ball C, et al. National Early Warning Score (NEWS): standardising the assessment of acute-illness severity in the NHS. London: The Royal College of Physicians; 2012.
41. Oshima Y, Kawaguchi K, Tanaka S, et al. Classifying household and locomotive activities using a triaxial accelerometer. Gait Posture. 2010;31(3):370–4. 42. Ohkawara K, Oshima Y, Hikihara Y, Ishikawa-Takata K, Tabata I, Tanaka S.
Real-time estimation of daily physical activity intensity by a triaxial accelerometer and a gravity-removal classification algorithm. Br J Nutr. 2011; 105(11):1681–91.
43. Fukuoka Y, Zhou M, Vittinghoff E, Haskell W, Goldberg K, Aswani A. Objectively measured baseline physical activity patterns in women in the mPED trial: cluster analysis. JMIR Public Health Surveill. 2018;4(1):e10. 44. R Core Team. R: A Language and Environment for Statistical Computing.
Vienna; 2013. Available from: http://www.R-project.org/. Accessed 10 Mar 2019.
45. Cortes C, Vapnik V. Support-vector networks. Mach Learn. 1995;20(3):273–97. 46. Cadmus-Bertram L, Marcus BH, Patterson RE, Parker BA, Morey BL. Use of
the Fitbit to measure adherence to a physical activity intervention among overweight or obese, postmenopausal women: self-monitoring trajectory during 16 weeks. JMIR MHealth UHealth. 2015;3(4):e96.
47. Rejeski WJ, Axtell R, Fielding R, Katula J, King AC, Manini TM, Marsh AP, Pahor M, Rego A, Tudor-Locke C, Newman M. Promoting physical activity for elders with compromised function: the lifestyle interventions and independence for elders (LIFE) study physical activity intervention. Clin Interv Aging. 2013;8:1119.
48. Goodpaster BH, DeLany JP, Otto AD, Kuller L, Vockley J, South-Paul JE, Thomas SB, Brown J, McTigue K, Hames KC, Lang W. Effects of diet and physical activity interventions on weight loss and cardiometabolic risk factors in severely obese adults: a randomized trial. Jama. 2010;304(16):1795–802.
49. Zhou M, Mintz Y, Fukuoka Y, Goldberg K, Flowers E, Kaminsky P, Castillejo A, Aswani A. Personalizing Mobile Fitness Apps using Reinforcement Learning. In: In: Proceedings of the 23rd International on Intelligent User Interfaces: 2nd Workshop on Theory-Informed User Modeling for Tailoring and Personalizing Interfaces (HUMANIZE); 2018.
50. Munson SA, Consolvo S. Exploring goal-setting, rewards, self-monitoring, and sharing to motivate physical activity. In2012 6th international conference on pervasive computing technologies for healthcare (PervasiveHealth) and workshops. 2012. (pp. 25-32). IEEE. 51. Konrad A, Bellotti V, Crenshaw N, Tucker S, Nelson L, Du H, Pirolli P,
Whittaker S. Finding the adaptive sweet spot: Balancing compliance and achievement in automated stress reduction. InProceedings of the 33rd Annual ACM Conference on Human Factors in Computing Systems. 2015. (pp. 3829-3838). ACM.
52. Adams MA, Sallis JF, Norman GJ, et al. An adaptive physical activity intervention for overweight adults: a randomized controlled trial. PLoS One. 2013;8(12):e82901.
53. Adams MA, Hurley JC, Todd M, et al. Adaptive goal setting and financial incentives: a 2×2 factorial randomized controlled trial to increase adults? Physical activity. BMC Public Health. 2017;17(1):286.
Publisher’s Note