Using item analysis to evaluate the validity and
reliability of an existing online information literacy
skills assessment instrument
Janine Lockhart
1[email protected]
ORCID Id: http://orcid.org/0000-0002-5176-6423
Received 09 February 2015 Accepted: 06 April 2015
At the end of 2012 a short course, the Certificate of Information Literacy, was registered by the Cape Peninsula University of Technology Libraries and was first introduced in 2013. The course consisted of five modules and a summative assessment. The assessment, accessed via the Learning Management System, comprised 100 multiple-choice questions of which students received a randomly selected fifty to answer in ninety minutes. This article reports on the effectiveness and validity of the online assessment for the Certificate of Information Literacy: whether the assessment instrument accurately measures the information literacy skills of the students and whether the test can be considered valid and reliable. There are two parts to the study, but this paper focuses on the first part which is an item analysis on the assessment data of the students who completed the test in 2013. The results highlight weaknesses and problematic areas in the test. The second part of the study will focus on comparing the results students received in the test with the results of a subject-specific essay assignment to measure the level of application of their information literacy skills.
Keywords: Item analysis, information literacy, assessment, higher education, Cape Peninsula University of Technology
1 Introduction
One of the key roles of an academic library is teaching users to find and make sense of information in an information-overloaded society (Kermani 2013: 52). Thus, information literacy education is one of the core functions of a library. The Cape Peninsula University of Technology (CPUT) Council approved an information literacy policy in 2009 which states that all academic programmes at the university “must include a component that offers the student adequate training in the level and use of information skills needed to function within the programme” (CPUT 2009). To support the various faculties in implementing the policy, CPUT Libraries developed a short course, the Certificate of Information Literacy. The course was duly registered with the Centre for Professional and Personal Development (CPPD) and was introduced in 2013.
A reason for registering a short course to assist with the information literacy policy of the university was the need to formalise and standardise the teaching of information literacy skills across all faculties. There was also a desire to increase the number of ‘quality’ contact hours between librarians and students. An increase in quality contact hours would reduce the number of ‘one-shot’ requests from lecturers for an instruction session for their students – these instruction sessions generally do not allow enough time to teach the complete information literacy process. In addition to gaining information literacy skills, students on the short course would be awarded a certificate to add to their portfolio of evidence for when they leave the university. It was thus hoped that a registered information literacy short course would increase the motivation levels of students to attend classes. For the certificate to be awarded there was a need to include in the course a standard, final summative assessment with subject-specific exercises to be done during class. The assessment was developed by CPUT librarians. Teams of two to three librarians were selected to devise twenty relevant questions for each module. In all, the assessment comprised 100 multiple-choice questions. The course was assessed online, with students accessing a test via the Learning Management System (LMS), Blackboard. Students received a random selection of fifty questions to answer in ninety minutes.
The focus of this study was to determine the effectiveness and validity of the online assessment. Based on Venter’s approach (2008: 133), it attempted to determine whether the instrument of assessment accurately measures information literacy skills and whether it can be considered valid and reliable to determine the knowledge levels of participants. The assessment instrument was used for the first time in 2013 as a standard assessment for all students registering for the Certificate of Information Literacy short course. The first part of the study involved an item analysis of the assessment data for those who completed the test during 2013. As stated by Nunnally (1972: 186), an item analysis of the results of a test can guide administrators regarding which questions (items) to revise or discard and which to continue using in future tests. The second part of the study (in process) will involve comparing the results students received in the test with the results of a subject-specific essay assignment to measure the level of application of their information literacy skills. The
subject-specific essay assignment will be assessed with a rubric with a 30% weighting towards testing information literacy skills.
2 Literature review
A report for the Association of College and Research Libraries (ACRL) (Oakleaf 2010: 98) indicated that most academic librarians do not participate in assessment activities. Yet, the report said that it is important for librarians to be aware of “current philosophies and movements in higher education assessment”. Oakleaf (2008: 233) indicated that the “culture of assessment” in higher education institutions means that academic librarians have to show that the information literacy instruction they provide has a positive impact on student learning. Consequently, libraries are now more and more being required to measure student learning outcomes in a meaningful way (Sonntag, 2008). For this, librarians must determine “what students know and are able to do” because of their intervention (Oakleaf 2008: 233). Thus, the continuous measuring of information literacy assessments is crucial but, according to Mery and Newby (2010: 99), librarians should be given the training to do so.
According to Oakleaf (2006:209), there are various assessment tools available, and the choice of assessment will depend on the purpose of the assessment together with the capabilities of the various assessment methods. She indicated that librarians should carefully consider the purpose of assessments, meticulously select assessment tools, and have a clear understanding of different assessment approaches. In a later study, Oakleaf (2009: 541) stated that “assessment for learning theory combines teaching, learning, and assessment activities in ways that produce both more knowledgeable students and more skilled teachers”. It is therefore important to ensure that the correct assessment tool is chosen and that it links to the purpose of the assessment.
The ACRL report (Oakleaf 2010) stressed the importance of academics being made aware of assessment of their students taking place in the library – which they might like to consider counting towards formal courses.
2.1 Multiple-choice questions
The current assessment method used by CPUT Libraries for the summative assessment of the short course, Certificate of Information Literacy, is by multiple-choice questions. The test is administered via the LMS, Blackboard. Some advantages of making use of multiple-choice questions for assessment are that they are easier to score and are very reliable (the reliability increases the longer the test) (Oakleaf 2006: 204). They are also less demanding on time as scoring is done by the LMS, which can collect large amounts of data quickly and provide immediate feedback to students (Oakleaf 2006: 204). Limitations associated with multiple-choice questions are that they often “do not test higher-level thinking skills” and they lack the ability to assess students’ authenticity: according to Oakleaf they “over assess student knowledge and under assess student know-how with knowledge” (Oakleaf, 2006: 205). There is also a danger of “over-simplified test items” being presented (Oakleaf, 2006: 205).
In a study by Walsh (2009: 22)where he reviewed literature about information literacy assessment, multiple-choice questionnaires were by far the most popular method used in tests, but the author indicated that a multiple-choice test of good quality was not simple to produce. The instruments used in an information literacy skills study by Dunaway and Orblych (2010: 27) included a multiple-choice pre-assessment before the training intervention so that the information literacy skills of students could be determined in advance. According to Dunaway and Orblych (2010: 26), a pre-assessment benefits the learner by “reinforcing the material that is the subject of the pre-assessment”. They suggested that an information literacy curriculum and teaching plans could be adapted based on pre-assessment results. In a similar study by Fain (2011: 110), a multiple-choice pre-test and post-test were used. Fain emphasised the importance of these tests relating to the main focus of the instruction session and that they played an important role in measuring what students had learned at the end of the course. The comparisons of multiple-choice pre-test and post-test performance showed how proficient students had become over the course of the semester (Fain 2011: 111).
2.2 Item analysis
Item analysis was performed to check the current multiple-choice assessment that is being used for the Certificate of Information Literacy short course being run by CPUT Libraries. According to Nunnally (1972: 186), item analysis will indicate which test questions (items) to revise or discard and which to continue using in future tests. In a similar study by Venter (2008: 133), test items were analysed for the purpose of deciding which could be used again. Only items meeting the set item analysis criteria formed part of the test going forward. Ondrusek (2005: 392) pointed out that “problematic items” could be identified by counting the frequency of incorrect responses. Mery and Newby (2010: 98) assessed the reliability and validity of a multiple-choice information literacy test: item analysis was performed in order to determine the validity of individual items and how they affected the test as a whole.
3 Methodology
Over 2,756 students registered for the Certificate of Information Literacy course during 2013, and 1,977 students completed the online assessment (71% of registered students). CPUT is made up of eleven campuses, namely Bellville, Cape Town, Granger Bay, Groote Schuur, Mowbray, Media City, Athlone, Tygerberg, Wellington, Worcester and George, each of them with a library on campus. The language of instruction at the Wellington campus is mostly Afrikaans for students in the Education Faculty; for those taking the small number of Business and Management Sciences and Applied Sciences courses on this campus, the language of instruction is English. Therefore, many students from the Wellington campus completed the test in Afrikaans. Test data in Afrikaans were excluded from this study on the basis that the questions could be understood differently in another language which could influence item analysis results. Therefore, the test data of 1,317 students were used for this study. Nunnally (1972: 194) cautioned against using item analysis for a small number of students. He indicated that the number of students should be at least more than forty. In this case, the number of students exceeded the minimum number specified by Nunnally.
3.1 Item difficulty index (IDI)
The index of item difficulty indicates the percentage of students who answered the question correctly (Nunnally, 1972: 186); it is sometimes referred to as the easiness percentage although Nunnally said that ‘easiness percentage’ is a misnomer as the higher the percentage, the easier – rather than more difficult – the item is. As explained by Mery and Newby (2010: 105), “the higher the index value, the lower the difficulty of an item; the lower the index, the greater the difficulty”. The IDI is calculated by adding up the number of students who answered the item correctly (S) and dividing that number by the total number of students (P) (Nunnally 1972: 187). The formula is calculated as:
IDI = S/P
Nunnally (1972) indicated that, for items with up to three answers to choose from, those to keep will have an IDI of 20% to 80%. For items with four or more alternative answers, the range is 35% to 85%. For true/false questions, the range is 60% to 95%.
3.2 Discrimination index (DI)
It is important to “determine the extent to which each item goes along with, or measures the same thing as, the total test in which it is included” (Nunnally 1972: 191). A way to determine the relevancy of items is to identify the top 25% of students (T) in relation to the total test scores, as well as the bottom 25% of students (B). Then, determine the percentages of students in both groups who answered a specific question correctly, where the percentage of top students who answered the question correctly is Tp and the percentage of students in the bottom group who answered the question correct is Bp. Subtract the percentage of the bottom group from the percentage of the top group. The formula is therefore:
DI = Tp – Bp
The DI indicates the extent to which each question contributes towards the total test. Nunnally (1972: 192) indicated that there should be at least a difference of 20% between Tp and Bp. A very small difference shows that the question does not add much value to the test as a whole. Some reasons given by Nunnally (1972: 192) as to why a question may fail are because of ambiguity of meaning, the question’s ease or difficulty, or the incorrect answer erroneously labelled in the system as correct. In most cases, results of the DI will be positive, but in exceptional cases there will be a negative result. In cases like these, more students in the bottom 25% have answered the question correctly than students in the top 25% perhaps, according to Nunnally (1972), because teachers did not select the correct answer or the question was ambiguous.
3.3 Item-to-total correlation (ITT)
In addition to the IDI and DI, the item-to-total correlation was measured. In a test, each student has a score for each question (pass or fail; right or wrong) as well as a total score for the completed test (Nunnally 1972: 193). Venter (2006:14) states that only questions with a correlation of 0.20 and higher should be selected for future use.
3.4 Distribution of answers to alternatives
It is important to look at the answers students selected for each question and compare them to the alternatives available. According to Venter (2006: 14), the distribution of answers to alternatives looks at the percentage of students who selected the various alternative answers (e.g. a, b, c, d, or e). These percentages are used “to determine the distracting ability of the alternatives”. According to Nunnally (1972: 190), the criteria to use for retaining an alternative answer is that at least 5% or more of students should have selected it in a test situation.
4. Results and discussion
4.1 Item difficulty index (IDI)
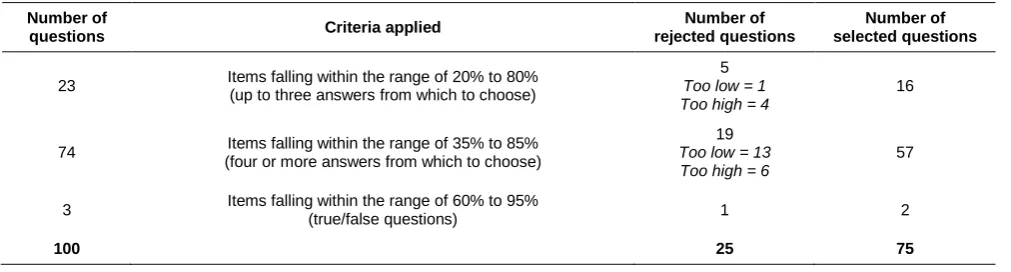
Out of the 100 questions, twenty-three had up to three possible answers, seventy-four questions had four to five possible alternative answers and three questions had true/false alternatives. Table 1 shows the results after applying the criteria that were identified for selection or rejection.
Table 1 IDI results
Number of
questions Criteria applied
Number of rejected questions
Number of selected questions
23 Items falling within the range of 20% to 80% (up to three answers from which to choose)
5 Too low = 1 Too high = 4
16
74 Items falling within the range of 35% to 85% (four or more answers from which to choose)
19 Too low = 13 Too high = 6
57
3 Items falling within the range of 60% to 95%
(true/false questions) 1 2
100 25 75
Therefore, out of the 100 questions where the IDI had been calculated, twenty-five questions were rejected based on the identified selection or rejection criteria. Questions where the percentage was too low meant that very few students answered the questions correctly, possibly indicating that the question was too difficult, that the wording of the question was unclear, or that the incorrect answer was erroneously labelled as the correct answer. Questions where the percentage was too high meant that too many students answered these questions correctly, either because the questions were too easy or that the alternative answers provided were not plausible. Problematic questions in the test were subsequently revisited by the researcher to see whether the questions could be improved upon or should be discarded.
4.2 Discrimination index (DI)
The DI was calculated for all 100 questions. Table 2 indicates the results.
Table 2 DI results
Range of results
Number of questions falling within
the range Questions accepted or rejected
<20% 11 Rejected
≥20% to <40% 51 Accepted
≥40% to <70% 38 Accepted
Total 100
Eleven questions were rejected based on the DI. These eleven questions were revisited by the researcher to determine how to change and improve the questions and/or their choice of answers.
4.3 Item-to-total correlation (ITT)
After looking at the item-to-total correlation on the 100 questions, there were nine questions with a correlation lower than 0.20. Only questions with a correlation of 0.20 and higher were selected; anything lower than that was revised or rejected. The Pearson’s correlation coefficient method was used to determine the item-to-total correlation.
4.4 Distribution of answers to alternatives
Out of the 100 questions, twenty-one had three possible answers from which to choose, seventy-six questions had four to five answers from which to choose, and three questions had true/false alternatives. For a total of fifty-one questions, fewer than 5% of students selected one or more of the possible alternative answers. It could clearly be seen which answer choices needed to be replaced or removed. For each question, there was a small percentage of students who did not respond.
Example 1
Original question 54:
When the names of two authors are mentioned in a source, e.g. “According to Petzel and Riddle ….”, how should your in-text be done?
a. (Petzel and Riddle, 2006: 102) b. (Petzel & Riddle, 2006: 102) c. Petzel and Riddle (2006: 102) d. (2006: 102)
e. None of these
The results of the analysis are as follows: IDI = 3.03%; ID = 4.1%; ITT = 0.070.
The correct answer is ’d’, chosen by only 3.04% of students. This test question was rejected according to the identified selection or rejection criteria in the IDI, ID and ITT, and the actual answer ’d’ was highlighted as a concern when looking at the distribution of answers to alternatives. The IDI result of 3.03%indicated that the “rejection is too low” which normally means that the question is too difficult. In this case, however, it was decided that the question was more likely misunderstood by students. Students seemed not to realize that they had to choose the correct in-text citation for the sentence beginning “According to Petzel and Riddle ….”. The revised question was thus:
When the names of two authors are mentioned in a source and the sentence in your essay starts with “According to Petzel and Riddle ….”, how should your in-text be done?
a. (Petzel and Riddle, 2006: 102) b. (Petzel & Riddle, 2006: 102) c. Petzel and Riddle (2006: 102) d. (2006: 102)
The researcher decided to remove ‘e’ as an alternative answer even though 9.88% of students chose it and it thus exceeded the criteria of 5%. It was felt that four options were sufficient.
Example 2
Original question 75:
What is the anti-plagiarism software used by CPUT lecturers to detect plagiarism? a. Turnitin
b. Blackboard c. Safe-Assign d. None of the above
The results of the analysis are as follows: IDI = 29.20%; ID = 11.3%; ITT = 0.140.
This question had four answers from which to choose and was rejected on the basis of an IDI that was lower than the criteria of 35% to 85%. At the time of the design of the original assessment, Safe-Assign was the only anti-plagiarism software at CPUT; since then a license for Turnitin had been purchased. Therefore, two of the alternative answers are correct. Question 75 therefore was changed to:
What are the anti-plagiarism software programs used by CPUT lecturers to detect plagiarism? a. Turnitin & Safe-Assign
b. Blackboard & Mendeley c. Turnitin & Blackboard d. Safe-Assign & Blackboard
Example 3
Original question 82:
Where is usually the best place to begin your search for information? a. Reference section
b. Computer c. Catalogue d. Counter
The results of the analysis are as follows: IDI = 19.61%; ID = 9.6%; ITT = 0.140.
5 Conclusion
Conducting assessment after information literacy teaching interventions is essential, but it is also essential that the assessment instrument be valid and reliable. Therefore, this study was an attempt to ensure that this is the case with the short course Certificate in Information Literacy at CPUT. Performing item analysis on the assessment data provided valuable information about each question and pointed out weaknesses and problematic areas in the test. Each question was re-evaluated and adjusted, or even discarded in some cases. New questions were designed to replace those questions that were discarded. The new and improved test instrument was completed and will be used for all students who enrol for the short course during 2015. Continuous revision of the test is important and it is planned that the test data of students who will complete the revised test in 2015 will be used for item analysis during 2016. It is important to assess the validity and reliability of the test continually.
It is recognised that multiple-choice assessment instruments often do not test higher level skills or how students apply in practice what they have learned. Therefore, a further part to this study is planned in order to compare the marks that students received in this multiple-choice test with the results of an actual subject-specific essay assignment. It is hoped that there will be a correlation between the two marks: a student who performs well in the multiple-choice test also performs well in the subject-specific essay assignment. If not, the librarians might have to consider improving the multiple-choice test further and finding better ways to test information literacy skills.
References
Cape Peninsula University of Technology (CPUT). 2009. Information literacy policy. (Unpublished).
Dunaway, M.K. and Orblych, M.T. 2010. Formative assessment: transforming information literacy instruction. Reference Services Review, 39(1): 24-41. DOI:10.1108/00907321111108097.
Fain, M. 2011. Assessing information literacy skills development in first year students: a multi-year study. The Journal of Academic Librarianship, 37(2): 109-119. DOI:10.1016/j.acalib.2011.02.002.
Kermani, R.A. 2013. Survey of the relation between organizational structure and informational overload in case study: Payame Noor University. Research Journal of Recent Sciences, 2(6): 52-57.
Mery, Y. and Newby, J. 2010. Assessing the reliability and validity of locally developed information literacy test items.
Reference Services Review, 39(1): 98-122. DOI:10.1108/00907321111108141.
Nunnally, J. C. 1972. Educational Measurement and Evaluation. 2nd ed. New York: McGraw-Hill.
Oakleaf, M. 2006. The right assessment tool for the job: seeking a match between method and need. Proceedings of the Library Assessment Conference: Building Effective, Sustainable, Practical Assessment. 25-27 September 2006. Charlottesville, Virginia. 201- 213.
Oakleaf, M. 2008. Dangers and opportunities: a conceptual map of information literacy assessment approaches. Project Muse: Libraries and the Academy, 8(3): 233-253. DOI:10.1353/pla.0.0011.
Oakleaf, M. 2009. The information literacy instruction assessment cycle: a guide for increasing student learning and improving librarian instructional skills. Journal of Documentation, 65(4): 539-560. [Online].
http://meganoakleaf.info/iliac.pdf(18 June 2013).
Oakleaf, M. 2010. Value of academic libraries: a comprehensive research review and report. Chicago: Association of College and Research Libraries. [Online]. www.acrl.ala.org/value (15 July 2013).
Ondrusek, A. 2005. A longitudinal study of the development and evaluation of an information literacy test. Reference Services Review, 33(4): 388-417. DOI:10.1108/00907320510631544.
Sonntag, G. 2008. We have evidence, they are learning: using multiple assessments to measure student information literacy learning outcomes. Proceedings of the 74th IFLA General Conference and Council. 10 – 14 August 2008. Quebec, Canada: IFLA. [Online]. http://archive.ifla.org/IV/ifla74/papers/134-Sonntag-en.pdf (14 June 2013). Venter, I. 2006. Development of a valid and reliable test for higher-educated young adults measuring dietary fiber food
source and health-disease association knowledge. Journal of Family Ecology and Consumer Sciences, 34: 10-19. [Online]. http://hdl.handle.net/10520/EJC33678(12 June 2013).
Venter, I. 2008. Construction of a valid and reliable test to determine knowledge on dietary fat of higher-educated young adults. South African Journal for Clinical Nutrition, 21(3): 133-139. [Online].
http://www.ajol.info/index.php/sajcn/article/view/34792(18 February 2014).
Walsh, A. 2009. Information literacy assessment: where do we start? Journal of Librarianship and Information Science,
41(1): 19-28. DOI:10.1177/0961000608099896.
Appendix A
Results per item analysis and per question
Item difficulty index Discrimination Index
Item-to-total Correlation
Distribution of answers to alternatives****
IDI* DI** ITT*** a b c d e
Q01 78.72% 31.0% 0.390 Q01 78.69% 11.18% 5.37%
Q02 60.00% 52.0% 0.410 Q02 10.43% 24.20% 60.00%
Q03 88.13% Reject too high
31.9% 0.520 Q03 88.11% 8.02%
Q04 44.85% 27.5% 0.240 Q04 42.73% 3.20% 5.23% 44.77%
Q05 60.91% 50.0% 0.370 Q05 60.85% 35.06%
Q06 42.54% 21.8% 0.220 Q06 17.90% 9.26% 8.01% 16.48% 42.54%
Q07 87.81% Reject too high
36.2% 0.540 Q07 87.79% 8.19%
Q08 68.43% 36.7% 0.360 Q08 68.43% 27.40%
Q09 53.00% 24.4% 0.240 Q09 53.00% 42.11%
Q10 80.95% Reject too high
34.9% 0.480 Q10 80.92% 13.89%
Q11 63.38% 47.6% 0.390 Q11 11.83% 11.53% 63.32% 8.38%
Q12 59.85% 48.9% 0.400 Q12 9.47% 15.88% 59.85% 10.23%
Q13 47.29% 53.1% 0.380 Q13 47.14% 28.31% 19.58%
Q14 81.23% 27.4% 0.400 Q14 81.35% 14.39%
Q15 74.77% 42.2% 0.440 Q15 20.90% 74.74%
Q16 72.60% 50.5% 0.460 Q16 72.60% 4.65% 7.21% 10.74%
Q17 72.05% 40.5% 0.400 Q17 3.42% 3.58% 2.49% 72.01% 14.00%
Q18 58.26% 36.8% 0.340 Q18 12.63% 58.20% 18.72% 3.48%
Q19 61.17% 31.8% 0.290 Q19 33.97% 61.11%
Q20 27.67% Reject too low 41.7% 0.320 Q20 67.40% 27.56%
Q21 58.28% 38.5% 0.370 Q21 58.28% 18.64% 16.86%
Q22 68.63% 47.9% 0.440 Q22 3.58% 2.49% 19.91% 68.58%
Q23 83.29% Reject too high
29.1% 0.430 Q23 8.23% 83.26% 3.75%
Q24 76.69% 40.1% 0.440 Q24 8.22% 4.41% 0.88% 4.99% 76.21%
Q25 16.36% Reject too low 14.6% 0.140 Q25 17.76% 25.88% 20.98% 16.39% 13.63%
Q26 47.19% 29.5% 0.250 Q26 47.19% 32.25% 15.38%
Q27 80.64% 29.0% 0.450 Q27 80.64% 13.46% 0.61%
Q28 82.54% Reject too high
32.8% 0.430 Q28 4.75% 0.92% 8.59% 82.52%
Item difficulty index Discrimination Index
Item-to-total Correlation
Distribution of answers to alternatives****
IDI* DI** ITT*** a b c d e
Q30 75.42% 34.4% 0.380 Q30 5.07% 75.42% 13.21% 1.84%
Q31 79.22% 38.2% 0.450 Q31 5.74% 10.39% 79.22%
Q32 66.72% 26.1% 0.320 Q32 4.33% 12.84% 7.61% 3.13% 66.57%
Q33 62.29% 32.9% 0.330 Q33 27.79% 4.89% 62.29%
Q34 83.95% 31.1% 0.480 Q34 83.95% 2.08% 0.30% 8.47%
Q35 33.69% 20.3% 0.190 Q35 7.35% 8.42% 20.06% 24.66% 33.69%
Q36 57.80% 55.9% 0.420 Q36 57.59% 13.69% 4.61% 19.05%
Q37 27.45% Reject too low 32.8% 0.270 Q37 27.49% 44.86% 22.81%
Q38 77.81% 19.9% 0.350 Q38 6.00% 77.81% 0.30% 10.94%
Q39 20.47% Reject too low 32.9% 0.250 Q39 3.31% 20.47% 23.46% 47.72%
Q40 28.35% Reject too low 41.4% 0.310 Q40 28.24% 13.12% 29.32% 23.15%
Q41 77.96% 16.7% 0.290 Q41 77.92% 12.13% 6.14%
Q42 71.01% 51.1% 0.440 Q42 6.91% 15.67% 70.97% 1.23% 0.46%
Q43 84.50% 40.7% 0.550 Q43 4.26% 3.95% 84.50% 2.13% 0.15%
Q44 63.02% 44.3% 0.380 Q44 4.30% 4.15% 62.96% 14.96% 8.15%
Q45 52.17% 67.2% 0.450 Q45 11.84% 7.80% 52.17% 14.69% 7.65%
Q46 49.55% 51.9% 0.380 Q46 68.78% 0% 6.33% 1.81% 16.74%
Q47 74.73% 43.3% 0.450 Q47 4.34% 13.18% 74.73% 0% 1.40%
Q48 8.49% Reject too low 4.4% 0.060 Q48 10.80% 31.02% 0% 17.28% 36.27%
Q49 33.63% Reject too low 34.0% 0.270 Q49 34.38% 14.71% 10.51% 17.42% 18.47%
Q50 71.43% 33.6% 0.350 Q50 71.43% 7.07% 1.08% 5.38% 10.45%
Q51 25.85% Reject too low 28.9% 0.230 Q51 17.36% 25.89% 30.70% 19.69% 1.71%
Q52 28.59% Reject too low 34.8% 0.260 Q52 38.91% 25.47% 0.78% 0.78% 28.59%
Q53 47.88% 19.0% 0.220 Q53 24.89% 47.80% 17.75% 5.16%
Q54 3.03% Reject too low 4.1% 0.070 Q54 23.25% 35.26% 23.71% 3.04% 9.88%
Q55 71.17% 34.2% 0.370 Q55 5.06% 71.17% 8.59% 10.12%
Q56 72.74% 46.3% 0.440 Q56 4.00% 12.44% 72.74% 6.96%
Q57 47.45% 54.0% 0.400 Q57 21.05% 24.92% 47.37%
Q58 84.93% 33.4% 0.480 Q58 3.25% 6.80% 0.44% 84.91%
Item difficulty index Discrimination Index
Item-to-total Correlation
Distribution of answers to alternatives****
IDI* DI** ITT*** a b c d e
Q60 56.53% 39.4% 0.360 Q60 20.74% 25.96% 35.33% 0.15% 12.29%
Q61 41.38% 44.7% 0.330 Q61 29.89% 41.29% 5.86% 16.95%
Q62 35.56% 28.7% 0.250 Q62 33.07% 35.56% 17.08% 8.54%
Q63 31.48% Reject too low 14.1% 0.160 Q63 8.43% 9.79% 46.08% 30.42%
Q64 47.06% 43.8% 0.340 Q64 46.97% 12.26% 21.18% 14.17%
Q65 40.67% 35.0% 0.280 Q65 33.38% 10.77% 11.23% 40.67%
Q66 34.21% Reject too low 44.1% 0.300 Q66 34.21% 16.17% 5.60% 38.88%
Q67 41.63% 42.3% 0.300 Q67 18.31% 3.13% 41.63% 31.92%
Q68 76.59% 52.7% 0.530 Q68 5.06% 76.59% 7.08% 3.61% 2.89%
Q69 57.21% 32.5% 0.310 Q69 57.14% 27.80% 1.09% 9.94%
Q70 90.81% Reject too high
25.1% 0.560 Q70 0.61% 3.37% 90.81% 0.46%
Q71 67.76% 52.4% 0.450 Q71 67.76% 3.91% 11.42% 11.74%
Q72 30.03% 37.4% 0.290 Q72 5.41% 29.92% 58.20%
Q73 85.80% Reject too high
31.6% 0.500 Q73 3.66% 4.43% 1.22% 85.80%
Q74 63.36% 29.5% 0.310 Q74 16.67% 63.16% 6.73% 8.48%
Q75 29.20% 11.3% 0.140 Q75 24.21% 18.08% 29.25% 23.74%
Q76 93.27% Reject too high
26.2% 0.720 Q76 93.27% 0.45% 0% 0.90%
Q77 51.52% 61.9% 0.440 Q77 14.79% 0.91% 51.52% 26.68%
Q78 73.47% 47.6% 0.470 Q78 8.14% 2.15% 11.21% 73.43%
Q79 52.15% 51.8% 0.400 Q79 52.15% 4.31% 20.92% 17.69%
Q80 67.44% 45.1% 0.440 Q80 10.39% 9.15% 8.68% 64.96%
Q81 41.06% 43.9% 0.330 Q81 7.33% 39.15% 41.06% 7.77%
Q82 19.61% Reject too low 9.6% 0.140 Q82 19.61% 32.43% 39.22% 3.62%
Q83 85.52% Reject too high
39.3% 0.520 Q83 5.70% 85.52% 3.70% 0.92%
Q84 72.69% 51.7% 0.440 Q84 4.33% 72.65% 4.78% 14.50%
Q85 84.34% 35.2% 0.490 Q85 4.50% 0.31% 6.99% 84.32%
Q86 81.54% 32.2% 0.410 Q86 81.51% 5.39% 3.08% 5.86%
Q87 70.55% 56.6% 0.470 Q87 70.55% 14.24% 7.61% 3.40%
Item difficulty index Discrimination Index
Item-to-total Correlation
Distribution of answers to alternatives****
IDI* DI** ITT*** a b c d e
Q89 89.12% Reject too high
32.1% 0.580 Q89 89.12% 2.98% 2.38% 0.15%
Q90 69.70% 36.9% 0.390 Q90 7.73% 69.70% 6.67% 10.45%
Q91 74.28% 21.0% 0.290 Q91 74.39% 11.36% 0.61% 9.09%
Q92 75.95% 40.8% 0.430 Q92 75.95% 15.83% 0% 3.81%
Q93 61.27% 31.9% 0.310 Q93 61.21% 10.72% 14.10% 9.03%
Q94 64.60% 37.9% 0.370 Q94 64.55% 0.64% 29.57% 0%
Q95 73.11% 44.2% 0.440 Q95 10.89% 73.07% 4.54% 6.81%
Q96 38.38% 23.2% 0.220 Q96 38.29% 16.47% 17.63% 22.40%
Q97 61.78% 35.8% 0.310 Q97 14.37% 17.85% 61.72% 1.66%
Q98 20.70% Reject too low 22.1% 0.210 Q98 55.71% 20.55% 2.89% 15.68%
Q99 59.97% 49.4% 0.380 Q99 8.22% 60.35% 5.87% 21.29%
Q100 13.00% Reject too low 6.7% 0.100 Q100 48.80% 17.37% 12.87% 15.87%
Values highlighted and in bold: do not meet the selection criteria: * Item difficulty index (IDI):
≥ 20% - 80% (items up to three alternative answers) ≥ 35% - 85% (items with four or more alternative answers) ≥ 60% - 95% (items with true/false alternatives)