Measuring the Severity of Fungi Caused Disease on
Leaves using Triangular Thresholding Method
Dominic Asamoah
Department of Computer Science, KNUST, Ghana
Richard Marfo
Department of Computer Science, KNUST, Ghana
Stephen Opoku Oppong
Department of Computer Science, KNUST, Ghana
ABSTRACT
Leaf disease detection and measurement is one of the most difficult tasks in agricultural image processing. This study discus in details the methods and means of detecting and measuring the severity of fungi caused disease on plant leaves using the triangular thresholding method. Four suspected images ware collected from different plant species and experiments were conducted on each to detect and measure the extent of damage caused by the fungi cause disease on the leaf. Analysis was made and the results proved to be about 97% accurate.
General Terms
Image Processing, Algorithm, Pattern Recognition
Keywords
Segmentation, Thresholding, Image Acquisition, Triangular Thresholding, Leaf Disease
1.
INTRODUCTION
In recent years, agriculture has become much more important than it used to be some years back where plants were only used to feed humans as well as animals. This is due to the fact that plants are now used in several other ways such as generation of electricity and other sources of energy to improve upon the living conditions of mankind and also for medicinal purposes. However, there are so many diseases that affect plants that can cause great harm to various economies and societies. It can even lead to great ecological losses. For this reason, it is better to diagnose diseases accurately and timely to avoid such loses. Plant diseases can be detected through several means including manual and computer based systems. Most plant diseases appear as spots on the leaves which are more visible to human eye. On the other hand, there are some diseases that do not appear on the leaves and others appear in the later stages when they have already caused great harm to the plants. In such instances, it is recommended that computerized systems would be the only option to detect the situation timely using some kind of complex algorithms and analytical tools, preferably through the use of powerful microscopes and other machines. In some other instances, the signs can only be detected through the electromagnetic means which produces more images that are not visible to the human eye. Another means of achieving this is through technique known as Remote Sensing Technique (RST) Digital Image Processing that examines and diagnoses using multi and hyper spectral image captures. All the methods that use the RST approach usually fall on digital image processing tools to achieve their desired results. Most of the diseases that affect plants are caused by fungi which appear as spots on plant leaves. These spots make it very difficult for such plants to prepare their food by means of photosynthesis since they affect the green pigments in the leaf, hence to a large extent affects the growth and the yield of such plants. In circumstances where the fungi infection becomes severe, the spots cover the entire surface area of the leaf. The diseases in plants do not
only reduce the yield but can also deteriorate the variety of such plants and its withdrawal from cultivation. Plant diseases especially leaf diseases are usually curbed using insecticides, fungicides and pesticides. However, excessive application of these chemicals for the treatment of plant diseases can result in poisoning their produce as well as causing other harms to humans and animals. The danger of toxic residue on crops due to the application of pesticides on plants that have been affected by various forms of diseases has been identified as a major contributor to ground water pollution and contamination. Again, too much application of pesticides by farmers’ increase cost of production which can lead to greater loss. Therefore, there is the need to minimize their use due to the above reasons. One major way of achieving this is by estimating the severity of the affected area of the plant severity focusing on the diseased area, with the appropriate quantity and concentration of pesticides. The use of naked eye observation and manual methods are generally used to decide disease severity in the production practice but that may result in several errors and inaccurate results. Other methods such as Grid counting can be used to improve the accurate level however, this approach is difficult to use and also consumes a lot of time. The application of image processing techniques in conducting research in the agriculture sector has helped in diverse ways to improve upon the development of the agricultural sector. There are so many approaches used by some researchers to detect, measure and classify leaf diseases on plants. Some of these methods include the Bounding Box, Moment Analysis, Color Analysis, Support Vector Machine and Neural Networks. However, none of these methods have adopted by the various researchers has been outstanding. This paper seeks to detect, measure and quantify the severity of fungi caused disease on leaves using the Triangular Thresholding method. What makes this method unique is the fact that it is simple, easy to use and provides accurate results.
2.
LITERATURE REVIEW
2.1
Image Processing
human eye in terms of accuracy, but it can outperform it easily on observational consistency, and ability to carry out detailed mathematical operations. Again, image processing can be used to compute and find solutions to simple or structured tasks by providing reliable, consistent and cheap results. Unlike some years back, researches conducted based on image processing in recent years have been broadened widen to cover a large range of information ranging from simple and basic pixel based low-level operations to high-low-level analysis that now includes the use sophisticated tools including techniques like artificial intelligence for the purposes of interpretation and understanding of the image. These new and modern techniques for processing images are being developed to get a better meaning and understanding of images based on the relationship between its components, its context, and its history if it is a part of a sequence, and a priori knowledge gained from a range of images.
2.2
Uses of Image Processing
Jayamala et.al, [2] identified about five main uses of image processing in respect to agricultural plants and their fruits. In their research, they identified that image processing is very useful to:
i. Detect plant leaves, stems and fruits that are affected by diseases.
ii. Quantify the areas affected by disease in plant leaves, fruit and stems.
iii. Detect the shape of the area of the leaves, fruits and stem that has been affected.
iv. Determine the color of the affected areas and finally v. Find out the size and shape of fruits.
Rao [1] identified some uses of Image Processing as applied and used in various applications such as Material Science, Agriculture, Remote Sensing, Medicine, Document processing, engineering, Non-destructive Evaluation, Forensic Studies, Textiles, Military, Printing Industry, Film industry and Graphic design.
2.3
Image Processing Methods
Rao [1] presented two main methods of image processing. In his paper, he presented Analog image processing as the first method. This method refers to the changes, modification and adjustment of image through electrical means. A typical example of this method is the image produced by the television. The television transmits signals in a form of voltage which varies in amplitude to represent brightness through the image. The writer continues with the second method which he identified as digital method of processing image. In this case, supposed image will be changed or converted to digital form through a device known as scanner digitizer for further processing. Digital image processing has dominated over analog image processing with the passage of time due its wider range of applications. The digital image processing deals with developing a digital system that performs operations on digital images.
2.3.1
Image Segmentation
Image segmentation is defined as the process of dividing or breaking an image into different parts based on certain characteristics. The parts usually conform to something that human beings can easily separate, view and analyze as individual objects. The digital computer as we know does not have the ability to recognize objects intelligently on their own; this is
why different researchers have come out with different approaches and methods to segment images. Images are usually segmented depending on the various characteristics and features found in the image. These features may include color information which is used to create histogram, information about pixels that indicate boundaries and texture information. In the case of computers, image segmentation can be defined as the process of dividing digital image into several parts or components (a set of pixels that can also be referred to as super pixels). The purpose of segmenting any image is to simplify (make the image easier or less complicated) and change the representation of the image into something meaningful for the purposes of easier analysis. Image segmentation is usually used to detect and discover characteristics, objects and boundaries such as curves and lines in images. Image segmentation can simply be defined as the process of assigning some description to every pixel in image to identify pixels with similar and unusual characteristics. The outcome of the segmentation process depends on a set of components that together the entire image or a set of outcome deduced from the image. Each of the pixels in a particular region is similar with respect to some characteristic or computed property, including intensity, texture and color. Neighboring regions are significantly different with respect to the similar characteristics. When applied to a pile of images, typical in medical imaging, the resulting outline after image segmentation can be used to create 3 Dimensional reconstructions with the help of a written algorithm.
2.4
Measuring Disease Severity on Leaves
Libo et.al [3] conducted a research on the methods of identifying leaf diseases in rice based on the characteristics of the colors of leaf lesion area using the thresholding method. Zhang [4] conducted a research on cucumber in order to determine the methods of diagnosing the nutritional status of green crops using machine vision technology. The result showed a mutual relationship between the green components and other color components of the leaves with the nitrogen which could be used rapidly as diagnosis of crop diseases indicator under the same conditions. Hu et.al, [5] used two different statistical features of the ROB system to distinguish between the deficiency in cucumber blades, using features of the Ohta system. The system was used to identify the color of different cucumber leaves and obtain the Hue (H) relative percentage histogram of Hue Saturation Value (HSV) color system in order to calculate the extent of deficiency in leaves. This algorithm was believed to have been successful. Revathi, et.al [6] detected spot disease on cotton leaf using a technique known as IEDS (Image Edge Detection Segmentation). In the IEDS technique, the captured images are first processed for enrichment. Afterwards, the image was segmented using Red, Green, and Blue (RGB) color feature to obtain targeted regions (disease area). They finally extracted certain features including image boundary, image shape, texture and color to identify diseases and control the pest on the leaves.
method was to obtain features like color, size and shape of the spot and classify them by means of neural networks. According to them; the accuracy of this classification method was 97%. Al-Bashih et.al [9] used a fast and accurate method to detect diseases in leaf by k-means classification method. The images were segmented using neural networks based classification. High resolution multispectral and stereo images were used to automatically classify leaf diseases. Sabine et.al [10] used weighted Parzen-window Segmentation process to obtain a threshold value to deduce the diseased region on plant leaves. They graded plant diseases by calculating the quotient of disease spot and leaf areas. Husin et.al [11] used the color clustering method to detect leaf disease in chilli plant through Graphical User Interface (GUI). Song et.al [12] developed methods to detect crop disease through image processing technology. Their method was used to extract features like color, shape and texture and their respective problems were identified after segmentation.
3.
METHODOLOGY
The following tools and materials were used for the project; Sample spot infected plant leaves, 20 samples, Digital Camera, black sheet/cloth, Light System, computer and MATLAB software Version R2015a.
Three principal stages are involved in undertaking this project. These include image acquisition, image segmentation and finally leaf region segmentation. However, other principles like conversion of image into various forms were also considered.
3.1
Image acquisition
Suspected plant leaves are used to carry out this project. The digital camera was used to capture images in controlled environment with the dark background. The images were stored in either JPEG or PNG format. First, the diseased leaf was placed flat on the black background (black cloth) with correct amount of light sources. This was to eliminate any reflection and get light evenly distributed everywhere in order to get a better view and brightness of the image to be processed. The object (leaf) was properly zoomed using the digital camera to ensure that the picture taken contained only the leaf and black background with the rightful image size.
3.2
Image segmentation
The segmentation step was used to separate the image into different regions based on similar characteristics in the image. These regions show distinct and unique characteristics from one another and should not intersect one another. Each of the regions should portray some level of consistency in the region. The segmentation stage went through two different stages in order to obtain total leaf pixels and the pixels in the leaf lesion area.
For the purposes of proper segmentation, the image is converted to grayscale from the RGB format.
3.3
Leaf region segmentation
To perform the segmentation process, the image was first converted into grayscale from the true color. This helped in differentiating due to the variation in the gray values of the two (background and actual image). The background color of the image was represented as black whiles the actual image was represented as white. After image segmentation, the binary image containing leaf region is obtained by region filling and removing every hole in the white region. The image is then scanned from top to bottom and from left to
right using the MATLAB software to determine the total the number of pixels in the leaf.
3.4
Diseased region segmentation
To achieve the accurate results, there is the need to segment the image to obtain only the diseased area. If proper care is not taken, segmentation may be wrong because of color variation. If the central vein of the leaf (midrib) is shallower than that of the actual leaf, it may lead to inaccurate results.
3.5
Algorithm
i. Check to ensure that the user has installed Image processing Toolbox in Matlab.
ii. Load the image into Matlab (with full file location)
iii. Get the dimensions of the image
iv. Convert the image to HSV color space
v. calculate the black pixels
vi. Find only the black that is outside the leaf, not inside the leaf
vii. Mask the H, S, and V images
viii. Plot the histogram of the hue area
ix. Call anything with a hue of between 0.15 and 0.5 "healthy".
x. Call anything else (that is not background) "diseased."
xi. Compute the diseased area fraction
xii. End
Mathematically, algorithm for estimating diseased severity can be expressed as:
DS = DA / TA DS = Disease Severity, P = Unit pixel value, DA = Diseased leaf Area TA = Total Leaf Area, DR = Diseased Region, LR = Leaf Region,
Pd = Total pixels in Diseased Area, PL = Total Pixels of the Leaf. = P Σ1 / P Σ1
(X, Y) Є DR (X, Y) Є LR = Σ1 / Σ1
(X, Y) Є Rd (X, Y) Є Rl = Pd / PL
Where,
DS = Disease Severity, P = Unit pixel value, DA = Diseased leaf Area TA = Total Leaf Area, DR = Diseased Region, LR = Leaf Region,
Pd = Total pixels in Diseased Area, PL = Total Pixels of the Leaf.
Every pixel in the image has equal value therefore it is easier to extract the diseased portion by counting the numbers in the region and express it in the ratio of the total leaf area as shown in the algorithm above.
and lesion leaf area in the binary image. The accuracy of the algorithm is estimated by the percentage of known standard area covered by shapes like Circle, triangle, rectangle and Square
To calculate Percentage of Accuracy (A) and Deviation (D), the estimated values are compared with the actual area Where,
D=(SM-EM)*100/SM A=100-D
where
SM= Standard Measurement, EM= Experimental Measurement and A= Percentage Accuracy
The advantages of this algorithm are the fact that it is not complex as compared to others which need much technicalities to work with. Also, it is proved to produce au 97% accurate results.
4.
RESULTS AND IMPLEMENTATION
To achieve the accurate results, four samples of leaves affected by fungi were captured using a digital camera with a dark background. These four samples were used for the experimentation.
Figures 1 to 4 represent images of leaves affected by fungi showing the true colors of the images.
Figure 1: Sample A
Figure 2: Sample B
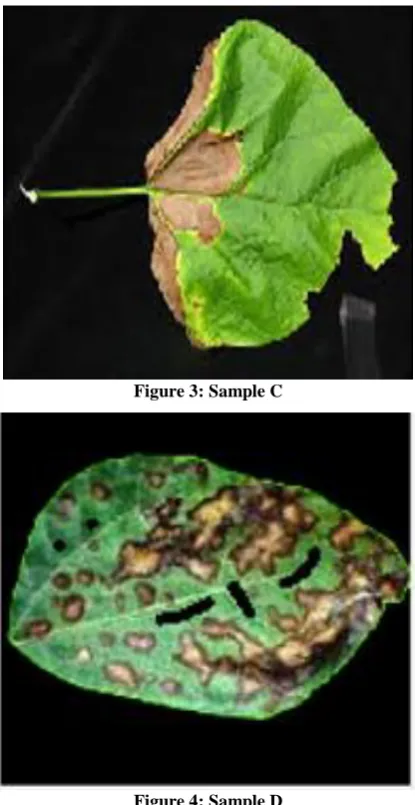
Figure 3: Sample C
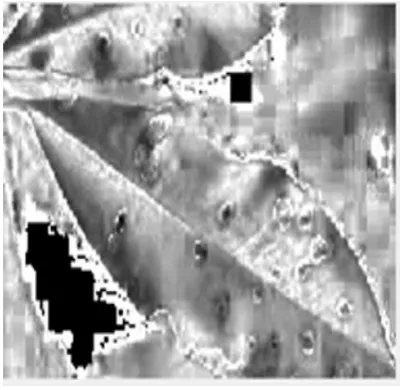
Figure 4: Sample D
Figures 1 – 4 represent samples of images captured with digital camera for the purpose of this study.
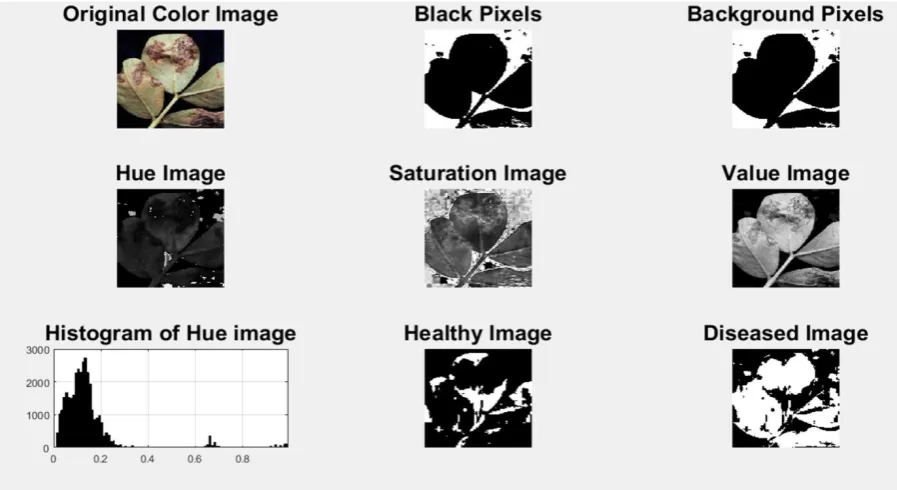
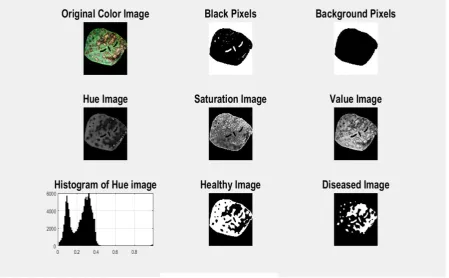
After taking the images, they are then converted into various forms such as hue, saturation, gray scale, background pixels for proper segmentation using thresholding methods to extract meaning from them.
Hue is defined as a colour attribute that describes the pure colour in an image. It is usually described in terms of red, green or magenta. Hue also defines combination of two pure colors like red-yellow which gives orange, or yellow-green. Hue is usually one of the three properties used to determine a certain color. Hue is a more technical definition of our color perception which can be used to communicate color ideas. Hues can refer to the set of pure colors within a color space and can range from 0 to 359 when measured in degrees.
Figure 6: Histogram of the hue form of the image
A histogram is a special type of graph that simply categorizes the color levels of the pixels in an image into a permanent and stable number of bins whereby each of them extends some small range of values. Therefore, each of the bins contains a number of color levels (pixel values) in the image that fall into that range. The outcome of this represents the extent at which the color values that make up the image are distributed. This distribution is formed from left to right where black at the left and white at the right. The histogram can either be generated for each channel or separately overall histogram which looks at values from all the channels combined. Histogram results are usually displayed in a form of bar chart. However, it can also be displayed using line graph where the line connects the tops of the bars. The actual height of a histogram chart has little actual meaning because the charts are usually scaled so that the highest peak touches the top of the image. Therefore, the height of each individual bar is irrelevant. What is much more important is the distribution of the histogram over the whole range, and how the relative heights relate to each other over the whole of the chart.
It is always better to consider the following factors when reading histogram charts in imaging.
1. Check whether the histogram forms one wide band of values or it has a tight group in the middle or at any of the ends. When there is a only one band of values in the image, it implies the image makes wide use of the color space and thus has good contrast. Also, the presence of thigh group in the middle or any of the ends means the image has a low contrast, making it look 'fogged' or 'grayed', or perhaps overly light or dark.
2. Ask yourself whether the histogram forms two or more peaks a due to highly different areas or regions in the image.
3. Identify where most of the pixels are. When they are found at the left, it means the image is very dark. On the other hand, when they are found at the right, it implies the image is very bright is very bright. 4. Are there regular gaps or empty spaces between
individual bars? This usually means the image has very few pixels, so it could not completely fill out the whole histogram, or the image was color reduced, or modified in some way resulting to those gaps.
The use of histogram is very important in image processing because it presents the image in simpler form. This makes it easier to change or adjust an image in terms of its histogram. Every mathematical color transformation that is applied to the image will result in modification of both the image and its histogram. These include both linear and non-linear operations.
Figure 7: Black pixels of image sample A
The dark portions of the above image represent the total leaf area captured by the digital camera whiles the white portions represent the spaces between the image.
Figure 8: Saturation image of sample image A
color is the closer it is to grey. There is no right or wrong answer to how saturated colors should be in an image; it largely depends on how you want your images to look., when there is too much saturation in an image, the image looks like a cartoon. It is also difficult to accurately print images that are too saturated. However, a desaturase image is also said to be dull, less colorful or washed out but can also make the impression of being softer. The image (A) was converted into saturated form to determine the intensity of color in the image.
Figure 9: Healthy portion of sample A
Figure 9 above shows the healthy portions of image sample A where the white areas represent the healthy portions of the image sample.
Figure 10: Background pixels of sample image A
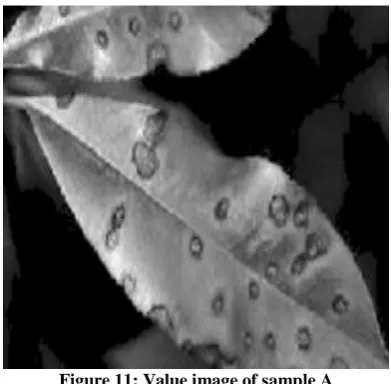
Figure 11: Value image of sample A
Valueis defined as the measure of lightness or darkness of a color. It is an important tool in image processing because it defines form and creates spatial illusions. Contrast of value separates objects in space, while gradation of value suggests mass and contour of a contiguous surface.
Figure 12: Diseased portions of image sample A
Figure 12 above shows the diseased portions of the image. The portions with white colors represent the affected areas of the image.
After the various forms of segmentation, the percentage of area affected by the fungi is then calculated using the algorithm above stated earlier. This algorithm is used for the segmentations as well as calculating the diseased portions of the image by counting all the pixels in the diseased region during thresholding and expressing them in a ratio of the total pixels in the image. The result is then expressed in a percentage of 100.
Finally, the area fraction affected by fungi caused disease on image sample A was estimated to be 20.10%.
Figure 13: Results obtained from Sample B after various forms of segmentation and thresholding
Figure 15: Results obtained from Sample D after various forms of segmentation and thresholding
Table 1: Summary of results obtained from the various experiments.
SAMPLES % OF DISEASED
AREA
% OF HALTHY
AREA
TOTAL (%)
Sample A 20.10 79.90 100
Sample B 76.63 23.37 100
Sample C 24.80 75.20 100
Sample D 32.27 67.73 100
Table 1 represents the results in percentage from the various samples used in the project. The entire image was expressed in a percentage of 100 of which the diseased area is estimated from it.
5.
CONCLUSION
This study was meant to measure the severity of fungi caused diseases on leaf. The study took into consideration the negative effects of leaf diseases on plants. Studies have proven that, the consequences of plant leaf diseases are great and difficult to deal with. However, leaf diseases, most especially those caused by fungi can be measured and estimated to ensure proper and adequate application of the correct concentration of fungicides to avoid agricultural loss and excessive use of chemicals on farm produce. Plant disease does not only reduce their products but also deteriorate their variety and their withdrawal from cultivation. The use of pesticides and fungicides in excess for the treatment of such diseases increases the danger of toxic residue level on agricultural products and has been identified
as a major contributor to ground water contamination. Again, farmers incur much loss due to cost of these pesticides as applied on plants. Again, too much application of chemicals can lead to the poisoning of the farm produce most especially fruit and leafy produce which are dangerous to human health as well as animals that feed on them. The algorithm used in the study is more efficient and easy to use not only for the detection and measurement of fungi caused diseases on leaves but can also be used for the detection and measurement of bacterial infections on plant leaves.
6.
REFERENCES
[1] Rao M. 2004, A Novel technique to Resample High resolution remote Sensing Satellite Images, Proc. Ofigrass-02, Colorado
[2] Jamayala B., Nikola Kasabov K. and Howard C. [1999] Fruit Image Analysis using Wavelets, Proceedings of the ICONIP/ANZIIS/ANNES.
[3] Libo L., Zhou G. M., 2009, "Research on image feature extraction of crop disease," Transactions of the CSAE, vol.2S, pp.213-217
[4] Zhang Y., Li M.Z. 2005, "Nutrition information extraction of the cucumber leaves in the greenhouse based on computer vision technology," Transactions of the CSAE, vo1.21, pp.102-IOS
[5] Hu C, Li P.P, 2004," Application of computer image processing to extract color feature of nutrient deficiency leaves,” Computer Measurement & Control, vol.9, pp.8S9-862
[7] Kim D., Burks T.F., Qin J., Bulanon D. 2009, Classification of grapefruit peel diseases using color texture feature analysis, International Journal on Agriculture and Biological Engineering, Vol:2, No: [8] Helly M., Rafea A., and El-Gamma. An Integrated image
Processing System for Leaf Disease Detection and Diagnosis
[9] Al-Bashish D., Braik M. and Bani-Ahmad S., 2011. Detection and classification of leaf diseases using K-means-based segmentation and neural networks based classification
[10] Sabine D. B., Forstne W., 2011, The Potential of Automatic Methods of Classification to identify Leaf
diseases from Multispectral images, Springer Science Business Media, LLC 2011., Precision Agric (2011) 12:361-377, DOI 10.1007/s11119-011-9217-6.
[11] Husin Z., Farook M.S, 2012,” Feasibility Study on Plant Chili Disease Detection Using Image Processing Techniques” in Proceedings of IEEE International Conference on Intelligent Systems Modelling and Simulation.