Infogain Publication (Infogainpublication.com) ISSN : 2454-1311
RADAR Image Fusion Using Wavelet Transform
R.R.Karhe
1, Y.V.Chandratre
21Associate Professor Electronics & Telecommunicaton Engg. Dept. Shri.Gulabrao Deokar COE Jalgaon, India 2M.E.Student Electronics & Telecommunication Engg. Dept. Shri. Gulabrao Deokar COE.Jalgaon, India
Abstract—RADAR Images are strongly preferred for
analysis of geospatial information about earth surface to assesse envirmental conditions radar images are captured by different remote sensors and that images are combined together to get complementary information.
To collect radar images SAR(Synthetic Aperture Radar) sensors are used which are active sensors and can gather information during day and night without affecting weather conditions.
We have discussed DCT and DWT image fusion methods which gives us more informative fused image simultaneously we have checked performance parameters among these two methods to get superior method from these two techniques.
Keywords—DCT, DWT, RADAR, Synthetic Aperture Radar
I. INTRODUCTION
Image Fusion is one of the major research fields in image processing. Image Fusion is a process of combining the relevant information from a set of images, into a single image, wherein the resultant fused image will be more informative and complete than any of the input images. Image fusion process can be defined as the integration of information from a number of registered images without the introduction of distortion. It is often not possible to get an image that contains all relevant objects in focus. One way to overcome this problem is image fusion, in which one can acquire a series of pictures with different focus settings and fuse them to produce an image with extended depth of field. Image fusion techniques can improve the quality and increase the application of these data. This project report discusses the two categories of image fusion algorithms DCT based algorithm and the basic DWT algorithm. It gives a literature review on some of the existing image fusion techniques for image fusion like, primitive fusion (Averaging Method, Select Maximum, and Select Minimum), Discrete Wavelet transform based fusion, Principal component analysis (PCA) based fusion etc.
Image fusion is the process of combining information from two or more images of a scene into a single composite
image that is more informative and is more suitable for visual perception or computer processing.
The objective in image fusion is to reduce uncertainty and minimize redundancy in the output while maximizing relevant information particular to an application or task. Given the same set of input images, different fused images may be created depending on the specific application and what is considered relevant information.
There are several benefits in using image fusion: wider spatial and temporal coverage, decreased uncertainty, improved reliability, and increased robustness of system performance.
Infogain Publication (Infogainpublication.com) ISSN : 2454-1311 areas) information and enhance the information of changed
regions in the fused DI, fusion rules based on weight averaging and minimum standard deviation are chosen to fuse the wavelet coefficients for low and high-frequency bands, respectively. Experiments on real SAR images confirm that the proposed approach does better than the mean-ratio, log-ratio, and Rayleigh-distribution-ratio operators.
II. LITERATUREREVIEW
Burt (1984) [2] “The pyramid as a structure for efficient computation” was one of the first to report the use of Laplacian pyramid techniques in binocular image fusion and later on Burt and Adelson (1987) [3] “Depth-of-Focus Imaging Process Method” later introduced a new approach to image fusion based on hierarchical image decomposition at about the same time Adelson disclosed the use of a Laplacian technique in construction of an image with an extended depth of field from a set of images taken with a fixed camera but with different focal lengths. Later Toet (1989) [4] “Image fusion by a ratio of low pass pyramid” used different pyramid schemes in image fusion which were mainly applied to fuse visible and IR images for surveillance purposes. Some other early image fusion work are due to Lillquist (1988) [5] “Composite visible/thermal-infrared imaging apparatus” disclosing an apparatus for composite visible/thermal infrared imaging, Ajjimarang (1988) [6] “Neural network model for fusion of visible and infrared sensor outputs” suggesting the use of neural networks in fusion of visible and infrared images, Nandha kumar and Aggarwal (1988) [7] “Integrated analysis of thermal and visual images for scene interpretation” providing an integrated analysis of thermal and visual images for scene interpretation, and Rogers et al. (1989) [8] “Multisensor fusion of RADAR and passive infrared imagery for target segmentation” describing fusion of RADAR and passive infrared images for target segmentation. Use of the discrete wavelet transform (DWT) in image fusion was almost simultaneously proposed by Li and Chipman (1995) [9] “Wavelets and image fusion” at about the same time Koren (1995) [10] “Image fusion using steerable dyadic wavelet” described a steerable dyadic wavelet trans-form for image fusion and also around the same time Waxman and colleagues developed a computational image fusion methodology based on biological models of colour vision and used opponent processing to fuse visible and infrared images. The need to combine visual and range data in robot navigation and to merge images captured at different locations and modalities for target localization and tracking
in defense applications prompted further research in image fusion
III. SYSTEMDEVELOPMENT
a) Basic Image Fusion
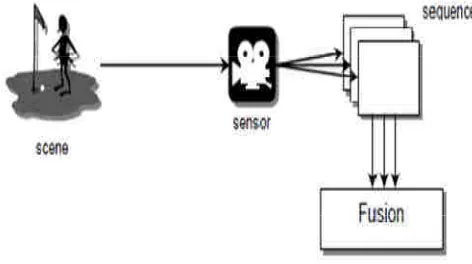
An illustration of an image fusion system is shown in Figure1.The sensor shown could be a visible-band sensor such as a digital camera. This sensor captures the real world as a sequence of images. The sequence is then fused in one single image and used either by a human operator or by a computer to do some task. For example in object detection, a human operator searches the scene to detect objects such intruders in a security area.
Fig. 1: Basic Image Fusion System
This kind of systems has some limitations due to the capability of the imaging sensor that is being used. The conditions under which the system can operate, the dynamic range, resolution, etc. are all limited by the capability of the sensor. For example, a visible-band sensor such as the digital camera is appropriate for a brightly illuminated environment such as daylight scenes but is not suitable for poorly illuminated situations found during night, or under adverse conditions such as in fog or rain. The image fusion techniques mainly perform a very basic operation like pixel selection, addition, subtraction or averaging. These methods are not always effective but are at times critical based on the kind of image under consideration. Following aresome of the image fusion techniques studied and developed as part of the project.
b) Average Method
Infogain Publication (Infogainpublication.com) ISSN : 2454-1311 algorithm does not actually fuse the images perfectly. The
algorithm, being the simplest one, can be put in one step as the following:
1) Calculate the average intensity value of each
corresponding pixel of the pair of input images
c) Select Maximum Method
The Selection method is also one of the trivial methods of image fusion. But unlike averaging method, instead of averaging every corresponding pixel, a selection process if performed here. The criterion of selection is self-explained by the name of the method. Of every corresponding pixel of the input images, the pixel with maximum intensity is selected and is put in as the resultant pixel of the fused image. Thus, effectively, every pixel of the fused image will be the pixel with maximum intensity of the corresponding position pixels in the input image. One advantage of this method over averaging method is that there is no compromise made over the good information available in the input images. A straight forward selection of the better pixel intensity is made here. But of course, it is combined with the disadvantage that higher pixel intensity does not always mean better information. It depends on the type of image under consideration. Thus, you either take the whole of the information or totally avoid the same. The stepwise description of the algorithm is as the following:
1) Compare the intensity value of the corresponding pixels of the input pair of images.
2) Generate the selection matrix based on the
comparison performed in 1, assigning value 1 for condition being true and 0 otherwise
3) Multiply the corresponding value in the selection matrix with first image matrix
4) Multiply the corresponding value in the negated selection matrix with second image matrix.
5) Resultant image matrix id calculated by adding the matrices calculated in 3 and 4
d) Select Minimum Method
The minimum selecting method, being yet another trivial image fusion method, is very similar to the Maximum Selection method; except for, here, the selection criteria differs as the pixel with minimum density is picked up. Thus, for every pixel position, the pixel of the fused image will be the pixel of the corresponding position from the input set of images having the least pixel intensity value. Similar to the Maximum Selection method, this method to either completely considers the information from an input image or discards it fully. No averaging or any operation of the like is performed here. The quality of the fusion is specific to the type of image we are dealing with. In certain cases, say, images with dark shades would generate a good
fusion image with thismethod. The stepwise description of the algorithm is discussed below.
1) Compare the intensity value of the corresponding pixels of the input pair of images.
2) Generate the selection matrix based on the
comparison performed in 1, assigning value 0 for condition being true and 1 otherwise.
3) Multiply the corresponding value in the selection matrix with first image matrix
4) Multiply the corresponding value in the negated selection matrix with second image matrix.
5) Resultant image matrix id calculated by adding the matrices calculated in 3 and 4.
e) Fusion Techniques
Data fusion techniques combine data from different sources together. The main objective of employing fusion is to produce a fused result that provides the most detailed and reliable information possible. Fusing multiple information sources together also produces a more efficient representation of the data.
There are three categories of data fusion:
i). Pixel / Data level fusion: It produces a fused image in which information content related with each pixel is concluded from a set of pixels in source images. Fusion at this level can be carry out either in spatial or in frequency domain. However, pixel level fusion may conduct to contrast reduction pixel level fusion is the combination of the raw data from multiple source images into a single image.
ii). Feature level fusion: Feature level fusion requires the extraction of salient characteristics which are depending on their surroundings such as pixel intensities, edges or textures. These analogous attribute from the input images are fused. This fusion level can be used as a means of creating supplementary amalgamated attributes. The fused image can also be used for classification or detection feature level fusion requires the extraction of different features from source data before features are merged together
iii). Decision level fusion: Decision level is a superior level of fusion. Input images are processed independently for information mining. The obtained information is then united applying decision rules to emphasize widespread interpretation decision level fusion combines the results from multiple algorithms to yield additional fused decision.
IV. USEDMETHODOLOGY
Infogain Publication (Infogainpublication.com) ISSN : 2454-1311
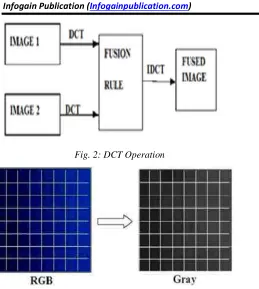
Fig. 2: DCT Operation
Fig. 3: Colour Image to gray scale image(A)
DCT operation is shown Figure 2. This experiment tries the method of 2-D Discrete Cosine Transformation (DCT) at first. The image should be gray scale before the DCT starts, after the gray scale transformation is completed, just start
the process of 2 dimensions Discrete Cosine
Transformation (DCT) for each 8*8 blocks. The process of the RGB image transformed to gray scale image is shown in Figure 2 and Figure 3.
According to the Figure 3,the RGB image is divided into blocks with size of 8*8 pixel with blue colour in gradient, the gradient scalar field is show the direction from left (deep blue) to right (light blue). After gray scale, the RGB image should be in gray colour, the gradient scalar field is show the direction from left (black) to right (gray). Figure 4.showed the processing of gray scale, the image is grouped by matrices of red, green and blue, and it converts to one grey matrix. This matrix will be used in next DWT transformation.
Fig. 4: Colour image to gray scale image(B)
After the matrix of gray scale will process the two dimensional Discrete Cosine Transformation (DCT2), the
definition two dimensional of Discrete Cosine
Transformation (DCT2) is:
, =∝
∑ ∑ , [cos ! ] (1)
The two dimensional Discrete Cosine Transformation (DCT2) is defined that frequency of gray scale blocks convert from spatial domain to frequency domain and gain the result of frequency matrix. Discrete Cosine Transformation (DCT) has the characteristic of energy compact. In the following steps, we will observe the distribution of AC values by STD calculation.
Discrete wavelet Transformation
The discrete wavelet transform [10] is a spatial frequency domain disintegration that presents a bendable multi-resolution analysis of an image. In 1-D, the mean of the wavelet transform is corresponding to the signal as a superposition of wavelets. If a isolated signal is correspond to by f(t) its wavelet decomposition is then
# = ∑ $, %&',( )',( # (2)
where m and n are integers.
Infogain Publication (Infogainpublication.com) ISSN : 2454-1311 FIR filter hn. The approximation coefficients a m, n at each
scale can be obtained using the following recursive relation:
*',( = ∑ ℎ, ( ,*' (3)
Where the top level a0,n is the sampled signal itself. In addition, by using a related high pass FIR filter gn the wavelet coefficients can be obtained by
*',( = ∑ -, ( ,*' (4)
To renovate the original signal the examination filters can be selected from a bi-orthogonal set which have a correlated set of synthesis filters. These synthesis filters h (m,n) and g(m,n) can be used to absolutely renovate the signal using the renovation formula:
*' . = ∑ ℎ( ( *',( + - ( &',( (5)
Equations (4) and (5) are implemented by filtering and subsequent down sampling. Conversely equation (3.4) is implemented by an initial up sampling and a subsequent filtering. A single stage wavelet
A Discrete Wavelet Transform (DWT) is an transform for which the wavelets are discretely sampled.
The DWT of a signal x is calculated by passing it through a series of filters. First the samples are passed through a low pass filter with impulse response g resulting in a convolution of the two.
Fig. 5: Three level Filter
At each level in the above diagram the signal is decomposed into low and high frequencies. Due to the decomposition process the input signal must be a multiple of 2n where n is the number of levels. Before process of Discrete Wavelet Transformation (DWT), the original image should be converted into the gray scale first similarly. After Discrete Wavelet Transform (DWT)
transformation we get four sub bands, which are LL, LH,HL and HH. From the Figure 4, the original image shows in 4*4 blocks and the processing and converting are shown in Figure 5. After the DWT, the standard deviation of frequencies in LH, HL and HH Will be calculated in the following steps
Fig. 6: Result of DWT Flowchart of DCT Image Fusion
As shown in flow chart, the function developed to perform the image fusion, has four basic blocks:
Block A: Images size checking. Block B: RGB to Gray Conversion. Block C: DCT domain fusion. Block D: Inverse DCT transform
Fig. 7: Flowchart of DCT
Infogain Publication (Infogainpublication.com) ISSN : 2454-1311
Fig. 8: Flowchart of DWT
As shown in flow chart, the function developed to perform the image fusion has 4 basic blocks:
Block A: images size checking. Block B: RGB to Gray Conversion. Block C: DWT domain fusion. Block D: inverse DWT transform
V. PERFORMANCEANALYSIS
i.Mean square error (MSE)
012 ='(∑ ∑'4 (5 345− 745 (6)
Where,
m is the height of the Image implying the number or pixel rows,
n is the width of the image, implying the number of pixel columns,
Aij being the pixel density values of the perfect image, Bij being the pixel density values of the fused image. Mean square error is one of the most commonly used error projection method where, the error value is the value difference between the actual data and the resultant data. The mean of the square of this error provides the error or the actual difference between the expected/ideal results to the obtained or calculated result.
Here, the calculation is performed at pixel level. A total of m*n pixels are to be considered. Aij will be the pixel density value of the perfect image and Bij being that of the fused image. The difference between the pixel density of the perfect image and the fused image is squared and the mean of the same is the considered error. MSE value will be 0 if both the images are identical.
ii.Peak Signal to Noise Ratio (PSNR):
819: = 10= - >?@,BCDA (7) PSNR is defined as in the above expression. This basically projects the ratio of the highest possible value of the data to the error obtained in the data.
In our case, at pixel level, the highest possible value is 255. i.e. in a 8 bit gray scale image, the maximum possible value is having every bit as 1 ! 11111111; which is equal to 255. The error between the fused image and the perfect image is calculated as the Mean Square Error and the ratio value if obtained. If both the fused and the perfect images are identical, then the MSE value would be 0. In that case, the PSNR value will remain undefined.
iii.Normalized Absolute Error (NAE)
932 =∑NGLM∑KHLMEFGH IGHJ
∑NGLN∑KHLMEFGHJ (9)
Where , m is the height of the Image implying the number or pixel rows n is the width of the image, implying the number of pixel columns.
A(i,j)being the pixel density values of the perfect image. B(i,j) being the pixel density values of the fused image. This is a metric where the error value is normalized with respect to the expected or the perfect data. That is, the net sum ratio between the error values and the perfect values is calculated. The net sum of the error value which is the difference between the expected values and the actual obtained values is divided by the net sum of the expected values.
In our case, the metric is calculated in the pixel level wherein the net sum of the difference between the perfect image and the corresponding pixel values in the fused image is divided by the net sum of the pixel values in the perfect image. The Normalized Absolute value will be zero (0) if both the fused and the perfect images are identical.
iv.Normalized Cross Correlation (NCC)
9&& =∑NGLM∑KGLMEFGH IGHJ
∑NGLM∑KGLMFGH A (10)
Where,
m is the height of the Image implying the number or pixel rows
n is the width of the image, implying the number of pixel columns.
Infogain Publication (Infogainpublication.com) ISSN : 2454-1311 In our case, the metric is calculated as the ratio between the
net sum of the multiplication of the corresponding pixel densities of the perfect and the fused images and the net sum of the squared values of the pixel densities of the perfect images. The Normalized Cross Correlation value would ideally be 1 if the fused and the perfect images are identical.
VI. OBSERVATIONANDRESULT
a. Dataset
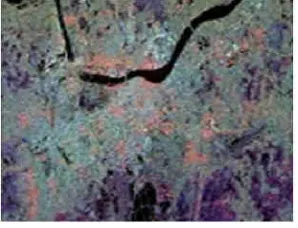
To evaluate the performance of DCT and DWT for image fusion, Synthetic Aperture Radar image of Kolkata city is considered. A dataset is taken from the website [33] http://www.jpl.nasa.gov/radar/sircxsar/. A description of data set used for the experimentation is as follows- This radar image of Kolkata, India, illustrates different urban land use patterns. Kolkata, the largest city in India, is located on the banks of the Hugli River, shown as the thick, dark line in the upper portion of the image. The surrounding area is a at swampy region with a subtropical climate. As a result of this marshy environment, Kolkata is a compact city, concentrated along the fringes of the river. The average elevation is approximately 9 meters (30 feet) above sea level. Kolkata is located 154 kilometers (96 miles) upstream from the Bay of Bengal. Central Kolkata is the light blue and orange area below the river in the centre of the image. The bridge spanning the river at the city center is the Howrah Bridge which links central Kolkata to Howrah. The dark region just below the river and to the left of the city centre is Maidan, a large city park housing numerous cultural and recreational facilities. The international airport is in the lower right of the image. The bridge in the upper right is the Bally Bridge which links the suburbs of Bally and Baranagar. This image is 30 kilometers by 10 kilometers (19 miles by 6 miles) and is cantered at 22.3 degrees north latitude, 88.2 degrees east longitude. North is toward the upper right. The colors are assigned to different radar frequencies and polarizations as follows: red is L-band, horizontally transmitted and received; green is L-band, horizontally transmitted and vertically received; and blue is C-band, horizontally transmitted and vertically received. The image was acquired by the Space borne Imaging Radar-C/X-band Synthetic Aperture Radar (SIR-C/X-SAR) on October 5, 1994, on board the Space Shuttle Endeavour.
SIR-C/X-SAR, a joint
mission of the German, Italian and United States space agencies, is part of NASA's Mission to Planet Earth program.
Space borne Imaging Radar-C and X-Band Synthetic Aperture Radar (SIR-C/X-SAR) is part of NASA's Mission to Planet Earth. The radars illuminate Earth with microwaves allowing detailed observations at any time, regardless of weather or sunlight conditions. SIR-C/X-SAR uses three microwave wavelengths: L-band (24 cm), C-band (6 cm) and X-C-band (3 cm). The multi-frequency data will be used by the international scientific community to better understand the global environment and how it is changing. The SIR-C/X-SAR data, complemented by aircraft and ground studies, will give scientists clearer insights into those environmental changes which are caused by nature and those changes which are induced by human activity. SIR-C was developed by NASA's Jet Propulsion Laboratory. X-SAR was developed by the Dornier and Alenia Spazio companies for the German space agency,
Fig. 9: Image
Deutsche Agentur fuer Raumfahrt angele genheiten (DARA), and the Italian space agency, Agenzia Spaziale Italiana (ASI), with the Deutsche Forschungsanstalt fuer Luft und Raumfahrt e.v.(DLR), the major partner in science, operations, and data processing of X-SAR. Here, the input images are pair of images, with one of them being blurred on right hand side upper most corner while another image is blurred on left hand side upper most corner.
Infogain Publication (Infogainpublication.com) ISSN : 2454-1311
Fig. 11: DCT Image Fusion
Fig.12: DWT Image Fusion b. Observations and Results:
Table1. Performance Parameters
Performance Parameters
Fusion Metho
d
Peak Signal
To Noise Ratio(P SNR)
Mean Square Error(MSE
)
Normali sed Absolut
e Error (NAE)
Normalised CrossCorela
tion (NCC)
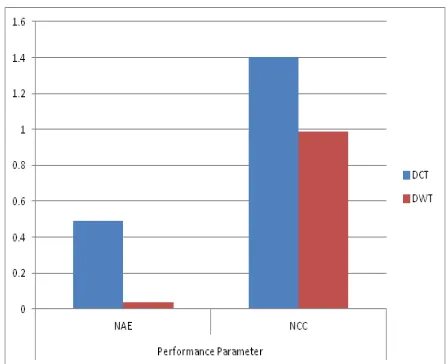
DCT 18.3991 940.0878 0.49 1.4
DWT 31.1174 50.2736 0.038 0.99
Fig. 13: Performance Parameter(PSNR,MSE)
Fig. 14: Performance Parameter (NAE and NCC)
VII. APPLICATIONS
In many applications area, the image fusion plays an important role.
1.Military and civilian surveillance:
Reconnaissance, surveillance and targeting of a selected point as SAR can provide day-and-night imaging, to distinguish terrain features and recognize military staff. It is also used for the non-proliferation of nuclear, chemical and biological weapons
2.On the Ocean:
Infogain Publication (Infogainpublication.com) ISSN : 2454-1311 If we talk about the wave mode sensor in the ERS SAR
satellite, it can provide the scientists of ocean wave direction to make wave forecasting and obtain marine climatology information.
At high latitudes, SAR can detect the ice state, its concentration, thickness, leads detection.
3.Land use change analysis
In forestry and agriculture, SAR images are really important due the wavelength can penetrate the clouds in the most problematic areas, such as the tropics, monitoring the land and its state.
Geological and geomorphological features due the waves can penetrate some vegetation cover and obtain information about the surface covered by it.
To georefer other satellite imagery updating some thematic camps more frequently.
SAR it is also useful to check the aftermath of a flood to assess quicker the damages.
4.Crop stress detection 5.Assessment of deforestation
6.Disaster management (e.g., monitoring of changes during flooding)
7.Ice monitoring
8.Medical diagnosis and treatment 9.Urban planning.
VIII. CONCLUSION
The two image fusion techniques were implemented using MATLAB. The fusion was performed on a pair of input RADAR images. The fused images were verified for their quality based on the image metrics developed and visual perception was compared to assess the credibility of the image metrics. In this project two image fusion techniques based on transform domain, DCT and DWT are used. By the means of the four image metrics developed - PSNR MSE, NCC and NAE the Discrete wavelet transform (DWT) was assessed as the fusion algorithm producing afused image of superior quality compared to the discrete cosine transform (DCT).
REFERENCES
[1] Jingjing Ma, Maoguo Gong, Zhiqiang Zhou,\Wavelet
Fusion on Ratio Images forchange Detection in SAR Images", IEEE Geosci. Remote Sensing Letters, vol.9, No.6, Nov.2012.
[2] P.J. Burt,\The pyramid as a structure for efficient computation", in: A. Rosenfeld (Ed.), Multiresolution Image Processing and Analysis, Springer-Verlag, Berlin, 1984, pp. 635.
[3] E.H. Adelson,\Depth-of-Focus Imaging Process
Method", United States Patent 4,661,986 (1987). [4] A. Toet,\Image fusion by a ratio of low-pass
pyramid", Pattern Recognition Letters (1989) 245 to 253.
[5] R.D. Lillquist,\Composite visible/thermal-infrared imaging apparatus", United States Patent 4,751,571 (1988).
[6] P. Ajjimarangsee,T.L.Huntsberger, \Neural network model for fusion of visible and infrared sensor outputs", in: P.S. Schenker (Ed.), Sensor Fusion, Spatial Reasoning and Scene Interpretation, The International Society for Optical Engineering, 1003, SPIE, Bellingham, USA, 1988, pp. 153 to 160. [7] N.Nandhakumar,J.K.Aggarwal,\Integrated analysis of
thermal and visual images for scene
interpretation",IEEE Transactions on Pattern Analysis and Machine Intelligence 10 (4) (1988) 469 to 481. [8] S.K. Rogers,C.W. Tong, M. Kabrisky, J.P. Mills,
\Multisensor fusion of ladder and passive infrared imagery for target segmentation", Optical Engineering 28 (8) (1989) 881to 886.
[9] L.J.Chipman,Y.M.Orr,L.N.Graham,\Wavelets and
image fusion", in:Proceedings of the International Conference on Image Processing, Washington, USA, 1995, pp. 248 to 251.
[10] Koren, I., Laine, A., Taylor, F., \Image fusion using steerable dyadic wavelet", In: Proceedings of the
International Conference on Image
Processing,Washington, USA, 1995. pp. 232-235. [11] Peter J Burt, Edward Adelson, \Laplacian Pyramid as
a Compact Image Code", IEEE Transactions on Communications, Vol. Com-31,No.4, April 1983. [12] S.Li, B.Yang, J.Hu,\Information Fusion", Elsevier,
2010.
[13] Wang, Qiang, and Yi Shen. \The e_ects of fusion
structures on image fusion
performances",Instrumentation and Measurement Technology Conference, 2004. IMTC 04.Proceedings of the 21st IEEE, vol. 1, pp. 468-471. IEEE, 2004. [14] Aribi Walid,Ali Khalfallah, Med Salim Bouhlel, and
Noomene Elkadri. \Evaluation of image fusion techniques in nuclear medicine", In Sciences of
Electronics, Technologies of Information and
Telecommunications (SETIT), 2012 6th International Conference on, pp. 875-880. IEEE, 2012.
Infogain Publication (Infogainpublication.com) ISSN : 2454-1311 Pattern Recognition (ICSIPR), 2013 International
Conference on, pp. 66-69. IEEE, 2013.
[16] Ghimire Deepak and Joonwhoan Lee.\Nonlinear
Transfer Function-Based Local Approach for Color Image Enhancement", In Consumer Electronics, 2011 International Conference on, pp. 858-865. IEEE,2011
[17] Haghighat Mohammad Bagher Akbari, Ali
Aghagolzadeh, and Hadi Seyedarabi. \Real-time fusion of multi-focus images for visual sensor networks", In Machine Vision and Image Processing (MVIP), pp. 1-6. IEEE, 2010.
[18] He D-C., Li Wang, and Massalabi Amani. \A new
technique for multi-resolution image