ONLINE ADVERTISING DEVELOPMENT AND THEIR ECONOMIC
EFFECTIVENESS
Tchai Tavor
Department of Economics, Emek Yezreel Academic College E-mail: tchai2000@yahoo.com
ABSTRACT
Recent years are a testimony to the astonishing development of the Internet, an increasingly important factor in current lifestyle. Internet advertising, as well, has seen a similar development, since marketers' online advertising budgets are growing as the years go by. In this study, I passed questionnaires to Israeli businesses and checked whether there is a difference in efficiency between two of the following types of online advertisement: banner advertisement and pop-up advertisement. I also characterized the respondents with respect to their preferred type of advertisement. The results of the latter showed that the number of clickers on banner advertisement is higher than that of pop-up advertisement, and that its efficiency rates are higher as well. In addition, the characterization of advertisers gave that the probability to advertise a banner advertisement is higher if the manager is either a female, married, older than 40 and employed in the construction, Car Dealership or wedding industry.
Keywords:Pop Up, Banner, Advertising Budget, Internet, Marketer.
1. INTRODUCTION
The Internet has become a major source of information consumption, and to some extent, has replaced old media such as the radio, television and the newspaper. The main advantages of the Internet include its mass availability and its almost instant access to current information. As a result of the public's reaction to these advantages, Madison Avenue realized the potential of the new media and soon incorporated it to its budget. Convinced by the initial web publications of the early '90s, companies soon instilled momentum in the new channel. Today, more than 700 million people use the Internet daily, mostly so in developed countries (USA, China, Japan, Germany and Britain, e.g) Hoffman and Novak (1996).
The most popular uses of the Internet are searching through data and information, and the purchasing of products and services. In light of these, it is understandable why many companies advertise their products and services online. In addition, advertisers can quickly benefit from changing advertising scripts, from the possibility of better segmenting their market, and from relatively low costs. Due to Internet advertising's proliferation, it is important to examine the factors that affect its effectiveness.
1.1 Internet advertising compared to traditional advertising
Advertising on television, radio, newspapers, billboards or direct mail is based on large exposure and a particularly wide audience. Internet advertising, on the other hand, is based on relatively few channels that coalesce to bring forth a maximized target customer.
Internet is the world's most powerful media advertising for two main reasons: First, almost every home has continuous access to the Internet. Second, the Internet has a daily audience that is greater than the sum of the entire historical audience of traditional media. The possibility of reaching a predefined target audience leverages the brand, induces the effectiveness of the website’s sales, and conduces the transfer of information to consumers.
Internet advertising helps to market products and services through interactive and colorful catalogs and provides audience with current and available information. It also allows them to make both local and international purchases. Today, there are numerous websites designed to promote sales and to maintain relationships with customers. As opposed to other media tools, a company website can provide more comprehensive information on the product line and can turn directly to the target audience. With this information, the target audience can make the purchasing decision more efficiently. Luk, Chan and Li (2002).
1.2 Advantages and disadvantages of online advertising
Another advantage is that some online advertising is less annoying than usual advertising. Television and radio commercials may interfere with the consumer and come in a non-controlled and unexpected way. Online advertising is somewhat more acceptable because surfers have the ability to control the time when, the place where and the amount of information that can be derived from the site Zheng and Yeqing (2002).
From the advertiser’s point of view, everything is dynamic. The content and the details can be changed immediately and no waiting for a new edition, for instance, is required. Internet advertising is also cheaper than other media and marketers can achieve an exposure to a targeted audience at a low-cost and to locate groups of consumers who share the same interests. Interactivity of the Internet is another significant factor, in that it allows users to express their reaction to the ad by a mere click. Yoon and Klim (2001).
On the other hand, the Internet has quite a few disadvantages. The first and most prominent disadvantage is probably the lack of user privacy. Many marketers track users’ activities online and send marketing messages that relate to their interests despite the users’ wishes. Another disadvantage is that there are many types of online advertisements, such as pop-up ads (commonly perceived to be rather annoying). In the latter case, the users’ original activity is disrupted and they are forced to watch unwanted advertisements. This may cause unwanted results such as the taking the consumers’ negative attitude towards the ad and transferring that frustration to the company.
Third disadvantage is the confusion that may result from the complexity of online advertisements; as those often consist of a long text, photos, music and video. In addition to the disadvantages that were presented, Internet users still believe that the Internet is used to achieve goals, tasks and information, so they avoid looking at Internet advertisements broadly.
1.3 The major means of online advertising
In a research published on interactive advertisement, Rodgers and Thorson (2000) count five different formats of advertisements that are found on the internet. They include sponsorship, keyword linking, commercial sites, pop-up advertising and banners. Since then, other formats have begun to gather momentum, and others still will probably do so in the future.
1.3.1 Sponsors
In recent years, online sponsorships have increased from 24% to 37% of all new means of interactive media. Online sponsors appear on a specific site or a special section on the site in order to give the advertiser a visibility for marketing purposes. For example, the logos of Macy's and Pfizer both appear in the official website of the American Heart Association, along with the added text "Macy's and Pfizer are the proud sponsors of the American Heart Association, for the women campaign Go Red b”, Interactive Advertising Bureau (1999).
1.3.2 Sponsored link words
Studies have found that at least half of Internet surfers use search engines. As a result, an increasing number of advertisers use keywords to ascertain that their messages are brought to the first places in the search results. When the potential customer insert a specific keyword to the engine search (Google, Yahoo, etc.), the engine scans the entire customer base that pays for those words and provides a list of related sites. Results generally appear at the top or at the side of the search engine and are called sponsored links Overture (2003).
1.3.3 Commercial sites
A commercial site is a website used by companies or economic entities to transmit information about products or services that they are marketing. There is disagreement among marketers whether commercial websites should be considered as advertising, but in recent years there has been a growing consensus that they should. A study conducted by Singh and Dalal (1999) showed that the homepage of commercial sites portrays the same basic features (to inform and to persuade) as do other media network and should therefore legitimately be considered advertising proper.
1.3.4 Pop-up advertisements
Internet users have less control over the floating advertisements because they often cannot close the window to stop the advertisement, Cong and Robert (2005). Unlike banners assimilated in complex sites, pop-up advertisements are considered annoying. This way, one might be able to increase product awareness, but that does not necessarily ensure the ad’s effectiveness.
1.3.5 Banners
A banner is an advertising sign/film that is part of the web page’s tapestry, and when clicked on, links the clicker directly to the advertiser’s chosen website. Such advertisements are usually placed at the top of the page, at the margins or at the bottom. That way, they do not interfere with the activity of the surfers. Steven, Hairong and Joo-Hyun (2002).
The banner represents the largest share of online advertising and all advertising agencies use it. The sites that are selected for banner advertising are generally sites with large number of visitors. Two types of banner advertising can be distinguished: a dynamic commercial and a static advertisement. Static advertisements are interactive but with no movements or font exchanges. Dynamic commercials, on the other hand, are more experiential and so producers can benefit by the use of animation, music, color and motion.
As mentioned above, the banner is located mostly on the margins of the site so it does not interfere with users’ activities. The user does not have to strain to avoid a banner advertisement, and if they would like to receive more information about the product, they can click on the banner and go to the selected site, Ramaraj and Suzanna (2003). The main difference between traditional advertisement and banner advertisement is that a banner does not fully occupy the screen and forces the viewer to sit through the ad (as it does on television, e.g). Another study found that the cost of banner advertisement is negligible, Ronald and Barbara (2002).
Because the banner already consists of text, images and music, and often so in a complicated manner, a website that is complicated still will most likely reduce the effectiveness of the ad, and spur negative attitudes on behalf of the viewers.
1.4 The difference between banner advertisement and pop-up advertisement
Banner advertising is considered less intrusive than pop-up advertising because it is part of the visual background of the page as opposed to pop–up and floating advertisements that appear automatically and unexpectedly. In the latter case, the original activity of the users is disrupted and they have to see unwanted advertisements – hence, an unpopular and frustrating endeavor. Overall, it is argued that this form of advertising has a largely negative effect, given both the disturbance caused by the ad, and the large size of the media files, often causing a slowing down of the computer’s processing time, Cong and Robert (2005).
Banners are the traditional structure of Internet advertising. However, its proportion decreased when richer media technologies began to appear. Incidentally, the declining number of clicks on banners has worried advertisers and has forced them to seek other alternatives, rich media being one of them. Rich media advertisements contain new and sophisticated technological tools, such as: JAVA, Macromedia Flash, HTML, VRML, etc.
These tools are designed to manifest a better visual and sonic experience. With the rise in popularity of this form of advertisement, new tactics (pop-up, for instance) were developed to allow for the fast delivery of rich media.
1.5 Web properties that affect advertising
Unlike in older media such as the radio or television, in the Internet consumers are able to directly control the content viewed. In addition, through the Internet, both the viewer and the publisher influence each other, intricately exchanging data through a complex calculus that allows for nothing less than a mass and interactive dialogue. The result is a medium that systematically refreshes data transfer without bound of space or time. Still, the appearance of cookies, a digital record of the surfer’s electronic address, jeopardizes consumer trust and induces a feeling of a lack of privacy. More recently, companies that seek to advertise online are beginning to take measures to protect the users’ privacy, Goldsmith and Lafferty (2002).
1.6 Effectiveness of online advertising
It is generally agreed that advertisements serve two functions: to inform and to persuade. Information creates awareness about a good, and persuasion induces a positive inclination towards that good, not necessarily one that stems from that information. It would thus be reasonable to assume that the dynamic nature of the internet and the advertiser’s ability to adjust information would be essential for its effectiveness. Indeed, in Ronald and Barbara (2002), it was found that the effectiveness of online advertising is derived mostly from its interactive nature. Estimating the effectiveness of an ad is an integral part of the marketing campaign. Once an ad reaches its target audience in a beneficial way, the usefulness and profitability of the campaign rises. Advertisements can be useful in several of the following ways: in making a stand, increasing levels of familiarity, recollection and degrees of identification.
1.7 The impact of the internet on brand
Ronald and Barbara (2002) examine the stands of consumers toward Internet advertisements by discerning their attitude towards the website where the ad is published. Their results show the following: there is a positive relation between the consumer’s stand towards the website and their relation towards the ad. They also showed that the consumers’ stands toward the site are primarily driven by the site’s content and the way in which that content is organized. This was a rather novel approach, as most studies seek to discover demographic variables and purchasing patterns.
The effects of the design of the site were further examined by Luk, Chan, and Li (2002). They found that there is an inverse relation between the amount of pictures and links used on the site and the effectiveness of the ads. The rationale lies with the fact that when a website is inundated with large amounts of images and links, there is a mass exiting of users from the site, confused by the plethora of expendable information.
2. METHODS
In this study, I would like to check two types of tests for two different questions. First, to check whether there is a difference in efficiency between pop-up advertisement and banner advertisement. Second, to check the properties of decision-makers for the two types of advertisements.
2.1 First Test
The first question will be examined using paired t-test. This test is suitable for examining a relationship between two dependent samples.
The statistical value is calculated as follows: (1)
Where:
dav - Differentials averaged over all subjects
SD - Standard deviation of all differentials
N - Number of pairs (those for which there are two observations)
We compare the statistical value against the appropriate value from table, t, with the desired confidence level, α, and the appropriate number of degrees of freedom, N-1.
2.2 Second Test
The second question analyzing the variables that determine the preference to click on either a banner ad or a pop-up advertisement. To answer the question, we shall characterize the decision-makers according to their socio–economic variables.
This is a binary decision to be handled with a binary logistic model based on the following utility function: (2)
U
ij
j'
Z
i
ijWhere βj is the vector of coefficients to be estimated,
Z
i is a vector of decision makers i’s socio-economic characteristics and stated attitudes, and
ij is an error term linked to the fact that we do not observe actual utility but only the fact of belonging to a specific sub-group.Using the assumption that the error terms are independent, identically distributed and follow the Extreme Value Distribution, the probability that an individual i belong to category j is:
(3)
jz z
ni ni
ni
e
e
P
''
And the probability lies between 0 (pop-up advertisement preferred) and 1 (banner advertisement preferred). This could be written as:
N
SD
d
t
av/
(4)
...
1
ln
1 1
2 2
z
Z
p
P
LogitP
ni ni
ni
Logistic regression measures the model estimation fit using -2log of the likelihood value (-2LL), where 0 corresponds to a perfect fit.
3. DESCRIPTIVE STATISTICS
In this study, 1000 questionnaires were sent to key people in several business areas in Israel. The questionnaires were sent to senior executives, sales managers, operational managers, and to other similar title holders. Respondents were first given a brief description of the study and were communicated via email. The purpose of the questionnaire was to see if there is a difference in efficiency between two types of advertising, and to characterize the respondents with regards to their advertisement preference.
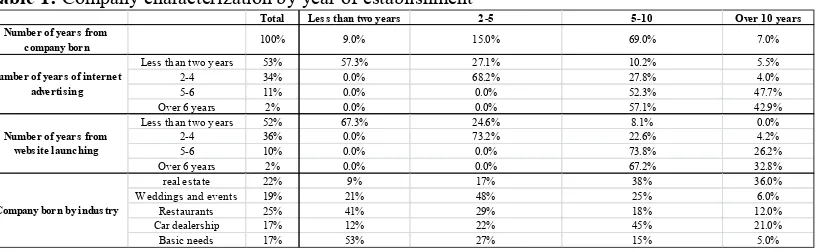
Table 1: Company characterization by year of establishment
Total Less than two years 2-5 5-10 Over 10 years
Number of years from
company born 100% 9.0% 15.0% 69.0% 7.0%
Less than two years 53% 57.3% 27.1% 10.2% 5.5%
2-4 34% 0.0% 68.2% 27.8% 4.0%
5-6 11% 0.0% 0.0% 52.3% 47.7%
Over 6 years 2% 0.0% 0.0% 57.1% 42.9% Less than two years 52% 67.3% 24.6% 8.1% 0.0%
2-4 36% 0.0% 73.2% 22.6% 4.2%
5-6 10% 0.0% 0.0% 73.8% 26.2%
Over 6 years 2% 0.0% 0.0% 67.2% 32.8% real estate 22% 9% 17% 38% 36.0% Weddings and events 19% 21% 48% 25% 6.0% Restaurants 25% 41% 29% 18% 12.0% Car dealership 17% 12% 22% 45% 21.0% Basic needs 17% 53% 27% 15% 5.0%
Company born by industry Number of years of internet
advertising
Number of years from website launching
Explanation of table data:
69% of companies in the sample established the company five to ten years ago.
53% of all companies in the sample have been advertising online for less than two years. 57.3% of this group formed their company during this period.
36% of all companies in the sample have set up a site two to four years ago. 73.2% of this group formed their company two to five years ago.
22% of all companies in the sample engaged in Real Estate. 36% of this group formed their company more than ten years ago.
Table 1 reviews the company's properties in relation to its date of establishment. One can first notice, however, that most of the sampled companies have seniority (have existed between 5 to 10 years). One can also spot a relation between the age of the company (when under 5 years) and the rate at which they advertise online. With regards to the establishment of a website, it can be seen from the table that most companies established during the last 10 years, have also opened a website close to the date of business establishment. 67.3% of all companies that established a website during the past two years, also established the company during this period.
There is also an empirical relation between the company’s date of establishment and its industry. Namely, the oldest companies in the sample are in the Real Estate and Car Dealership industries while the newest companies come from the basic need (food, clothing, etc.) industries.
Table 2: Company characterization by monthly expenditure on advertising
Total Less than 5,000 NIS Between 5,000 and 10,000 NIS Between 10,000 and 20,000 NIS Over 20,000 NIS
Total advertising budget 100% 14.1% 37.4% 43.4% 5.1%
Intuitive 23% 42.9% 21.4% 28.6% 7.1%
Constant 28% 27.0% 32.4% 32.4% 8.1%
Prices 36% 16.7% 26.2% 40.5% 16.7% Historical effectiveness 12% 0.0% 40.0% 60.0% 0.0% Less than 25% 48% 50.0% 35.7% 14.3% 0.0% 25% - 50% 32% 43.2% 37.8% 18.9% 0.0% 50% - 75% 20% 51.2% 25.6% 23.3% 0.0% 75% - 100% 0% 40.0% 40.0% 20.0% 0.0%
Advertising budget considerations
Budget percentage of internet advertising
Explanation of table data:
14.1% of companies in the sample spend an average of less than – 5,000 NIS on advertising in various media: television, newspapers, internet and others.
23% of companies in the sample divide the advertising budget in an intuitive way. 42.9% of companies in this group spend less than 5,000 NIS per month on advertising.
Table 2 reviews the company's properties in relation to the average monthly spending on advertising. The table shows that most companies spend between 5,000 NIS to 20,000 NIS per month on advertising. It was also found that companies that spend large amounts on advertising divide their budgets based on both the historical effectiveness and the cost of advertising in the various media. Furthermore, companies that spend low amounts on advertising, focus mainly on the online channel.
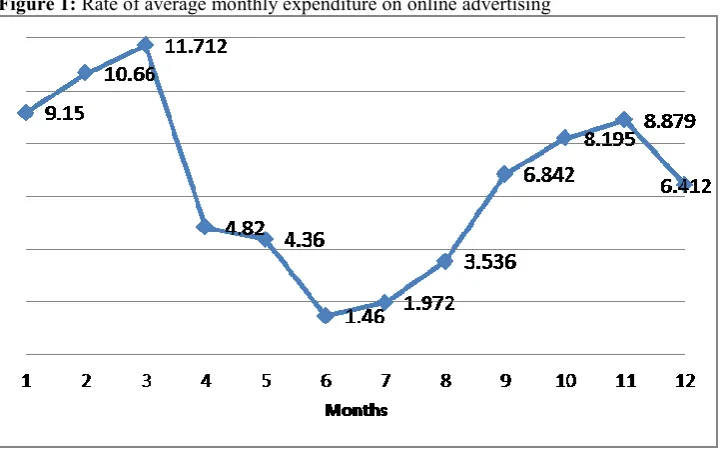
Figure 1: Rate of average monthly expenditure on online advertising
Figure 1 shows the distribution of average monthly expenditure by month. Respondents were asked to rate the degree of monthly spending, where 1 is lowest and 12 is highest. Two patterns can be seen. The periods before Passover (between February and March) and during the Tishrei Holidays (between October and November) are marked with a significant rise in advertisement spending. The period before the beginning of the summer (June and July) see a radical decrease in advertising spending. The former phenomenon can be explained by noticing that these holidays are generally accompanied by significant consumer spending on such goods. The latter phenomenon can be explained by the fact that during the summer months, most consumers spend more money on vacations and other similar expenses and hence advertisers keep their budget low during these months.
Table 3: Company characterization by annual expenditure on Internet advertising
Explanation of table data:
In 2008, companies in the sample spent an average of 19,400 NIS on Internet advertising. In this year, the Real Estate industry spent an average of 18,763 NIS.
Table 3 describes the average annual spending on Internet advertising during the four years from 2007 to 2010. It can be seen from the table that during the crisis year of 2009, advertisers spent less than in other years. Relative to general industry, it can be seen that the wedding and entertainment industries saw the most spending on online advertising. The industry's most volatile sector (standard deviation of 4,550 NIS) is the Real Estate. The industry's most stable sector (standard deviation of 1,480 NIS) is the basic consumption industry - it saw no change during the year of crisis.
2007 2008 2009 2010
Investment by year 16800 19400 14500 17000
Real Estate 13456 18763 9025 18156
Weddings and Events 19078 24267 20136 19368
Restaurants 18368 19467 13456 16682
Car Dealership 17568 16527 13253 16265
Basic Needs 15530 17976 16630 14529
Table 4: Additional findings on company website and advertisements
Every day Every few days Every week Each month
24% 37% 31% 8%
External company Company employee
26% 74%
Information Photos and information Photos
14% 42% 44%
Local Site Specific site National Sites Web search engine
22% 38% 18% 22%
Website
Update frequency of the website
Who design the advertisements and the website?
Desirable advertisement
Types of advertising sites Advertisements
Table 4 represents additional data from the questionnaire for the company's web site – another source of advertising. It can be seen that a company website’s updating frequency is generally between a few days to once a week. For 74% of the companies in the sample, the person responsible for designing and updating the website is a company employee and not a third-party. Most companies (86%) were found only to be using either an image or an image and some textual information. A majority also decided to advertise their ads in websites specific to their occupation.
Figure 2: Characterization of company managers against type of industry
Figure 2 shows the characteristics of managers in a given industry. It can be seen that in the Real Estate and Car Dealership industries, the managers are oldest (mean age of 56.5 years) and are married, while in the basic need and restaurant industries, the managers are youngest (mean age of 29.5 years) and are single. In a managers’ gender test, it can be seen that there are more male managers than female ones across the board. In the Real Estate, Car Dealership and wedding industries, however, this phenomenon is rather pronounced, while in the restaurant industry, not so much.
4. RESEARCH RESULTS
The two main types of online advertising are banner advertisement and pop-up advertisement. In this section, I will check the effectiveness of two types of advertisements, and also characterize the types of managers for the types of advertisement using logistic regression.
4.1 Comparing the effectiveness of advertising
Figure 3:Banner advertising effectiveness compared to pop-up advertising
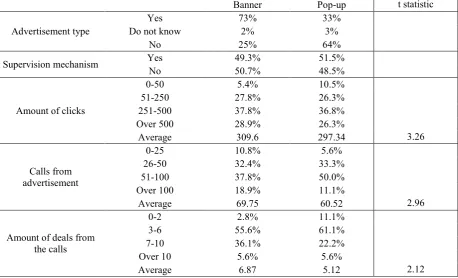
Table 5: Comparison between pop-up and banner advertising
Banner Pop-up t statistic
Advertisement type
Yes 73% 33%
Do not know 2% 3%
No 25% 64%
Supervision mechanism Yes 49.3% 51.5%
No 50.7% 48.5%
Amount of clicks
0-50 5.4% 10.5%
51-250 27.8% 26.3%
251-500 37.8% 36.8%
Over 500 28.9% 26.3%
Average 309.6 297.34 3.26
Calls from advertisement
0-25 10.8% 5.6%
26-50 32.4% 33.3%
51-100 37.8% 50.0%
Over 100 18.9% 11.1%
Average 69.75 60.52 2.96
Amount of deals from the calls
0-2 2.8% 11.1%
3-6 55.6% 61.1%
7-10 36.1% 22.2%
Over 10 5.6% 5.6%
Average 6.87 5.12 2.12
4.2 Testing Properties of advertiser by type of advertisement
In this section I will characterize the decision makers by type of advertisement that they choose to publish using logistic regression. Variables are defined as follows:
Gender: Male =1, Female = 0 Age: continuous variable Status: Married = 1, Single = 0
Industry: Real Estate = 1, Weddings and Events = 2, Restaurants = 3, Car Dealerships = 4, Basic Needs = 0 Years: 2008 = 1, 2009 = 2, 2010 = 3, 2007 = 0
Table 6, by using logistic regression, portrays the relationship between the social–economic variables and advertisement type
Table 6: Logistic regression results
(Dependent variable is type of advertisement. Banner = 1 and Pop-up = 0)
Variable Coefficient Standard error z
Constant 0.629 0.184 6.701
Gender -0.374 0.0758 -4.934
Status 1.146 0.396 2.894
Age 0.02184 0.00424 5.151
Industry_Real Estate 4.267 1.354 3.151
Industry_Weddings and Events 2.535 1.18 2.148
Industry_Restaurants -1.878 1.062 -1.768
Industry_Car Dealership 3.923 1.26 3.113
Years_2008 -0.845 1.24 -0.681
Years_2009 -3.073 1.029 -2.986
Years_2010 -2.629 0.937 -2.806
N=1000
Log likelihood = -891.6 Pseudo R2 = 0.69
From the results of Table 6 we derive several conclusions:
1. The probability that a woman will choose a banner advertisement is higher than that of a man choosing it. 2. The probability that a married man will choose a banner advertisement is higher than the probability that a
single man will do so.
3. The older the respondent, the higher the probability of choosing a banner advertisement.
4. In the Real Estate, wedding and Car Dealerships industries, the probability of publishing a banner advertisement is higher than it is in the basic need industry. Similarly, these industries also have the highest number of managers. It was also found that there is no difference between the restaurant industry and the basic need industry with regards to ad type preferences.
5. As the years go by, there is a transition from using banner advertisements to pop-up advertisements. In 2009 and 2010, the probability of choosing a pop-up advertisement was higher than that of a banner advertisement. In 2008, no significant difference was found between the two. From the data, the estimation results can be obtained using the following equation:
Z = 0.629 - 0.374Gender + 1.146 Status + 0.02184Age + 4.267 Industry_Real Estate + 2.535Industry_Weddings and Events + 3.923Industry_ Car Dealership -3.073 Years_2009 - 2.629 Years_2010
And the probability of the outcome is obtained by:
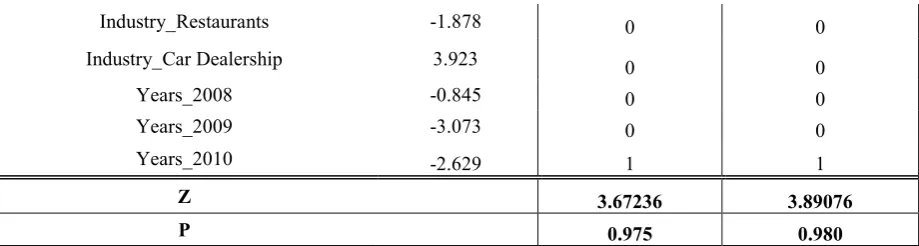
Variables Coefficient Twenty-nine Thirty-nine
Constant 0.629 1 1
Gender -0.374 1 1
Status 1.146 1 1
Age 0.02184 29 39
Industry_Real Estate 4.267 1 1
As an example, let us examine the difference between a 29 year old, married, male manager in the Real Estate industry and the same person, 10 years older, ceteris paribus. A sample of the data appears in Table 7.
Table 7: An example for the logistic regression.
It can be seen that the probability for the younger manager to choose a banner advertisement is 97.5%. This probability increases to 98% for the older manager.
We can check the marginal effect of the manager’s age using the following formula:
That is, an extra year in the age of the manager increases the probability of publishing a banner advertisement by 0.0532%.
5. CONCLUSIONS
The Internet has become a major source of information consumption, and to some extent, has replaced old media such as the radio, television and the newspaper. The main advantages of the Internet include its mass availability and its almost instant access to current information. As a result of the public's reaction to these advantages, Madison Avenue realized the potential of the new media and soon incorporated it to its budget. The two main types of online advertisements are the less intrusive, conservative, banner advertisements, and the aggressive pop-up advertisements. The present study sought to examine the relative effectiveness of the two types of advertisements and to discover the unique characteristics that classify one manager as a predominantly banner preferring and another manager preferring another tool.
With regards to efficiency, three stages were examined. The first determined whether a user finds more interest in a banner or a pop-up advertisement. The second discovered if there is a difference between the calling rate induced by each of the two forms of ads. The third, whether one type of ad increases sales more than the other. It was found that, with regards to all three stages, banner ads were more efficient. Viz., the number of users that clicked on a banner advertisement was higher, the percentage of callers was higher, and the percentage of clients was higher than those for a pop-up advertisement. In the second part of the study, features of the manager most likely to choose one ad form over another were revealed. It was found that the probability that a manager will choose a banner advertisement is higher if the manager is either a female, married, older, employed in the Real Estate, Car Dealership or wedding industries.
Out of the sampled companies, most have existed between five and ten years, and have only marketed their products for the past two. During those years, the share of online advertising has conclusively been growing, but it still smaller than the shares in the other media. One possible explanation is the expansion of social networks, allowing advertisers to contact potential customers at no charge at all.
Although online advertising has been gaining momentum and has been growing during the past several years, the optimal type of advertising has yet to be discovered.
REFERENCES
1. Cong L. and M. Robert, 2005, "Different forced-exposure levels of internet advertising: An experimental study on pop up ads and interstitials", American academy of advertising, Conference Proccedings, 200- 208.
Industry_Restaurants -1.878 0 0
Industry_Car Dealership 3.923 0 0
Years_2008 -0.845 0 0
Years_2009 -3.073 0 0
Years_2010 -2.629 1 1
Z 3.67236 3.89076
2. Goldsmith R.E. and B.A. Lafferty, 2002, "Consumer Response to Web Sites and their Influence on Advertising Effectiveness", Internet Research: Electronic Networking Applications and Policy, 12(4), 318-328.
2. Hoffman D.L. and T.P. Novak, 1996, "Marketing in hypermedia computer-mediated environments",
Journal of Marketing, 60, 50-68.
3. Interactive Advertising Bureau, 1999, IAB Internet advertising revenue report. Retrieved from http://www.iab.net/resources/adrevenue/archive_1999.asp
4. Luk S., W. Chan, and E. Li, 2002, "The content of internet advertisements and its impact on awareness and selling performance", Journal of marketing management, 18(7/8), 693- 720.
5. Overture,2003, History & evolution of search marketing, Available from http://adage.com
6. Ramaraj P. and A. W. Suzanna, 2003,"Impact of Online Consumer Characteristics on Web-Based Banner Advertising Effectiveness", Global Journal of Flexible Systems Management, 4, 15-25. 7. Rodgers S. and E. Thorson, 2000, "The interactive advertising model: How users perceive and
process", Journal of Interactive Advertising, 1(1), Available online: http://jiad.org/vol1/no1/rodgers/index.html.
8. Ronald E.G. and A.L. Barbara, 2002, " Consumer response to Web sites and their influence on advertising effectiveness", Internet Research, 12(4), 318 – 328.
9. Steven, M.E., L. Hairong and L. Joo-Hyun, 2002, "Forced exposure and psychological reactance: Antecedents and consequences of the perceived intrusiveness of pop-up ads", Journal of Advertising, 31, 83-95.
10. Singh S.N. and N.P. Dalal, 1999, "Web home pages as advertisements", Communications of the ACM, 42(8), 91-98.
11. Yoon S.J. and J. Klim, 2001, "Is the Internet more effective than traditional media? Factors affecting the choice of media", Journal of advertising Research, 41(6), 53- 61.
12. Zheng Z. and F. Yeqing, 2002, "Users attitudes toward web Advertising: Effects of Internet Motivation and Internet Ability", Advanced in Consumer research, 29(1), 71-78.
APPENDIX
Online advertising questionnaire
1) How many years is the company that you manage exist? • Less than two years.
• 2-5 years. • 5-10 years. • Over 10 years.
2) What is the average monthly budget that the company spends on advertising in various media? • Less than 5,000 NIS.
• 5000-10000 NIS • 10000-20000 NIS • Over 20,000 NIS
3) What are your considerations while dividing the advertising budget on the various media? • Intuitive (by gut feeling.)
• The division remains constant each month.
• According to the prices of the media means on a given day. • According to effectiveness reports of the media in previous months.
4) What percentage of this budget is for online advertising? • Up to 25%
• 25% -50% • 50%- 75% • 75% -100%
4.1) Rate from 1 to 12 the months of the year so that 1 is the month in which you assign the smallest amount for online advertising and 12 is the month in which you assign the most money for online advertising.
month 1 2 3 4 5 6 7 8 9 10 11 12
4.2) what is the budget which you dedicated in recent years to online advertising?
year 2007 2008 2009 2010
budgeting
5) For how many years does your business advertise online? • Less than two years.
• 2-4 years.
• Between 5-6 years. • Over 6 years.
6) In which types of web sites does the company use to advertise? • Local sites.
• Sites that are defined into the field you are engaged in • Sites nationwide.
• We promote our site in search engines.
7) Does your business use to publish online banner advertising? • Yes.
• do not know. • No.
If you answered – yes on question 7, continue to answer questions 8-11 if you answered - Do not know / no, skip to question 12
8) Is there a mechanism that checks how many applications received after consumers ”clicked" on the banner? • Yes.
• No.
9) What is the average monthly ”clicks" amount in the months you published a banner advertisement? • 0-50
• 51-250 • 251-500 • Over 500
10) How many applications does the office get in an average month by consumers who saw the banner advertisement in one of the web sites?
• 0-25 • 26-50 • 51-100 • Over 100
11) What is the monthly average amount of closing deals as a result of these applications? • 0-2
• 3-6 • 7-10 • Over 10
12) Does your business use to publish online pop - up advertisements? • Yes.
• do not know. • No.
If you answered - yes on question 12, continue to answer questions 13-16 if you answered - do not know / no, skip to question 17
13) Is there a mechanism that checks how many applications received after consumers ”clicked" on the pop-up advertisement?
14)What is the average monthly ”clicks" amount in the months you published a pop-up advertisement? • 0-50
• 51-250 • 251-500 • Over 500
15) How many applications does the office get in an average month by consumers who saw the pop-up advertisement in one of the web sites?
• 0-25 • 26-50 • 51-100 • Over 100
16) What is the monthly average amount of closing deals as a result of these applications? • 0-2
• 3-6 • 70-10 • Over 10
17) For how many years does the company manage an independent web site? • Less than two years.
• 2-4 years. • 4-6 years.
• More than 6 years.
18) How often does the business update the website? • Every day.
• Every few days. • Every week. • Once a month.
19) Who designs the advertisements and the site for a business?
• An external professional company specializing in marketing and graphics. • One of the agency employees who has professional training.
• One of the agency employees, the advertisements and the site are very routine.
20) What do you think should appear on an online advertisement that promotes your business? • A lot of information about the services that the business provides.
• Pictures and information in an equal relation. • Primarily Slideshow of products.
Personal questions:
21. Sex of respondent: Male / Female 22. Age of respondent: ___________ 23. Position in Company: _____________
3. Marital status:
widower divorced married single
4. Company’s line of field: