https://dx.doi.org/10.22161/ijaems.4.5.13 ISSN: 2454-1311
Comparing the Dynamic Impact of Hybrid
Distributed Generation with Single Source DG
P. K Olulope
Ekiti State University, Ado- Ekiti,Nigeria
Abstract—Due to the natural intermittent properties of some renewable energies, the grid is subjected to instability, insufficient power delivery and fluctuation. When these renewable energies are combined together to address the challenge of power shortage, increasing energy demand, and voltage drop, the grid is subject to different stabilities issues compare to the single energy source. This paper compares the dynamic behavior of single energy with mixed energy sources. The paper compares the impact of DFIG alone, Solar PV alone and Small Hydro power alone with hybrid type under distributed generation concept on transient stability of power system. To investigate this investigation, a DIgSILENT power factory library models was used as a component model for wind Turbine / Solar PV and small hydropower system. The simulation was carried out on single machine infinite system.
Keywords— Distributed Generation, Hybrid distributed generation, export modes, stability margin, single energy source.
I. INTRODUCTION
Hybrid distributed generation with multi- source is common in the present day electric grid due to the steep rise in electrical demand across the globe. Two or more energies are combined together to reduce incessant load shedding. The hybrid system is connected to distribution system in order to reduce voltage drop which often occur when the load is far from the generating stations. Besides, market deregulation and growing concern about global warming and climate change, the desire to reduce greenhouse gas emission is driving the power and energy sector in general away from the traditional vertical integration and cost-based regulation towards increased exposure to market forces. Under DG paradigm small generators also known as distributed generators are connected close to customers at the distribution level in other to solve the challenge of voltage drop. Generally, single source DG has been employed to solve the challenge of Voltage drop. Common among them are Solar PV, wind Turbine, etc. However, when these DGs
are hybridized together to form two or more energy sources, they could form a viable energy sources that can have more impact than the single energy source. Hybrid distributed generation is preferable due to their complementary roles but have different dynamic behaviors which could impact negatively on the system than single energy source. Hybrid distributed generation can be defined as a small set of co-operating units that generates electricity and heat, with diversified primary energy carriers(Renewable and non-renewable), while the coordination of their operation takes place by utilization of advanced power electronics and are located closed to the consumers end. They are either grid connected or standalone system, renewable or non-renewable system [1]. It can be described as distributed generation when it is connected close to the consumers to deliver power to local or industrial load [2]. The used of Currently, there are wide-spread uses of distributed generation across the globe though the level of penetration is still low [2, 3]. In 2011, few grid systems have penetration levels above five percent. Examples are Denmark – 26%, Portugal – 17%, Spain – 15%, Ireland – 14%, and Germany – 9%. For the U.S. in 2011, the penetration level was estimated at 2.9% [4].Germany, Demark and Ireland are already proposing a significant proportion of installed capacity to be connected to the distribution system below 100kV [5]. By year 2020, the penetration level of DG in some countries such as
https://dx.doi.org/10.22161/ijaems.4.5.13 ISSN: 2454-1311
Because some of renewable energy sources can complement each other, multi-source alternative energy systems have great potential to provide higher quality and more reliable power to consumers than a system based on a single source [9]. The larger the penetration level of hybrid distributed generation (HDG) in a power system, the more difficult it becomes to predict, to model, to analyze and to control the behavior of such system [9]. Some HDG using induction generators are not grid friendly because they consume reactive power instead of generating it. Most power converters do not have adequate control mechanism to actively support DG integration. The system inertia for some of them (e.g., solar PV or fuel cell) is extremely low. They are weather dependent with constant daily load variation [10]. Also, existing protection mechanism might not be able to take care of the problem of bi-directional power flow that takes place due to DG connection in radial networks. New design controllers are needed to effectively manage the multi-energy sources distributed generation in other to service remote villages.
Due to the natural intermittent properties of wind and solar PV, stand alone wind/PV renewable energy systems normally require energy storage devices or some other generation sources to form a hybrid system. The possibility of hybrid system is shown in fig 1.
In an electrical power grid without energy storage, energy sources that rely on energy stored within fuels (coal, oil, gas) must be scaled up and down to match the rise and fall of energy production from intermittent energy sources. In this way the operators can actively adapt energy production to energy consumption in other to increase efficiency and lower the cost of energy production and to facilitate the use of intermittent energy sources. In the USA the demand for electricity generation is mainly driven by price volatility i.e using distributed generation for continuous use or for peaking use (peak shaving) [3]. During seasonal changes, some energy sources might have to switch on during off peak hour while others during peak hour in other to reduce cost and enhance load balancing within the system. These configurations among many other things need to be investigated to know the dynamic interaction between the hybrids distributed generation and the grid.
Several works have been done on distributed generation but most of the work is based on single energy source [9, 10, 11, 12 and 13]. Ref [14] investigated the impact of high penetration of DG on transient stability. The DGs considered in the case study are rotary generator and non-rotary generator. It is found that DG influences the system transient
stability differently depending on DG penetration levels, DG grid- connection-strength, different DG technologies, and DG protection schemes. Reference [8] modeled and examined the dynamic impact of fuel cell on transient stability of power system network. Reference [15] investigated the impact of high penetration of Solar PV on the transient stability. Several other papers reported the dynamic state of the system as the penetration level increases.
Also several hybrid power systems have been developed [16-17]. An isolated network for very low voltage decentralized energy production and storage based on photovoltaic and wind was developed, mainly considering the energy management and control
of the photovoltaic and wind hybrid system [18]. A grid connected hybrid scheme for residential power supply based on an integrated PV array and a wind-driven induction generator were discussed [19, 20].
However, all the hybrid power systems were based on steady state, unit sizing, optimization techniques in other to extract maximum power from the hybrid system and standalone. None of them mention transient state and none either consider additional energy sources such as small hydropower system. Interaction of HDG interaction, additional power transmitted across distribution corridor, unexpected fault, bidirectional power flow form Hybrid DG, electromechanical oscillation due to system with different inertia constant, torsional interaction of wind turbine with power system control and grid are some of the new things to investigate for effective integration of HDG in other to prevent the future grid from any unexpected cascaded event that can lead to serious technical challenges. This study investigates the dynamic impact of hybrid Wind/ PV/small Hydro power on transient stability. To investigate this impact, the modeling of grid connected wind /Solar PV/small hydro power with single machine infinite system were carried out in DIgSILENT power factory. The configuration of the proposed typical grid connected hybrid distributed generation (HDG) consists of converter driven synchronous wind generator Solar PV and small hydro power. The wind turbine is integrated through PWM converter into the existing grid while the solar PV incorporated into the system consists of DC sources integrated through PWM inverter. The small hydropower system is modeled as synchronous generator.
https://dx.doi.org/10.22161/ijaems.4.5.13 ISSN: 2454-1311
describes the simulation setup in DIgSILENT. Section 5 gives the transient stability indicator and section 6 gives the
results and discussion. Conclusion is described in section VII.
Fig.1: Matrix describing the hybrid distributed generation [1]
II. DISTRIBUTED GENERATION AND HYBRID
DISTRIBUTED GENERATION CONCEPT
Small generators connected to the distributed network in other to service the consumer load is called distributed generation. Also, a large wind farm connected to the network to meet
https://dx.doi.org/10.22161/ijaems.4.5.13 ISSN: 2454-1311
involved in the usage of solar PV is still low. Later, as the cost of PV began to decrease, there will be an increasing usage across the globe and several other applications will be developed [7]. However, the low running cost and the maintenance cost of these PVs as well as the long life usage make it an attractive alternative energy source.
Also, wind turbine especially the doubly-fed induction generator has the ability to provide supplementary active and reactive power to the existing grid.
It converts energy inherent in wind to electricity through wind turbine, shaft, induction generator and various controllers to ensure proper grid integration and friendliness. Like PV, wind output power depends on the availability of wind.
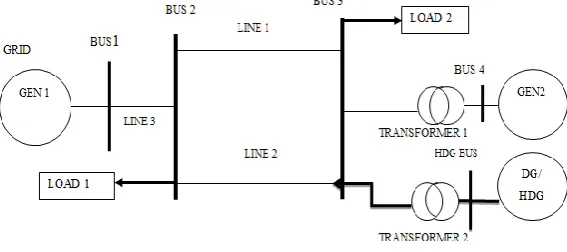
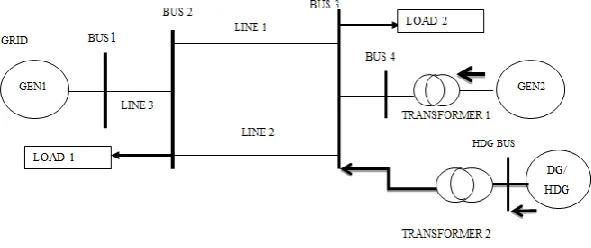
Many of the primary energy sources are complimentary and abundant in nature which gives it a good opportunity to increase availability, power quality and flexibility of power supply when they are fully optimized. The objective of the integration is to capitalize on the strengths of both conventional and renewable energy sources, both cogeneration and non-cogeneration types. The combination of hybrid power generation was represented in matrix form in ref [7]. Fig 2 shows the detail configuration of the proposed hybrid distributed generation. Three scenarios are mentioned in this paper namely the import mode, balanced mode and the export mode but only the export mode is analysed. The export mode is shown in Fig2 and it describes how the load is supplied by the centralized generator and distributed generator. The modes are further explained below:
Import mode: In this mode, the load demands are supplied by
GEN2 and HDG with additional supply from the GRID. This is shown in Fig2.
Balanced mode: In this mode, the load demands are met by
the combination of GEN2 and HDG without any extra supply from the GRID. This means that the power generated by HDG and GEN 2 is sufficient to meet the load demands. This is shown in Fig 2
Export mode: In this mode, HDG and GEN2 supply the loads
and export the excess generation to the GRID. This is shown in Fig 2.
The penetration level for HDG is defined as:
% PLHDG=
𝑃𝐻𝐷𝐺
𝑃𝐻𝐷𝐺+𝑃𝐶𝐺 × 100 (1)
where %PLHDG is the percentage penetration of the DG/HDG,
PHDG is the active power generated by HDG and PCG is the
active power from the centralized generators (GRID and GEN2).
PCG+PHDG = PLOAD
where PLOAD is the power delivered to the load
In all the simulations, the active and the reactive power of GEN2 are kept constant.
%PL HDG is the percentage penetration of the DG or hybrid
DG. While PHDG is the power generated by two or more DG
and PCG is the power generated by the grid. The combination
of hybrid power generation was represented in matrix form in ref [1]. Figure 2 shows the detail configuration of the proposed hybrid distributed generation. In fig2, the load is supplied by the centralized and distributed generator while in export mode the HDG exported its excess generation to the grid. The combination of the DG and GEN2 are used to supply the load with zero contributed to or from the grid (GEN1) (Balanced mode). The export mode can be explained when the excess power is released to the grid.
III. MODIFIED SINGLE MACHINE INFINITE BUS
SYSTEM
Fig 2 shows the modified single machine infinite bus system model used in this paper. This power system model consists of an infinite bus system (Grid) represented by GEN1, one centralized generator (GEN2), a hybrid distributed generation (HDG) and two equal loads (LOAD1 and LOAD2). GEN1 is connected to bus 2 via line 3. The transmission lines (line 1, line2 and line3) are modeled as equivalent 𝝅 transmission lines. Line 1 and line 2 are 100km long each, while line 3 is 40km long. GEN 2 is connected to bus 3 via a 100MVA transformer (transformer 1) and has a capacity of 80MW and 60MVAr. The DG/HDG consisting of wind generator (DFIG), SOLAR PV and small hydropower system (SHP) is connected to bus 3 via another 100MVA transformer (Transformer 2). Each DFIG is rated 8MW, 0.89 power factor lagging. The SOLAR PV is rated 8MW real power at unity power factor. When SOLAR PV alone is connected to the HDG bus, a capacitor bank is used at that bus to compensate for reactive power. The hydropower is rated 8MW and 4MVAr. LOAD1 and LOAD2 are connected to bus 2 and bus 3, respectively, and are rated 80MW and 40MVAr each.
https://dx.doi.org/10.22161/ijaems.4.5.13 ISSN: 2454-1311
Proposed Hybrid Distributed Generation Configuration
Fig.2: Modified Single Machine Infinite Bus System.
The focus is to investigate the impact of Hybrid solar PV, wind turbine (Doubly-Fed Induction Generator- DFIG) and small hydropower systems (SHP) on transient stability. In order to obtain all possible combinations, a truth table is formed as sho wn in Table 1.
Table.1: Truth table describing the combination of different DG
SCENARIOS WIND TURBINE
(DFIG)
SOLAR PV SMALL HYDRO
POWER (SHP)
INFERENCE
1 0 0 0 No DG Integration
2 0 0 1 Small Hydropower only
(Base case 1)
3 0 1 0 SOLAR PV only (Base case
2)
4 0 1 1 SOLAR PV and Small
Hydropower
5 1 0 0 Wind turbine only (Base case
3)
6 1 0 1 DFIG and Small
Hydropower
7 1 1 0 DFIG and SOLAR PV
8 1 1 1 DFIG, SOLAR PV, Small
Hydropower (SHP)
The truth table shows how the three generators can be combined to form HDG. The first column shows various scenarios. There are 8 scenarios. For example, scenario 1 shows the case where there is no integration of DG/HDG. Scenario 2 shows the case where only SHP is integrated and so on. Zero (0) means no generator is connected while one (1) means a generator is connected. The base cases are single source DGs (Scenarios 2, 3 and 5). These base cases were chosen in order to draw out comparisons between HDG and single source DG,
IV. SIMULATION SCENARIOS
The simulation scenarios are discussed in this section. Case study 1 consists of scenarios 2 (Small Hydropower alone), 3 (SOLAR PV alone) and 5 (DFIG alone) which are the base cases.
Case study 2 consists of scenario 4 (Hybrid SOLAR PV and Small Hydropower)
Case study 3 consists of scenario 6 (Hybrid DFIG and Small Hydropower)
https://dx.doi.org/10.22161/ijaems.4.5.13 ISSN: 2454-1311
Case study 5 consists of scenario 8 (Hybrid DFIG, SOLAR PV and Small hydropower)
Three penetration levels of HDG (PLHDG) were considered:
(i) Import mode, PLHDG=40%
(ii) Balanced mode, PLHDG=50%
(iii) Export mode, PLHDG=80%
The penetration level for HDG is defined as:
% PLHDG=
𝑃𝐻𝐷𝐺
𝑃𝐻𝐷𝐺+𝑃𝐶𝐺× 100
where %PLHDG is the percentage penetration of the
DG/HDG, PHDG is the active power generated by HDG and
PCG is the active power from the centralized generators
(GRID and GEN2).
Note that PCG+PHDG = PLOAD
where PLOADis the power delivered to the load
In all the simulations, the active and the reactive power of GEN2 are kept constant. The descriptions of the penetration levels are as follows:
Import mode: In this mode, the load demands are supplied by GEN2 and HDG with additional supply from the GRID. This is shown in Fig 3a.
Balanced mode: In this mode, the load demands are met by the combination of GEN2 and HDG without any extra supply from the GRID. This means that the power generated by HDG and GEN 2 is sufficient to meet the load demands. This is shown in Fig 3b
Export mode: In this mode, HDG and GEN2 supply the loads and export the excess generation to the GRID. This is shown in Fig 3c.
Fig 3a: Modelling configuration for import mode
https://dx.doi.org/10.22161/ijaems.4.5.13 ISSN: 2454-1311
Fig 3c: Modeling configuration for export mode
V. MODELING OF HYBRID DISTRIBUTED
GENERATION:
5.1 Wind Generator
The generator is made of wound rotor synchronous generator and the voltage equations follows the general equations reported in [18] as described in equation 2-4 below. The assumption is that the magnetic flux distribution in the rotor is sinusoidal in order to allow vector modelling.
𝑢𝑑𝑠= −𝑅𝑠𝑖𝑑𝑠− 𝜔𝑚𝜓𝑞𝑠+ 𝑑𝜓𝑑𝑠
𝑑𝑡 2
𝑢𝑞𝑠= −𝑅𝑠𝑖𝑞𝑠+ 𝜔𝑚𝜓𝑑𝑠+ 𝑑𝜓𝑞𝑠
𝑑𝑡 3
𝑢𝑓𝑑= 𝑅𝑓𝑑𝑖𝑓𝑑+ 𝑑𝜓𝑓𝑑
𝑑𝑡 4
The flux equation s:
𝜓𝑑𝑠= −(𝐿𝑑𝑚+ 𝐿𝜎𝑠)𝑖𝑑𝑠+ 𝐿𝑑𝑚𝑖𝑓𝑑 5
𝜓𝑞𝑠= −(𝐿𝑞𝑚+ 𝐿𝜎𝑠)𝑖𝑞𝑠 6
𝜓𝑓𝑑= 𝐿𝑓𝑑𝑖𝑓𝑑 7
Where ψfd indicates the field quantities. In 3rd order
modelling the quantities dψ /dt is neglected in order to
focus on the phenomenon that are of interest. Hence the equations reduced to:
𝑢𝑑𝑠= −𝑅𝑠𝑖𝑑𝑠+ 𝜔𝑚(𝐿𝑠𝑄+ 𝐿𝑞𝑚)𝑖𝑞𝑠 8
𝑢𝑞𝑠 = −𝑅𝑠𝑖𝑞𝑠− 𝜔𝑚(𝐿𝑠𝑄+ 𝐿𝑑𝑚)𝑖𝑑𝑠 9
𝑢𝑓𝑑 = −𝑅𝑓𝑑𝑖𝑓𝑑+ 𝑑𝜓𝑓𝑑
𝑑𝑡 10
The electromagnetic torque is calculated from this equation as well as the active and reactive power.
𝑇𝑒= 𝜓𝑑𝑠𝑖𝑞𝑠− 𝜓𝑞𝑠𝑖𝑑𝑠 11
The active and the reactive power released to the grid are calculated as:
𝑃𝑠= 𝑢𝑑𝑠𝑖𝑑𝑠+ 𝑢𝑞𝑠𝑖𝑞𝑠 12
𝑄𝑠 = 𝑢𝑞𝑠𝑖𝑑𝑠− 𝑢𝑑𝑠𝑖𝑞𝑠 13
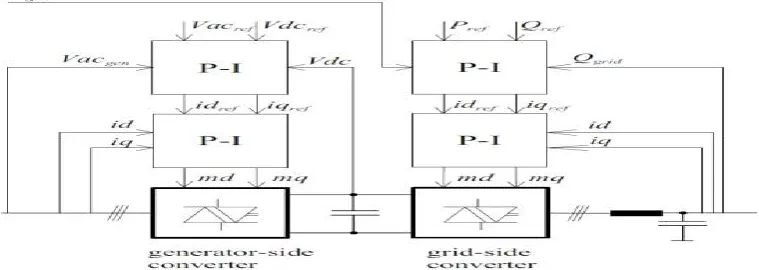
The integration through the power converters follows the same procedure with DFIG. It is integrated through vector control decoupled means. In the same way, the rotor side control the active and reactive power while the grid-side converter controls the voltage and the reactive power..
Fig 4: Frequency-converter with two PWM-converters and intermediate DC Voltage circuit [21]
5.2. Modeling of wind Turbine Rotor equations modeling
https://dx.doi.org/10.22161/ijaems.4.5.13 ISSN: 2454-1311
𝑇𝑡= 1
2 𝜌𝜋𝑅
3𝑣2 𝐶𝑝(𝜆,𝛽)
𝜆 14
And the power is shown as
𝑃𝑤=
𝜌
2 𝐶𝑝(𝝀, 𝛽)𝐴𝑅𝑣𝑤
3 15
The power coefficient Cp of the wind turbine in equation 14
is a function of tip-speed ratio 𝜆 which is given by:
𝜆 = 𝜔𝑅
𝑣 16
Tt=turbine aerodynamic torque (Nm), ρ= specific density of air (kg/m3), v= wind speed (m/s), R=radius of the turbine blade (m), CP= coefficient of power conversion, 𝛽 = pitch angle, P=power extracted from the airflow (W), 𝝀= Tip speed ratio,
𝜔= is the rotational speed of the wind turbine shaft
The value of Q fed into the grid in equation 13 above depends on the control of the power electronic in the grid sides .This does not affect active power except that the efficiency of the inverter can be incorporated into the last two variables. In this paper, for transient stability studies of power systems the generator is represented by third order model as indicated in DigSILENT [18]. In this case the model is obtained by neglecting the stator transients for the fifth order model of induction machine. It shows that there are three electrical equations and one mechanical equation. The model is in d-q expressed in rotor reference frame. In rotor reference frame, the d axis in the rotor reference frame is chosen collinear to the rotor phase winding and the position of the rotor reference frame is the actual position of the rotor.
Obviously, there is a change in generator speed as a result of the difference in electrical and mechanical torque. This is expressed as:
𝑑𝜔
𝑑𝑡 = 1
2𝐻(𝑇𝑚− 𝑇𝑒) 17
Where H is the inertial constant(s) and this is specified in DIgSILENT as acceleration time constant in the induction generator type. Tm and Te is the mechanical and electrical torque respectively.
5.3. Modeling of Small Hydro Turbine
The power available in water current is proportional to the product of head and flow rate.
The general formula for any hydro power is:
𝑃ℎ𝑦𝑑 = 𝜌 𝑔𝑄𝐻 18
Where: P is the mechanical power produced at the turbine shaft (Watts), ρis the density of water (1000 kg/m3), g is the
acceleration due to gravity (9.81 m/s2), Q is the water flow
rate passing through the turbine (m3/s), H is the effective
pressure head of water across the turbine (m). The hydro-turbine converts the water pressure to mechanical shaft power, which further rotates the generator coupled on the
same shaft. The relation between the mechanical and the hydraulic powers can be obtained by using hydraulic turbine efficiency ηh, as expressed by following equations:
𝑃𝑛 = 𝜂ℎ 𝑃ℎ𝑦𝑑 19
𝑄 = 𝐴𝑣
And the whole equation is derive from Bernoulli’s theorem which states
v2 2g+ h +
p ρg=
Phyd
ρgQ 20
Where v is the water flow speed (m/s), A is the area of the cross section (m2) p is the pressure of water (N/m2).
3.3. Solar cell modeling
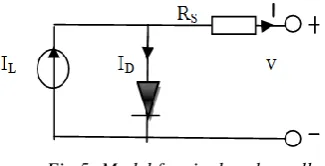
PV effect is a basic physical process through which solar energy is converted directly into electrical energy. It consists of many cells connected in series and parallel. The voltage and current output is a nonlinear relationship. It is essential therefore to track the power since the maximum power output of the PV array varies with solar radiation or load current. This is shown by Matlab simulation. The equivalent diagram of a solar cell is represented by one diode model as shown in fig 5
Fig 5: Model for single solar cell
The output terminal of the circuits is connected to the load. The output current source is the different between the photocurrent Iph and the normal diode current ID.
Ideally the relationship between the output voltage V and the load current I of a PV cell or a module can be expressed as [20,21]
Ipv = Iph− ID = Iph− I0[exp ( Vpv+iRs
mKTc ) − 1] 21
Where Iph is the photocurrent of the PV cell (in amperes),
I0 is the saturation current, Ipv is the load current (in
amperes), Vpv is the PV output voltage(in volts), Rs is the series resistance of the PV cell (in ohms) and m, K and Tc represent respectively the diode quality constant, Boltzmann’s constant and temperature.
The power output of a solar cell is given by
https://dx.doi.org/10.22161/ijaems.4.5.13 ISSN: 2454-1311
Where Ipv is the output current of solar cell (A). Vpv is the
solar cell operating voltage (V), Ppv is the output power of
solar cell (W).
VI. TRANSIENT STABILITY INDICATOR
Impact of Hybrid Distributed Generation Using CCT
To measure the impact of HDG on transient stability, the critical clearing time (CCT) is used as the stability index. This index measures the stability margin and indicates the robustness of the system to disturbances. The longer the CCT, the longer the system can tolerate the fault, and the more robust is the system. The impact of penetration level based on import mode, balanced mode and export mode on transient stability with HDG is investigated by monitoring the CCT. To assess the level of instability, the rotor angle is monitored when a temporary three-phase fault is applied in the middle of line 2 while the CCT is monitored by applying three-phase fault on line 2 at different locations from bus 3. The locations of the fault are 0%, 20%, 40%, 60%, 80% and 100% of the total length of the transmission line (bus 3-bus2). In other word, the fault distance is the distance from bus 3 to the fault location. For example, when the fault occurs at bus 3, the fault location will be 0% and when the fault occurs at bus 2, the fault location will be 100% and so on. The CCT is calculated by increasing the fault clearing time (FCT) until the rotor angle of GEN 2 reaches its critical clearing angle where further increase will make the system unstable.
VII. RESULTS AND DISCUSSIONS
For clarity, the impact of single source DG and HDG is shown at different case studies. The following simulations are recorded for export mode only as indicated in section IV:
Case study 2 is compared with each of the DG in case study 1
Case study 3 is compared with each of the DG in case study1
Case study4 is compared with each of the DG in case study 1
Case study 5 is compared with each of the DG in case study1
CASE STUDY 2
The graphs in Fig 6-8 show the graphs for case study 3 with case study 1
Fig 6: Comparison Of the impact of Hybrid SOLAR PV-SHP and SHP alone on the rotor angle of GEN2 (Export mode)
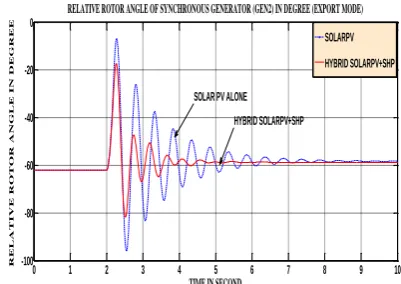
Fig 7: Comparison Of the impact of Hybrid Solar PV-SHP and solar PV alone on the rotor angle of GEN2 (Export mode)
Fig 8: Comparison Of the impact of HYBRID SHP +SOLAR PV and DFIG alone on the rotor angle of GEN2 (Export
mode).
Figs 6-8 show the simulations when Hybrid Solar PV +SHP is compared with SHP, Solar PV and wind turbine. It can be seen that when DFIG alone was connected the system has more oscillations compared with the cases with SOLAR PV alone and SHP. This suggests that when DFIG alone is integrated into the system, the system is prone to more
0 1 2 3 4 5 6 7 8 9 10
-100 -80 -60 -40 -20 0
TIME IN SECOND
R ELA TI V E R OTOR A N GLE I N D EGR
EE RELATIVE ROTOR ANGLE OF SYNCHRONOUS GENERATOR (GEN 2) IN DEGREE
HYBRID SOLAR PV+SHP SHP ALONE
HYBRID SOLAR PV+SHP
SHP ALONE
0 1 2 3 4 5 6 7 8 9 10
-100 -80 -60 -40 -20 0
TIME IN SECOND
R EL A TI V E R OT OR A N GL E I N D EG R EE
RELATIVE ROTOR ANGLE OF SYNCHRONOUS GENERATOR (GEN2) IN DEGREE (EXPORT MODE)
SOLARPV
HYBRID SOLARPV+SHP
HYBRID SOLARPV+SHP SOLAR PV ALONE
0 1 2 3 4 5 6 7 8 9 10
-160 -140 -120 -100 -80 -60 -40 -20 0 20
TIME IN SECOND
R ELA TI V E R OTOR A N GLE I N D EGR EE
RELATIVE ROTOR ANGLE OF SYNCHRONOUS GENERATOR (GEN2) IN DEGREE (EXPORT MODE)
HYBRID SHP+SOLAR PV DFIG ALONE
https://dx.doi.org/10.22161/ijaems.4.5.13 ISSN: 2454-1311
instability compared to SOLAR PV alone and HYBRID SOLAR PV +SHP. This is due to the crowbar which is triggered to block the rotor side converter and as a result, the voltage cannot recover completely immediately after the fault is cleared because the rotor side converter cannot provide the necessary reactive power to the generator for magnetization purpose. The generator then absorbs reactive power from the grid. When HYBRID SOLAR PV+SHP is connected, the system is more transiently stable than when DFIG alone is connected. This can be seen at the settling time. The settling time when HYBRID SOLAR PV+SHP is integrated into the grid is 4.5 seconds compared with 10 seconds for DFIG alone. The combination of SHP and SOLAR PV has improved the first swing and the subsequent swings. This is because of the good transient stability characteristics of SOLAR PV and SHP as seen in Fig 6 and Fig 7. When SHP alone is used, the system seems to have a better transient stability in terms of first swing compared with when HYBRID SOLAR PV +SHP is used. However, for the subsequent oscillations, when SHP alone or when HYBRID SOLAR PV+SHP is used, they have similar settling time. The system is transiently stable when HYBRID SOLAR PV+SHP is integrated compared to when Solar PV alone is integrated. This can be seen in the first swing and the oscillation duration. The oscillation duration when Solar PV alone is used is 9 seconds while that of HYBRID SOLAR PV+SHP is 5 seconds.
CASE STUDY 3
The graphs in Fig 9-11 show the graphs for case study 3 with case study 1
Fig 9: Comparison Of the impact of HYBRID DFIG+ SHP and SHP alone on the rotor angle of GEN2 (Export)
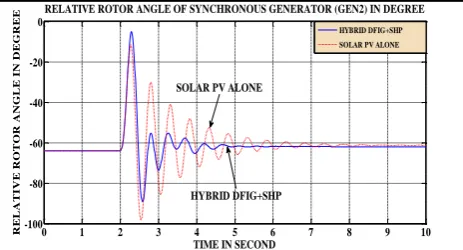
Fig 10: Comparison Of the impact of HYBRID DFIG+ SHP and SOLAR PV alone on the rotor angle of GEN2 (Export)
Fig 11: Comparison of the impact of HYBRID DFIG+ SHP and DFIG alone on the rotor angle of GEN2 (Export)
The graph in Fig 11 indicates worsen instability when DFIG alone is used compared to when Hybrid DFIG+SHP is used. However, the degree of instabilities is not as high in the simulations in Fig9-10 as that of Fig 11. The system is transiently stable when HYBRID DFIG+SHP is integrated compared to when DFIG alone is integrated at the same time when SOLAR PV alone is integrated. The stability of Hybrid DFIG+ SHP is worsened especially at the first swing but settle almost at the same time with oscillation when SHP is integrated.
CASE STUDY 4
The graphs in Fig 12-14 show the graphs for case study 4 with case study 1
0 1 2 3 4 5 6 7 8 9 10
-100 -80 -60 -40 -20 0
RELATIVE ROTOR ANGLE OF SYNCHRONOUS GENERATOR (GEN2) IN DEGREE
TIME IN SECOND
R
ELA
TI
V
E
R
OTOR
A
N
GLE
I
N
D
EGR
EE
HYBRID DFIG+SHP
SHP ALONE HYBRID DFIG+SHP
SHP ALONE
0 1 2 3 4 5 6 7 8 9 10 -100
-80 -60 -40 -20 0
RELATIVE ROTOR ANGLE OF SYNCHRONOUS GENERATOR (GEN2) IN DEGREE
TIME IN SECOND
R
ELA
TI
V
E
R
OTOR
A
N
GLE
I
N
D
EGR
EE
HYBRID DFIG+SHP SOLAR PV ALONE
HYBRID DFIG+SHP SOLAR PV ALONE
0 1 2 3 4 5 6 7 8 9 10
-150 -100 -50 0 50
TIME IN SECOND
R
EL
A
TI
V
E
R
OT
OR
A
N
GL
E
I
N
D
EG
R
EE
RELATIVE ROTOR ANGLE OF SYNCHRONOUS GENERATOR(GEN2) IN DEGREE (EXPORT MODE)
HYBRID DFIG+SHP
DFIG ALONE
https://dx.doi.org/10.22161/ijaems.4.5.13 ISSN: 2454-1311
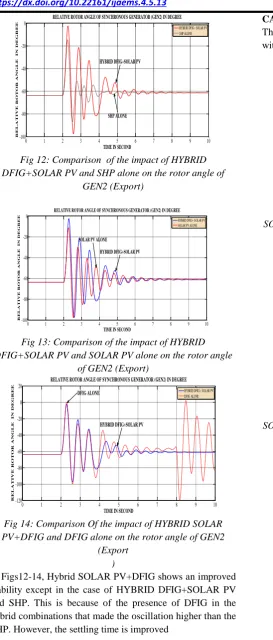
Fig 12: Comparison of the impact of HYBRID DFIG+SOLAR PV and SHP alone on the rotor angle of
GEN2 (Export)
Fig 13: Comparison of the impact of HYBRID DFIG+SOLAR PV and SOLAR PV alone on the rotor angle
of GEN2 (Export)
Fig 14: Comparison Of the impact of HYBRID SOLAR PV+DFIG and DFIG alone on the rotor angle of GEN2
(Export )
In Figs12-14, Hybrid SOLAR PV+DFIG shows an improved stability except in the case of HYBRID DFIG+SOLAR PV and SHP. This is because of the presence of DFIG in the hybrid combinations that made the oscillation higher than the SHP. However, the settling time is improved
CASE STUDY 5
The graphs in Fig 15-17 show the graphs for case study 5 with case study 1
Fig15: Comparison of the impact of HYBRID DFIG+ SOLAR PV+SHP and SOLAR PV alone on the rotor angle of
GEN2 (Export)
Fig 16: Comparison of the impact of HYBRID DFIG+ SOLAR PV+SHP and SHP alone on the rotor angle of GEN2
(Export)
Fig 17: Comparison of the impact of HYBRID DFIG+ SOLAR PV+SHP and DFIG alone on the rotor angle of
GEN2 (Export)
0 1 2 3 4 5 6 7 8 9 10
-100 -80 -60 -40 -20 0
RELATIVE ROTOR ANGLE OF SYNCHRONOUS GENERATOR (GEN2) IN DEGREE
TIME IN SECOND
R EL A TI V E R OT OR A N GL E I N D EG R
EE HYBRID DFIG+ SOLAR PV
SHP ALONE
HYBRID DFIG+SOLAR PV
SHP ALONE
0 1 2 3 4 5 6 7 8 9 10
-100 -80 -60 -40 -20 0
RELATIVE ROTOR ANGLE OF SYNCHRONOUS GENERATOR (GEN2) IN DEGREE
TIME IN SECOND
R EL A TI V E R OT OR A N GL E I N D EG R
EE HYBRID DFIG+ SOLAR PV SOLAR PV ALONE
SOLAR PV ALONE HYBRID DFIG+SOLAR PV
0 1 2 3 4 5 6 7 8 9 10
-120 -100 -80 -60 -40 -20 0 20
RELATIVE ROTOR ANGLE OF SYNCHRONOUS GENERATOR (GEN2) IN DEGREE
TIME IN SECOND
R EL A TI V E R OT OR A N GL E I N D EG R
EE HYBRID DFIG+ SOLAR PV
DFIG ALONE
HYBRID DFIG+SOLAR PV DFIG ALONE
0 1 2 3 4 5 6 7 8 9 10 -120 -100 -80 -60 -40 -20 0 20
TIME IN SECOND
R EL A TI V E R OT OR A N GL E OF I N D EG R EE
RELATIVE ROTOR ANGLE OF SYNCHRONOUS GENERATOR (GEN2) IN DEGREE (EXPORT MODE) SOLAR PV ALONE HYBRID DFIG+SOLAR PV+SHP
SOLAR PV ALONE HYBRID DFIG+ SOLAR PV+SHP
0 1 2 3 4 5 6 7 8 9 10
-120 -100 -80 -60 -40 -20 0 20
TIME IN SECOND
R EL A TI V E R OT OR A N GL E I N D EG R EE
RELATIVE ROTOR ANGLE OF SYNCHRONOUS GENERATOR (GEN2) IN DEGREE (EXPORT MODE)
SHP ALONE HYBRID DFIG+ SOLAR PV+SHP HYBRID DFIG+ SOLAR PV+SHP
SHP ALONE
0 1 2 3 4 5 6 7 8 9 10
-140 -120 -100 -80 -60 -40 -20 0 20
TIME IN SECOND
R EL A TI V E R OT OR A N GL E I N D EG R EE
RELATIVE ROTOR ANGLE OF SYNCHRONOUS GENERATOR (GEN2) IN DEGREE (EXPORT MODE)
DFIG ALONE HYBRID DFIG+ SOLAR PV+SHP
https://dx.doi.org/10.22161/ijaems.4.5.13 ISSN: 2454-1311
The graph in Figs 15-17 shows that when Hybrid DFIG+SOLARPV+SHP is integrated, the stability is worsen compared to SOLAR PV alone, SHP alone and DFIG alone.
VIII. CONCLUSION
The graphs in Figs 6-17 show the rotor angle swings of GEN 2 when SOLAR PV alone, DFIG alone and its HYBRID form are integrated into the system. The export modes are shown in the figures above. When three DGs are integrated, the system stability margin is lower which means the system experience more instability than the one with two DGs. The results show that the stability depends on the type of DG used. When DFIG is used, it shows more instability than other type of DG. Besides, Hybrid DG is transiently stable compared to single DG except when SHP is used. When SHP is used, the single DG is more stable. It means that SHP helps in the stability of the system because, synchronous generator in SHP supply reactive power and thus bring improvement to the stability of the system when under a severe fault.
REFERENCES
[1] J Paska, P.Biczel, M.Klos, “Hybrid power systems-An effective way of utilizing primary energy sources”, Electric Power Systems Research, Elsevier, 2009, pp.1-8. [2] T.Ackerman,G. Andersson, and L.Soder. ‘Distributed
generation, a definition’ Electric Power Energy Research 2001:57,195-204,.
[3] J.Momoh, G.D.Boswell, “Improving power Grid Efficiency using Distributed Generation” Proceedings of the 7th international conference on power system operation
and planning, pp.11-17, Jan., 2007
[4] http://en.wikipedia.org/wiki/Wind_power#Penetration
[5] http://en.wikipedia.org/wiki/Solar_power_in_Germany#St
atistics
[6]
http://www.energy.ca.gov/2007publications/CEC-500-2007 021/CEC-500-2007-021.PDF.
[7] M. Edkins A. Marquard H. Winkler ‘South Africa’s Renewable energy policy roadmap
[8] A.M.Azmy,Simulation and Management of Distributed Generation units using intelligent techniques, Ph.D. Thesis submitted to the department electrical engineering University of Duisburg-Essen 2005.
[9] C.Wang,‘Modeling and control of hybrid wind/photovoltaic/fuel distributed generation system. [10]V.V Thong, J. Driesen, R. Belmans, “Transmission system
operation concerns with high penetration level of distributed
generation”, Universities power and Engineering Conference UPEC, 4-6Sept., 2007, pp.867-871.
[11]T. Tran-Quoc, L.Le Thanh, Ch.Andrieu, N. Hadjsaid, C. Kieny, J.C Sabonnadiere, K. Le, O. Devaux, O.Chilard Stability analysis for the distribution networks with distributed generation” in Proc.2005/2006 IEEE/PES Transmission & Distribution Conference & Exposition, vol. 1–3, Dallas, TX, USA,May 21– 26,2006 Proceedings Paper, pp. 289–294.
[12]V.V. Knazkins “Stability of Power Systems with Large Amounts of Distributed Generation “PhD Thesis submitted to University Stockholm, Sweden, 2004.
[13]A Ishchenko ‘Dynamics and stability of distributed networks with dispersed Generation, Ph.D thesis submitted to Eindho-ven University of technology,16 Jan.,2008. [14]M. Reza, Stability analysis of transmissions Systems with
high penetration of distributed generation”, PhD Thesis submitted to Delf University of Technology Delft, The
Netherlands, 2006.
[15]Y.Tiam, “Impact on the power system with a large generation of photovoltaic generation”, PhD Thesis submitted to the University of Manchester Institute of Science and Technology,Feb., 2004, pp.53-55.
[16]Vechiu I, Camblong H, Papia G, Dakyo B, Nichita C. Dynamic simulation model of a hybrid power system: performance analysis. International Journal of Automotive Technology 2006;7(7):1-9.
[17]Skretas Sotirios B, Papadopoulos Demetrios P. Efficient design and simulation of an expandable hybrid (wind-photovoltaic) power system with MPPT and inverter input voltage regulation features in compliance with electric grid requirements. Electric Power Systems Research 2009;79:1271-85
[18]Mehdi Dali, Jamel Belhadj, Xavier Roboam. Design of a stand-alone hybrid photovoltaic-wind generating
system with battery
storage,http://journal.esrgroups.org/jes/papers/4_3_7.pdf. [19]Joanne Hui, Alireza Bakhshai, Praveen K. Jain. A hybrid
wind-solar energy system: a new rectifier stage topology. In: Applied Power Electronics Conference and Exposition (APEC), 2010 Twenty-Fifth Annual IEEE, 21e25 Feb.,2010, pp. 155-61.
[20]Arutchelvi Meenakshisundaram, Daniel Samuel Arul. GRID connected hybrid dispersed power generators based on pv array and wind-driven induction generator. Journal of Electrical Engineering 2009;60(6):313-20.