Original Research Article
Factors influencing blood donation among the workers of a tertiary
care hospital, Chitradurga: a comparative study
Sameeya Furmeen S.
1, Mayuri Reddy Reddy
2*
INTRODUCTION
Even though medical science has advanced greatly with new discoveries and inventions, there is still no substitute found for human blood and blood donation is the only option available.1 Every three seconds someone is in need of blood. A single blood donation can save upto three lives. Any healthy person aged 18-65 years, weighing atleast 50 kgs can donate blood every 3 months.2
Donating blood not only helps the recipient, but also improves the health of the donor. It balances the iron levels in the body, regulates blood flow by correcting the hypercoagulability, burns the extra calories and reduces the cholesterol level.2,3 Since the donor gets a mini-physical done simultaneously, infections and diseases are diagnosed early. It is also found that regular blood donors are 88% less likely to suffer from a heart attack, have a longer life and have lower risk of developing heart
ABSTRACT
Background: Blood donation is very vital to save human life as there is no substitute for human blood. Even though the hospital workers are well aware about blood donation, many of them are not into voluntary blood donation. Hence the present study focuses on the hospital workers.
Methods: A cross-sectional study with purposive sampling was done in the workers of Basaveshwara Medical College. After obtaining verbal consent, the data was collected by a pre-designed, pre-structured, self-administered questionnaire. The data was analyzed using SPSS version 21.
Results: A total of 258 workers participated, the mean age was 30.83±7.44; 97 (37.6%) were donors and 161 (62.4%) were non-donors. The donors were mostly in the age group 31-40 yrs (48.1%), males (63.3%), those who were single (40.2%), graduates (45.4%), belonging to socio-economic class I (56.7%). Most were voluntary donors (70.1%), 48.5% had donated 2-5 times, 24.7% were regular donors with 37.5% donating yearly. The predominant reason for not donating blood among the non-donors was „no request for blood‟ (63.4%). Around 175 (67.8%) were willing to be voluntary donors in the future, whereas 57 (22.1%) were willing to donate only for family and friends and 26(10.1%) were not willing to donate blood. Willingness to donate was found to be significantly associated with age, education, occupation, socio-economic class, source of information and the type of donation.
Conclusions: Males and those in higher socio-economic class predominantly donated blood. Donors considered blood donation as a humanitarian cause and felt it gives moral satisfaction than the non-donors. Non-donors thought blood donation leads to weakness/anemia and is harmful to health than the donors.
Keywords: Blood donation, Donors, Non-donors, Voluntary donation
Department of Community Medicine, 1Stanley Govt. Medical College & Hospital, Chennai, Tamil Nadu, 2Bhaskar Medical College, Hyderabad, Andhra Pradesh, India
Received: 24 November 2017
Revised: 18 January 2018
Accepted: 19 January 2018
*Correspondence:
Dr. Mayuri Reddy Reddy, E-mail: [email protected]
Copyright: © the author(s), publisher and licensee Medip Academy. This is an open-access article distributed under the terms of the Creative Commons Attribution Non-Commercial License, which permits unrestricted non-commercial use, distribution, and reproduction in any medium, provided the original work is properly cited.
disease, hypertension, diabetes, hypercholesterolemia and embolic episodes when compared with the non-donors.4-6 The World Health Organization estimates that blood donation by 1% of the population is generally the minimum needed to meet a nation‟s most basic requirements for blood.7 In India, during the year 2006-2007, Voluntary Blood Donation (VBD) was only 54.4% and it increased to 79.4% during the year 2010-2011.8 The ever increasing demand of blood these days due to implementation of newer and aggressive surgical and therapeutic methods increases the need to ensure its sufficient supply immensely, as no hospital can function effectively without an efficient blood supply.9,10
The blood banks stress and urge the relatives of the patient to send replacement donors as blood donor recruitment and retention is important to maintain their stock.11Therefore it is crucial to understand the processes whereby first-time donors become repeat donors.
Even though the hospital workers are aware about it, many of them are not into voluntary blood donation. Hence the present study focuses on the hospital workers to compare the socio-demographic differences between the donors and non-donors, and also to explore the factors that motivate or discourage them from donating blood.
Objectives
1. To compare the socio-demographic factors between the donors and non-donors.
2. To find out the factors influencing blood donation among the workers.
3. To know the reasons for not donating blood among the non-donors.
4. To assess the factors affecting the willingness to donate blood in the future.
METHODS
A cross-sectional study with purposive sampling was done in the workers of Basaveshwara Medical College & Hospital, Chitradurga from June 2015 to September 2015. All the workers working in the institute were approached. Those who were not willing to participate in the study were excluded. A total of 258 workers responded and participated in this study. After obtaining the written consent, the data was collected by a pre-designed, pre-structured, self-administered questionnaire. The questionnaire consists of background information, details about blood donation and willingness to donate blood in the future. A three point likert scale was used for the questions on the myths and the reasons for not donating blood; with 1 being agree, 2 being neither agree nor disagree and 3 being disagree. Those workers who had atleast once donated blood were considered as “donors” and those who never donated blood were “non-donors”. The data thus obtained was compiled and
analyzed using SPSS version 20. Chi-square test was applied wherever necessary, p value of <0.05 was considered as statistically significant.
RESULTS
A total of 258 workers participated in the study. They aged from 19 – 54 yrs, the mean age being 30.83±7.44. Gender distribution was almost equal, 128 (49.6%) were males and 130 (50.4%) were females. The donors were mostly in the age group 31 – 40 yrs (48.1%), males (63.3%), single (40.2%), graduates (45.4%), belonging to socio-economic class I (56.7%). However statistically significant association for blood donation was found only for gender and socio-economic status (Table 1).
In this study, 97 (37.6%) were donors and 161 (62.4%) were non-donors. Table 2 shows the blood donation details of the donors.
More donors considered blood donation as a humanitarian cause (99%) and felt it gives moral satisfaction (97.9%) than the non-donors (p=0.001). Non-donors thought blood donation leads to weakness/anemia (39.1%) and is harmful to health (29.8%) than the donors (p=0.000). However it was donors who believed that blood donation can transmit HIV infection more than the non-donors (p=0.000). Donors also thought blood donation leads to accelerated aging, infertility and loss of vitality more than the non-donors, but it was not statistically significant (p>0.05) (Table 3).
The predominant reason for not donating blood among the non-donors was „No request for blood‟ (63.4%), followed by Never had opportunity to donate (60.9%), Medically unfit to donate (57.1%), Never thought about it (52.8%), No time for donating (32.9%), Fear of weakness from blood donation (31.7%), Fear of pain of needle (24.8%), Fear of contracting disease (23%), Discomfort at the sight of blood (14.9%), Donation process is long and boring (14.3%), My blood will be misused by blood bank (8.7%), My blood will be wasted (6.2%) (Figure 1).
Figure 1: Reasons for not donating blood among the non-donors.
0 10 20 30 40 50 60 70 No request for blood
Never had opportunity to donate Medically unfit to donate Never thought about it No time for donating Fear of weakness from blood…
Fear of pain of needle Fear of contracting disease Discomfort at the sight of blood Donation process is long &… My blood will be misused by… My blood will be wasted
Table 1: Socio-demographic factors affecting blood donation.
Particulars Frequency
N (%)
Donors N (%)
Non-donors N (%)
χ2
value df P value
Age groups
≤ 30 Yrs 150 (58.1) 49 (32.7) 101 (67.3)
5.607 2 0.061 31 - 40 Yrs 81 (31.4) 39 (48.1) 42 (51.9)
> 40 Yrs 27 (10.5) 9 (33.3) 18 (66.7)
Gender Male 128 (49.6) 81 (63.3) 47 (36.7) 71.427 1 0.000
Female 130 (50.4) 16 (12.3) 114 (87.7)
Religion Hindu 250 (96.9) 93 (37.2) 157 (62.8) 0.762 1 0.374
Muslim 8 (3.1) 4 (50) 4 (50)
Residence Urban 160 (62) 63 (39.4) 97 (60.6) 0.568 1 0.451
Rural 98 (38) 34 (34.7) 64 (65.3)
Marital Status
Single 87 (33.7) 35 (40.2) 52 (59.8)
1.522 2 0.467 Married 169 (65.5) 62 (36.7) 107 (63.3)
Widow 2 (0.8) 0 2 (100.0)
Type of family
Nuclear 163 (63.2) 65 (39.9) 98 (60.1)
5.171 2 0.075 Joint 47 (18.2) 11 (23.4) 36 (76.6)
Three Generation 48 (18.6) 21 (43.8) 27 (56.3)
Education
Illiterate 10 (3.9) 1 (10.0) 9 (90.0)
8.895 4 0.064 Primary School 15 (5.8) 5 (33.3) 10 (66.7)
High School 41 (15.9) 16 (39.0) 25 (61.0) PUC 73 (28.3) 21 (28.8) 52 (71.2) Graduate 119 (46.1) 54 (45.4) 65 (54.6)
Occupation
Nurse 92 (35.7) 31 (33.7) 61 (66.3)
2.880 3 0.411 Technician /
Pharmacist 45 (17.4) 19 (42.2) 26 (57.8) Clerk 34 (13.2) 10 (29.4) 24 (70.6) Group D 87 (33.7) 37 (42.5) 50 (57.5)
Socio-economic class
Class I 30 (11.6) 17 (56.7) 13 (43.3)
12.232 4 0.016 Class II 67 (26) 31 (46.3) 36 (53.7)
Class III 73 (28.3) 21 (28.8) 52 (71.2) Class IV 75 (29.1) 26 (34.7) 49 (65.3) Class V 13 (5) 2 (15.4) 11 (84.6)
Total 258 (100) 97 (37.6) 161 (62.4)
Table 2: Blood donation among the donors.
Particulars Frequency Percentage (%)
Type of donation Voluntary 68 70.1
Replacement 29 29.9
First time donated for
Friends 15 15.5
Family 6 6.2
Relatives 14 14.4
Unknown 62 63.9
Frequency
Once 29 29.9
2 - 5 47 48.5
6 - 10 12 12.4
> 10 9 9.3
Regular donation Yes 24 24.7
No 73 75.3
Frequency of regular donation
3 Months 8 33.3
6 Months 7 29.2
Table 3: Factors affecting blood donation.
S.No. Blood donation Donors (%) Non-donors (%) χ2 value df P value
1. Saves lives 95 (97.9) 159 (98.8) 1.687 2 0.430
2. Is a humanitarian cause 96 (99) 143 (88.8) 9.199 2 0.010
3. Gives moral satisfaction 95 (97.9) 134 (83.2) 14.122 2 0.001
4. Can transmit HIV infection 64 (66) 73 (45.3) 16.644 2 0.000
5. Leads to weakness/anaemia 25 (25.8) 63 (39.1) 4.983 2 0.083
6. Donation is harmful to health 11 (11.3) 48 (29.8) 15.548 2 0.000
7. Leads to accelerated aging 15 (15.5) 13 (8.1) 4.712 2 0.095
8. Leads to infertility and loss of vitality 7 (7.2) 11 (6.8) 0.803 2 0.669
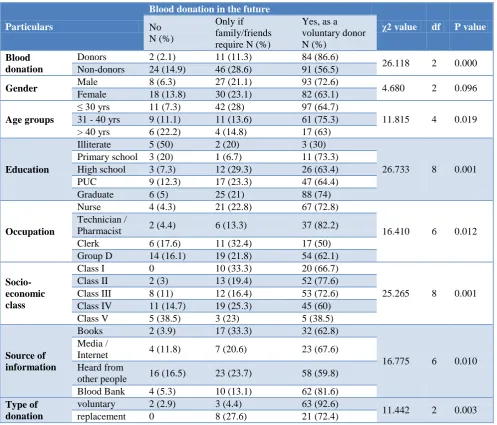
Table 4: Factors affecting the willingness to donate blood in the future.
Particulars
Blood donation in the future
χ2 value df P value No
N (%)
Only if family/friends require N (%)
Yes, as a voluntary donor N (%)
Blood donation
Donors 2 (2.1) 11 (11.3) 84 (86.6)
26.118 2 0.000 Non-donors 24 (14.9) 46 (28.6) 91 (56.5)
Gender Male 8 (6.3) 27 (21.1) 93 (72.6) 4.680 2 0.096
Female 18 (13.8) 30 (23.1) 82 (63.1)
Age groups
≤ 30 yrs 11 (7.3) 42 (28) 97 (64.7)
11.815 4 0.019 31 - 40 yrs 9 (11.1) 11 (13.6) 61 (75.3)
> 40 yrs 6 (22.2) 4 (14.8) 17 (63)
Education
Illiterate 5 (50) 2 (20) 3 (30)
26.733 8 0.001 Primary school 3 (20) 1 (6.7) 11 (73.3)
High school 3 (7.3) 12 (29.3) 26 (63.4) PUC 9 (12.3) 17 (23.3) 47 (64.4) Graduate 6 (5) 25 (21) 88 (74)
Occupation
Nurse 4 (4.3) 21 (22.8) 67 (72.8)
16.410 6 0.012 Technician /
Pharmacist 2 (4.4) 6 (13.3) 37 (82.2) Clerk 6 (17.6) 11 (32.4) 17 (50) Group D 14 (16.1) 19 (21.8) 54 (62.1)
Socio-economic class
Class I 0 10 (33.3) 20 (66.7)
25.265 8 0.001 Class II 2 (3) 13 (19.4) 52 (77.6)
Class III 8 (11) 12 (16.4) 53 (72.6) Class IV 11 (14.7) 19 (25.3) 45 (60) Class V 5 (38.5) 3 (23) 5 (38.5)
Source of information
Books 2 (3.9) 17 (33.3) 32 (62.8)
16.775 6 0.010 Media /
Internet 4 (11.8) 7 (20.6) 23 (67.6) Heard from
other people 16 (16.5) 23 (23.7) 58 (59.8) Blood Bank 4 (5.3) 10 (13.1) 62 (81.6)
Type of donation
voluntary 2 (2.9) 3 (4.4) 63 (92.6)
11.442 2 0.003 replacement 0 8 (27.6) 21 (72.4)
In this study, 175 (67.8%) were willing to be voluntary donors in the future, whereas 57 (22.1%) were willing to donate only for family and friends and 26 (10.1%) were not willing to donate blood. Most of the donors (86.6%) were willing to be voluntary donors than the non-donors (56.5%), which is statistically significant (p=0.000) (Table 4).
DISCUSSION
voluntarily and repeatedly, and what prevents the non-donors to do the same.
In this study, 37.6% were donors, similar when compared to a study conducted on physicians, whereas more when compared to the studies done on the students.12-15 The donors were predominantly in the age group 31–40 years, with both the lesser and the higher age groups donating less. However, among the socio-demographic factors significant association for blood donation was found only for gender and socio-economic status; with males donating more than the females (p=0.000) and those from the higher socio-economic class donating more than the lower classes. (p=0.016). Such male predominance among the donors was observed in other studies as well.15-18
The reasons for donation and non-donation of blood were similar to those of previous studies. Those who donated blood more often, did it because they found moral satisfaction.12,15 The main reason for not donating was because they were not approached for it or no opportunity to donate.12,13,15,18
It was also seen that voluntary donors donated more repeatedly than the replacement donors18 and they were more willing to donate in the future as well (p=0.003). Though 89.9% were willing to donate in the future, only 67.8% of them were ready for voluntary donation, the rest 22.1% opted to donate only for friends and family. The remaining 10.1% didn‟t wish to donate blood. Since willingness to donate was found significantly associated with age group, education, occupation, socio-economic class, source of information, previous donation and the type of donation, these factors can be further explored to increase the number of donors.
CONCLUSION
Males and those in higher socio-economic class predominantly donated blood. Donors considered blood donation as a humanitarian cause and felt it gives moral satisfaction more than the non-donors. Non-donors thought blood donation leads to weakness/anaemia and is harmful to health than the donors. Most of the donors were willing to be voluntary donors in the future than the non-donors. The non-donors had not donated blood mainly because they were not approached. Therefore it is can be concluded that more donors can be recruited for voluntary donation by proper motivation and adequate awareness through campaigns. The idea of voluntary blood donation needs to be intensively promoted to get regular, non-remunerated, donors.
Limitations
Since it is done in a specific group (hospital workers), the results can not be generalised to the whole population.
Recommendations
Similar studies can be conducted on people of other occupations as well as the general public and the results can be further evaluated, so that appropriate measures can be taken for the recruitment of the donors.
Funding: No funding sources Conflict of interest: None declared
Ethical approval: The study was approved by the Institutional Ethics Committee
REFERENCES
1. Olaiya MA, Ajala A, Olatunji RO. Knowledge, attitudes, beliefs and motivations towards blood donations among blood donors in Lagos, Nigeria. Transfusion Med. 2004;14:13-7.
2. Blood donation articles. Available at: http://ww3.comsats.edu.pk/mbds/Blood_Donation.a spx. Accessed on 2 September, 2015.
3. Mercola. Four Unexpected Benefits of Donating Blood, July 28, 2014. Available at: http://articles.mercola.com/sites/articles/archive/201 4/07/28/blooddonationbenefits.aspx. Accessed on 2 September, 2015.
4. Salonen JT1, Tuomainen TP, Salonen R, Lakka TA, Nyyssönen K. Donation of blood is associated with reduced risk of myocardial infarction. The Kuopio Ischaemic Heart Disease Risk Factor Study. Am J Epidemiol. 1998;148(5):445-51.
5. Konrath S1, Fuhrel-Forbis A, Lou A, Brown S. Motives for volunteering are associated with mortality risk in older adults. Health Psychol. 2012;31(1):87-96.
6. Myths and truths about blood donation and transfusion. HCDCP E-bulletin. Available at http://www2.keelpno.gr/blog/?p=4813&lang=en, Accessed on 12 September 2015.
7. Fordham J, Dhingra N. Towards 100% voluntary blood donation: a global framework for action. WHO, Geneva; 2010.
8. NACO annual report. Available from www.nacoonline.org/.../NACO%20Annual%20Rep ort%202010-11. Accessed on 02 September 2015. 9. Riley W, Schwei M, McCullough J. The United
States potential blood donor pool: estimating the prevalence of donorexclusion factors on the pool of potential donors. Transfusion. 2007;47:1180–8. 10. Britten, Fereydoun AF, ElNageh A, Mohamed M.
Blood Transfusion A Basic Text. Regional Office for the Eastern Mediterranean Alexandria, Egypt: World Health Organization; 1994;63:6–9.
11. An Action Plan for Blood Safety. National AIDS Control Organization: Ministry of Health and Family Welfare, Government of India; 2003:7. 12. Benedict N, Usimenahon A, Alexander NI, Isi A.
facility of a developing country. Int J Blood Transfusion Immunohematol. 2012;2:410.
13. Devi S, Laishram J, Shantibala K, Elangbam V. Knowledge, Attitude and Practice of Blood Safety and Donation. Indian Medical Gazette. 2012: 1-5. 14. Manikandan S, Srikumar R, Ruvanthik PN. A Study
on Knowledge, Attitude and Practice on Blood Donation among Health Professional Students in Chennai, Tamil Nadu, South India. Int J Scientific Res Publ. 2013;3(3):1-4.
15. Amatya M. Study of Knowledge, Attitude and Practice of Blood Donation among Students of Different Colleges of Kathmandu, Nepal. Int J Pharma Biol Arch. 2013;4(3):424–8.
16. WHO-Gender distribution of blood donors, by country, Global Database on Blood Safety; 2008.
Available at: www.who.int/bloodsafety/factsheet. Accessed on 21 July 2015.
17. Ahuja V, Saluja GP. Assessment of blood donors‟ perception in a hospital blood bank and their intention for future donation. Health and Popul Perspect Issues. 2009;32:78-85.
18. Dubey A, Sonker A, Chaurasia R, Chaudhary R. Knowledge, attitude and beliefs of people in North India regarding blood donation. Blood Transfus. 2014;12(1):21–7.