©FUNPEC-RP www.funpecrp.com.br Genetics and Molecular Research 18 (3): gmr18413
1
Programa de Doctorado en Ciencias Mención Biología Celular y Molecular Apicada, Universidad de La Frontera, Temuco, Chile
2
Grupo de Melhoramento Animal, Departamento de Ciências Básicas, Faculdade de Zootecnia e Engenharia de Alimentos, Universidade de São Paulo, Pirassununga, SP, Brasil.
3
University of California, Davis, USA
4
Guzera IT, Pitajui, SP, Brasil
5
Facultad de Ciencias Agropecuarias y Forestales, Universidad de La Frontera, Temuco, Chile
Corresponding author: J.B.S. Ferraz E-mail: [email protected]
Genet. Mol. Res. 18 (3): gmr18413 Received June 26, 2019
Accepted July 22, 2019 Published July 31, 2019
DOI http://dx.doi.org/10.4238/gmr18413
ABSTRACT. The Guzerat cattle breed, in past centuries, was
©FUNPEC-RP www.funpecrp.com.br Genetics and Molecular Research 18 (3): gmr18413
various breeders for each trait. The dataset was analyzed by the AIREMLF90 program. REA and MAR were the carcass and production traits with the greatest additive genetic variance; they also had the highest heritability values. The average inbreeding of animals in pedigree was 0.81%; more than 71% of animals had 0% inbreeding and only 0.04% of the animals had a coefficient over 25%. Carcass and production traits of Guzerat cattle analyzed in this study showed sufficient genetic variability to respond to a selection program, especially for the traits REA, RFT, IMF and ADG. Thus, selecting animals based on data obtained from this study will help improve Guzerat carcass quality, production efficiency and profit margins.
Key words:Guzerat; Genetic; Carcass; Productive; Inbreeding
INTRODUCTION
The Guzerat cattle breed, as it is known in Brazil and throughout America, was founded from the Indian Kankrej breed when in 1870, animals belonging to various Zebu breeds, were introduced to Brazil (Santiago, 1985). According to the “Association of Breeders of Guzerat and Guzolando of Brazil, (ACGB)”, this breed was utilized mainly for work and transport in the coffee industry because of its rusticity, and secondarily for milk and meat production. Thus Guzerat became the predominant Brazilian cattle breed up till 1920 (ACGB). Furthermore, at the beginning of the past century, the females were submitted to intense crossbreeding schemes to obtain the synthetic Indubrasil breed, decreasing up to 50% the number of females for the replenishment of the breed in 1992 (Faria et al., 2004). Nevertheless, the Guzerat breed has made a great contribution to Brazilian cattle production, improving productivity, hardiness, precocity and meat quality (Junior et al., 2013). Traits such as rib-eye area, backfat and rump fat thickness, intramuscular fat percentage and visual score for finishing have been continuously assessed in breeding programs because they are related to meat quality, carcass yield and cutability, and organoleptic properties (Bergen et al., 2005; Neto et al., 2009; Junior et al., 2013; Cafe et al., 2018), while other traits such as dry matter intake, average daily gain, metabolic weight, residual feed intake and margin are related to production efficiency (Basarab et al., 2003; Santana et al., 2014). Traditionally, genetic breeding programs in Brazil have only considered traits related to reproduction and adaptability; more recently these programs have included carcass characteristics, mainly in Nellore, with the aim to predict the genetic merit and expected progeny differences (Neto et al., 2009), but Guzerat has remained sidelined in this area. In this scenario, the objective of this study was to estimate genetic parameters of this breed for meat production and efficiency related traits, being this one of the first such efforts for Guzerat, considering carcass and productive traits.
MATERIAL AND METHODS
Genetics and Molecular Research 18 (3): gmr18413 ©FUNPEC-RP www.funpecrp.com.br
(NAP- GMABT) at the Faculty of Animal Science and Food Engineering of the University of São Paulo. The phenotypic data included 2697 records and the pedigree contained 4644 animals. Animals in pedigree were tested for inbreeding coefficient by the software Endog 4.8 (Gutiérrez and Goyache, 2005).
The traits examined in this study were ribeye area (REA), backfat thickness (BFT), rump fat thickness (RFT), intramuscular fat percentage (IMF), dry matter intake (DMI), average daily gain (ADG), scrotal circumference (SC), metabolic weight (MW), visual score for finishing (VSF), residual fees intake (RFI) and margin (MAR). REA, BFT and IMF were measured over the loin at the 12th intercostal space, RFT was measured over de rump, between the ilium and ischium bones, known as P8 fat. REA, BFT, RFT and IMF were made by trained personal using an Aloka 500 unit (Corometrics Medical System, Inc., Wallingford, Connecticut), equipped with a 3.5 MHz, 17 cm linear-array transducer and vegetable oil as conductive medium. Other traits were collected from databases and production records from various farms in Brazil. Margin is a profit coefficient based on carcass yield and money payback.
Phenotypes were tested for normality (Kolmogorov-Smirnov), and subsequently outlier records (±3 standard deviations) and animals with no phenotype records for all traits were removed. After that, 1399 animals remained for analysis, including 1057 males and 342 females. The analyses of variance components were performed using the Average Information Restricted Maximum Likelihood method (AIREMLF90) and a two-trait animal model to estimate genetic correlations and heritability. The following animal model was used: y = Xβ+ Za + e, with:
≈ 0
0 , 0
0 (Eq. 1)
G=A G0, R=Ie R0, and = observation vector for each trait; β = vector of fixed effects for sex and contemporary group; = vector of additive direct genetic random effects; e = residual vector; X = incidence matrix relating records to fixed effects of contemporary group; Z= incidence matrix relating records to additive direct genetic random effects. Contemporary groups were established based on the moment when data traits were obtained, or phenotypic evaluations were made (33 levels). Ie the identity matrix of equal order to the number of records, A the numerator relationship matrix, R0 the residual covariance matrix among measurements on the same animal, G0 the covariance matrix for additive genetic effects and the Kronecker product.
Heritability was calculated using the equation proposed by Falconer (1960).
ℎ = (Eq. 2)
Where is the genetic additive variance and is the phenotypic variance. Genetic correlations were calculated by the following equation:
= ,
(Eq. 3)
where cov1,2 is the covariance between two traits and and are the additive genetic
©FUNPEC-RP www.funpecrp.com.br Genetics and Molecular Research 18 (3): gmr18413
RESULTS AND DISCUSSION
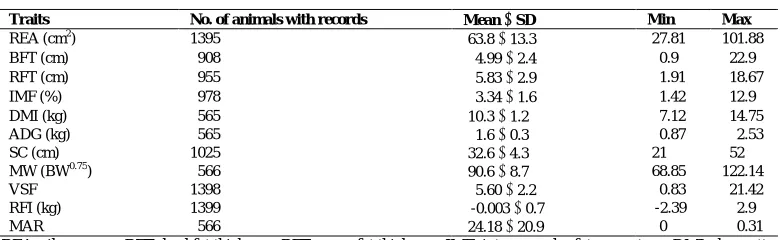
The mean and standard deviation values for each carcass and productive trait are shown in Table 1.
Table 1. Description of the final data set of carcass and productive traits in Guzerat cattle.
Traits No. of animals with records Mean SD Min Max
REA (cm2) 1395
-63.8 13.3 -27.81 101.88
BFT (cm) 0908 0-4.99 2.4 0-0.9 022.9
RFT (cm) 0955 0-5.83 2.9 0-1.91 018.67
IMF (%) 0978 0-3.34 1.6 0-1.42 012.9
DMI (kg) 0565 -10.3 1.2 0-7.12 014.75
ADG (kg) 0565 0-1.6 0.3 0-0.87 002.53
SC (cm) 1025 -32.6 4.3 -21 052
MW (BW0.75) 0566 -90.6 8.7 -68.85 122.14
VSF 1398 0-5.60 2.2 -00.83 021.42
RFI (kg) 1399 0-0.003 0.7 0-2.39 002.9
MAR 0566 -24.18 20.9 0-0 000.31
REA: rib eye area, BFT: backfat thickness, RFT: rump fat thickness, IMF: intramuscular fat percentage, DMI: dry matter intake, ADG: average daily gain, SC: scrotal circumference, MW: metabolic weight, BW: body weight, VSF: visual score for finishing, RFI: residual feed intake, MAR: margin
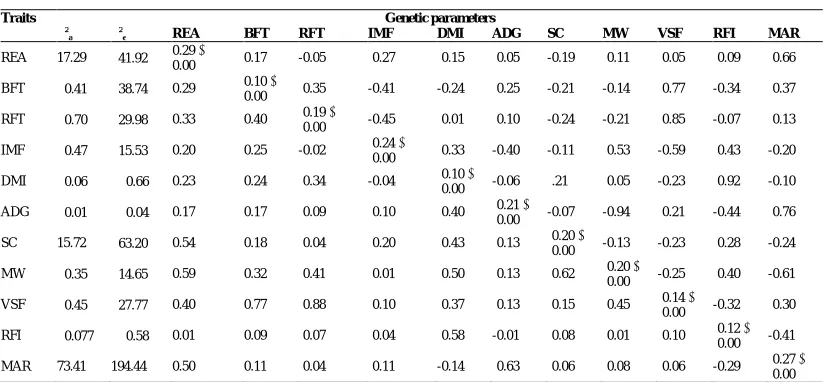
The variance component for each trait evaluated in this study, the genetic and phenotypic correlations between all of them and the estimated heritability are shown in Table 2.
The results obtained for REA, BFT and RFT are higher than those published by Neto et al. (2009) for this breed (REA: 58.1 cm2, BFT: 2.6 mm and RFT: 3.6 mm) and are similar to those published in a recent study by Aranha et al. (2018). REA is an important indicator of carcass quality. This trait gives an idea of animal muscularity and carcass yield; i.e. the larger the rib eye area, the greater the muscle score and the greater the carcass yield. Therefore, animals with a good REA are more likely to have good muscularity and yield and will give a better profit (Cafe et al., 2018). Crosses of Guzerat x Nellore has shown an improvement of this trait in 23-month-old bulls and even more when both breeds are mated with Simmental (77.4 and 87.0 cm2, respectively) (Diniz et al., 2016).
BFT and RFT also play a key role in the meat industry, since these function as a thermal insulator, preventing excessive shortening of muscle fibers during freezing, avoiding water losses and meat darkening, improving organoleptic characteristics (Park et al., 2007; Veneroni-Gouveia et al., 2012). According to some researchers, it should have a minimum thickness of about 3 mm to fulfill this function (Silva et al., 2012); and results from this study were better (4.99 and 5.83 mm for BFT and RFT respectively).
Genetics and Molecular Research 18 (3): gmr18413 ©FUNPEC-RP www.funpecrp.com.br Table 2. Estimates for variance components, heritability and standard error (diagonal), genetic correlation (above the diagonal) and phenotypic correlation (below the diagonal) of carcass and productive traits in Guzerat cattle.
Traits Genetic parameters
2
a
2
e REA BFT RFT IMF DMI ADG SC MW VSF RFI MAR
REA 17.29 041.92 0.29
0.00 0.17 -0.05 -0.27 -0.15 -0.05 -0.19 -0.11 -0.05 -0.09 -0.66 BFT 00.41 038.74 0.29 0.10
0.00 -0.35 -0.41 -0.24 -0.25 -0.21 -0.14 -0.77 -0.34 -0.37 RFT 00.70 029.98 0.33 0.40 -0.19
-0.00 -0.45 -0.01 -0.10 -0.24 -0.21 -0.85 -0.07 -0.13 IMF 00.47 015.53 0.20 0.25 -0.02 -0.24 --
-0.00 -0.33 -0.40 -0.11 -0.53 -0.59 -0.43 -0.20 DMI 00.06 000.66 0.23 0.24 -0.34 -0.04 -0.10
----0.00 -0.06 -.21 -0.05 -0.23 -0.92 -0.10 ADG 00.01 000.04 0.17 0.17 -0.09 -0.10 -0.40 -0.21
----0.00 -0.07 -0.94 -0.21 -0.44 -0.76 SC 15.72 063.20 0.54 0.18 -0.04 -0.20 -0.43 -0.13 -0.20
----0.00 -0.13 -0.23 -0.28 -0.24 MW 00.35 014.65 0.59 0.32 -0.41 -0.01 -0.50 -0.13 -0.62 -0.20
----0.00 -0.25 -0.40 -0.61 VSF 00.45 027.77 0.40 0.77 -0.88 -0.10 -0.37 -0.13 -0.15 -0.45 -0.14
----0.00 -0.32 -0.30 RFI 00.077 000.58 0.01 0.09 -0.07 -0.04 -0.58 -0.01 -0.08 -0.01 -0.10 -0.12
----0.00 -0.41 MAR 73.41 194.44 0.50 0.11 -0.04 -0.11 -0.14 -0.63 -0.06 -0.08 -0.06 -0.29 -0.27
----0.00
2
a: additive genetic variance component, 2e: residual variance component, REA: rib eye area, BFT: backfat thickness,
RFT: rump fat thickness, IMF: intramuscular fat percentage, DMI: dry matter intake, ADG: average daily gain, SC: scrotal circumference, MW: metabolic weight, VSF: visual score for finishing, RFI: residual feed intake, MAR: margin.
DMI, ADG, RFI and MW averaged 10.3 1.2 kg, 1.6 0.3 kg, -0.003 0.7 kg and 90.6 8.7 kg, respectively. These traits have been described manly in other zebu breeds, such as Nellore, in which DMI, ADG, RFI and MW averaged 7.59 1.46 kg, 1.03 0.25 kg, 0.00009 0.53 kg and 80.1 8.8 kg, respectively (Moraes et al., 2016). DMI and ADG are two important traits that give an idea of how each animal is taking advantage of food and turning it into body mass, i.e., feed conversion (FC = DMI/ADG). Moreover, the inverse of this equation gives the feed efficiency (FE = ADG/DMI) (Santana Gomes et al., 2014). Both values, DMI and ADG, were poorer for Guzerat.
Residual feed intake, which is the difference between observed feed intake and estimated feed intake, was better for Guzerat than observed for Nellore; this means that Guzerat breed could be more efficient than Nellore and need less food and nutrients for maintenance and growth (Basarab et al., 2003). MW, which is the assumption that in the animal kingdom metabolism is proportional to the body weight raised to the power 0.75 (MW = BW0.75) (Blaxter, 1989), shows that Guzerat animals are, on average, bigger than Nellore, with an average MW of 90.6 8.7 kg versus 80.1 8.8 kg. This means that Guzerat may need more food to fulfill nutrient requirements needed per each kg of meat produced; but also they may produce more meat per animal than Nellore does.
©FUNPEC-RP www.funpecrp.com.br Genetics and Molecular Research 18 (3): gmr18413
circumference had a great genetic correlation in Nellore with other corporal measurements, such as weight at 378 days (0.71), thoracic perimeter (0.53), body length (0.56) and height at buttock (0.47), and also a positive phenotypic correlation with these same traits (0.37, 0.23, 0.20, 0.20, respectively) (Cyrillo et al., 2001).
In our study VSF showed a good phenotypic correlation with most of production traits (Table 2). However, genotypic correlations were negative with IMF, DMI, SC and MW. Scrotal circumference showed a positive genetic correlation with DMI and RFI (0.21 and 0.28 respectively), and inverse correlations with BFT, RFT, VSF and MAR (0.21, -0.24, -0.23 and --0.24, respectively), while all phenotypic correlations were positive (Table 2). Genetic correlation of moderate magnitude has been reported in Nellore between visual scores and scrotal perimeter in yearling animals (Faria et al., 2009). Visual scores in Bos indicus are correlated with scrotal circumference, being useful when selecting precocious animals with enhanced visual scores (Boligon and de Albuquerque, 2011). In Guzerat, genetic correlation between body weight at different ages and scrotal circumference were moderate to high; so positive genetic changes could be expected in SC if animals are selected based on body weight, precocity and muscling (Abreu et al., 2018).
Heritability estimates found in our study for REA, BFT and RFT (0.29 and 0.10, 0.19, respectively) were lower than those found by Neto et al. (2009) (0.34, 0.32, 0.10, respectively) and by Guidolin (2010) (0.48, 0.32 and 0.10, respectively). The study made by Neto et al. (2009) included 1.319 animals for REA and BFT, and 1,321 animals for RFT and the study made by Guidolin (2010) only included 611 animals for REA and 604 animals for BFT, which gives an idea of accuracy when estimating heritability for these parameters. Estimations for our study included 1,395 animals for REA, 908 for BFT, 955 for RFT and 978 for IMF. Junior et al. (2013), using a Bayesian approach for studying alternative models for genetic analyses of these traits, measured by ultrasound, in Guzerat found heritability estimates of 0.15, 0.19 and 0.17 for REA, BFT and RFT respectively, considering a polygenic model.
No other previous study in Guzerat included IMF as a carcass characteristic to estimate heritability in this breed; however, comparing this trait between Guzerat and Nellore cattle, results show that heritability for IMF is higher than found in Nellore (0.24 and 0.19, respectively) (Magalhães et al., 2019). DMI, ADG and RFI have an estimated heritability of 0.37, 0.50 and 0.28 respectively for Nellore (Moraes et al., 2016; Polizel et al., 2018), higher than found in our study, where estimates were 0.10, 0.21 and 0.12, respectively.
Scrotal circumference heritability reported previously in Guzerat ranged from 0.42 at 200 days of age, up to 0.60 in yearling bulls, with a slight reduction at 550 days of age with values of 0.55 (Mota et al., 2019). All these values were better than found in the our study (0.20) but this consider the whole population without segmentation by age, which gives a global idea of how this trait behaves.
MW heritability was also lower than reported for Nellore (0.53 0.06) by Ceacero et al. (2016). However, a value of 0.24 has been reported in yearling Guzerat males, with a trend to a reduction with the ageing, since when the animals were 189 days of age, the heritability was 0.53 (Pelicioni et al., 2009).
Genetics and Molecular Research 18 (3): gmr18413 ©FUNPEC-RP www.funpecrp.com.br
employ finishing precocity and visual scores as criteria, and that could lead to a gain in scrotal circumference in Guzerat. Moreover, selecting by visual scores will improve body weight, muscling and fat deposition (Koury Filho et al., 2009; Gordo et al., 2012).
Finally, Table 3 shows inbreeding coefficients for animals in pedigree; the mean percentage was 0.81%. About 70% of animals were classified with 0 inbreeding, and only two animals had an inbreeding coefficient over 25%. Previously, Peixoto et al. (2006), reported a maximum value of 31% in Guzerat dairy cows in Brazil. This is supports what was reported by Faria et al. (2004), who explain that at the beginning of the past century, females were submitted to intense crossbreeding to obtain the synthetic Indubrasil breed, which decreased up to 50% the number of females available for breed renewal.
Table 3. Inbreeding coefficients of Guzerat cattle.
Inbreeding % N %
0 =0.00 3319 71.47
00 0.00 – 6.25 1125 24.22
00 6.25 – 12.50 0150 03.23
0 12.50 – 18.75 0039 00.84
0 18.75 – 25.00 0009 00.19
> 25.00 0002 00.04
Total number of animals in pedigree: 4644. Average inbreeding (%): 0.81
CONCLUSIONS
In conclusion, carcass and productive traits of Guzerat cattle analyzed in this study show sufficient genetic variability to respond to a selection program, especially for traits such as REA, RFT, IMF and ADG. Additionally, DMI has a good genetic correlation with IMF and good phenotypic correlation with ADG, which means that by selecting animals for ADG we are selecting animals with good DMI but with a genetic progression in IMF and REA, which improves meat tenderness, juiciness, flavor and MAR.
ACKNOWLEDGMENTS
The first author thanks CONICYT (Comisión Nacional de Investigación Científica y Tecnológica) for his doctoral scholarship, National Doctorate Grant CONICYT: 21151048.
CONFLICTS OF INTEREST
The authors declare no conflict of interest.
REFERENCES
Abreu LRA, Martins PGMA, Mota LFM, Ferreira TA, et al. (2018). Genetic correlations between body weight, scrotal circumference and visual evaluation scores in Bos indicus cattle. Anim. Sci. J. 89: 1223-1229.
©FUNPEC-RP www.funpecrp.com.br Genetics and Molecular Research 18 (3): gmr18413
Aranha AS, Andrighetto C, Lupatini GC, Mateus GP, et al. (2018). Performance, carcass and meat characteristics of two cattle categories finished on pasture during the dry season with supplementation in different forage allowance. Arq. Bras. Med. Vet. Zootec. 70: 517-524.
de Azambuja Ribeiro EL, Hernandez JA, Zanella EL, et al. (2008). Desempenho e características de carcaça de bovinos de diferentes grupos genéticos. Rev. Bras. Zootec. 37: 1669-1673.
Basarab JA, Price MA, Aalhus JL, Okine EK, et al. (2003). Residual feed intake and body composition in young growing cattle. Can. J. Anim. Sci. 83: 189-204.
Bergen R, Miller SR and Wilton JW (2005). Genetic correlations among indicator traits for carcass composition measured in yearling beef bulls and finished feedlot steers. Can. J. Anim. Sci. 85: 463-473.
Blaxter K (1989). Energy metabolism in animals and man. Cambridge University Press, Cambridge.
Boligon AA and de Albuquerque LG (2011). Correlações genéticas entre escores visuais e características reprodutivas em bovinos Nelore usando inferência bayesiana. Pesq. Agropec. Bras. 45: 1412-1418.
Cafe LM, McKiernan WA and Robinson DL (2018). Selection for increased muscling is not detrimental to maternal productivity traits in Angus cows. Anim. Prod. Sci. 58: 185-192.
Ceacero TM, Mercadante MEZ, Cyrillo JNDSG, Canesin RC, et al. (2016). Phenotypic and genetic correlations of feed
efficiency traits with growth and carcass traits in nellore cattle selected for postweaning weight. PLoS ONE. 11:
e0161366.
Cyrillo JNDSG, Razook AG, Figueiredo LAD, Bonilha Neto LM, et al. (2001). Estimativas de tendências e parâmetros genéticos do peso padronizado aos 378 dias de idade, medidas corporais e perímetro escrotal de machos Nelore de Sertãozinho, SP. Rev. Bras. Zootec. 30: 56-65.
Diniz FB, Villela SD, Mourthé MH, Paulino PV, et al. (2016). Evaluation of carcass traits and meat characteristics of Guzerat-crossbred bulls. Meat Sci. 112: 58-62.
Falconer DS (1960). Introduction to quantitative genetics. Oliver And Boyd, Edinburgh, London.
Faria CUD, Magnabosco CU, Albuquerque LGD, De Los Reyes A, et al. (2009). Análise bayesiana na estimação de correlações genéticas entre escores visuais e características reprodutivas de bovinos Nelore utilizando modelos linear-limiar. Arq. Bras. Med. Vet. Zootec. 61: 949-958.
Faria FJC, Vercesi Filho AE, Madalena FE, Penna VM, et al. (2004). Variabilidade genética da raça Guzerá. In Proc. V Simpósio da Soc. Bras. Melhor. Anim. Universidade de São Paulo, São Paulo.
Gordo DGM, Baldi F, Lôbo RB, Filho WK, et al. (2012). Genetic association between body composition measured by ultrasound and visual scores in brazilian nelore cattle. J. Anim. Sci. 90: 4223-4229.
Guidolin DGF (2010). Genetic association for growth, reproductive and carcass traits in Guzera Beef Cattle. In Proc. 9th World Congr. Genet. Appl. to Livest. Prod. Leipzig, Germany.
Gutiérrez JP and Goyache F (2005). A note on ENDOG: A computer program for analysing pedigree information. J. Anim. Breed. Genet. 122: 172-176.
Junior JA, Souza JC, Cushman RA, Bink MCAM, et al. (2013). Alternative Models in Genetic Analyses of Carcass Traits Measured by Ultrasonography in Guzerá cattle: A Bayesian Approach. J. Agric. Sci. 5: 29.
Koury Filho W, Albuquerque LGD, Alencar MMD, Forni S, et al. (2009). Estimativas de herdabilidade e correlações para escores visuais, peso e altura ao sobreano em rebanhos da raça Nelore. Rev. Bras. Zootec. 38: 2362-2367. Magalhães AFB, Schenkel FS, Garcia DA, Gordo DGM, et al. (2019). Genomic selection for meat quality traits in
Nelore cattle. Meat Sci. 148: 32-37.
Moraes GFD, Abreu LRA, Ferreira IC and Pereira IG (2016). Genetic analysis of residual feed intake adjusted for fat and carcass and performance traits in a Nellore herd. Cienc. Rural. 47: 20151505.
Mota LFM, Costa LS, Abreu LRA, Bonafé CM, et al. (2019). Genetic evaluation for scrotal circumference in Guzerat cattle through different models. Livest. Sci. 222: 1-6.
Neto HRL, Bergmann JAG, Gonçalves TM, Araújo FRC, et al. (2009). Parâmetros genéticos para características de carcaça avaliadas por ultrassonografia em bovinos da raça Guzerá Genetic parameters for body weight and real-time ultra sound carcass traits of Guzera cattle. Arq. Bras. Med. Vet. Zootec. 61: 251-258.
Park BY, Lee JM and Hwang IH (2007). Effect of postmortem metabolic rate on meat color. Asian-Australas. J. Anim. Sci. 20: 598.
Peixoto MGCD, Verneque RS, Teodoro RL, Penna VM, et al. (2006). Genetic trend for milk yield in Guzerat herds participating in progeny testing and MOET nucleus schemes. Genet. Mol. Res. 5: 454-465.
Pelicioni LC, Albuquerque LGD and Queiroz SAD (2009). Estimação de componentes de co-variância para pesos corporais do nascimento aos 365 dias de idade de bovinos Guzerá empregando-se modelos de regressão aleatória. Rev. Bras. Zootec. 38: 50-60.
Polizel GHG, Grigoletto L, Carvalho ME, Rossi Junior P, et al. (2018). Genetic correlations and heritability estimates for dry matter intake, weight gain and feed efficiency of Nellore cattle in feedlot. Livest. Sci. 214: 209-210.
Santana MHA, Gomes RC, Ferraz JBS and Rossi Junior P (2014). Medidas de Eficiência Alimentar para Avaliação de Bovinos de Corte. Sci. Agrar. Paran. 13: 95-107.
Genetics and Molecular Research 18 (3): gmr18413 ©FUNPEC-RP www.funpecrp.com.br
Silva SDL, Tarouco JU, Ferraz JBS, Gomes RDC, et al. (2012). Prediction of retail beef yield, trim fat and proportion of high-valued cuts in Nellore cattle using ultrasound live measurements. Rev. Bras. Zootec. 41: 2025-2031.