723
ANIMAL SCIENCE
Differentiation between three Saudi goat types using Size-free Canonical
Discriminant Analysis
M. M. A. Aziz* and F. S. Al-Hur
Department of Animal and Fish Production, College of Agriculture and Food Science, King Faisal University, Al-Ahsa, 31982, Kingdom of Saudi Arabia
Abstract
Body weight and 16 body measurements were utilized to discriminate between 188 animals randomly selected from three Saudi goat types, namely Ardi, Line1 and Line2. A size-free canonical discriminant analysis was conducted. Results indicated that Ardi breed is separated from the other two lines. The Mahalanobis distance of 0.55 was obtained between Line1 and Line2, while the corresponding distances between Ardi and each of Line1 and Line2 were 25.03 and 21.45, respectively. These values indicate that Line1 and Line2 are more closely related to each other than the relation between Ardi and each of both, which they are far apart. The three distances were significantly (P<0.01) different from each other. The cross-validation procedure assigned 100% of Ardi animals into their genetic group, while percentages of animals assigned in Line1 and line2 were 86.10 and 42.55, respectively. The size-free canonical approach is proved useful and informative in differentiating between the three breeds. Application of selective breeding to genetic improvement would benefit from the detected phenotypic differentiation.
Key words: Saudi goats, Distance, Discriminant analysis, Body measurements
Introduction
Canonical discriminant analysis (CDA) is a multivariate statistical technique used to discriminate two or more naturally occurring groups based on a suite of continuous or discriminating variables. The technique consists of two closely related procedures that allow determining underlying, dominant gradients of variation among groups of sample entities from a set of multivariate observations, to elucidate how variation among groups is maximized and variation within groups is minimized along a gradient (McGarigal et al., 2000). Thus, its usefulness resides in its mathematical deduction which permits comparison of the amount of variation existing among populations to that present within populations (Morrison, 1976; Chatfield and Collins, 1980).
Discriminant function analysis can be used not
only as a means to explain differences among groups, but also to predict group membership for sampling entities of unknown membership. In general, populations or species under study are considered to be groups defined a priori and linear measurements of morphological characters are obtained from the specimens within each sample. When applying this procedure, it is important to control within sample sources of variation in such a way that the possible variation among samples will not be masked or result from sampling errors. Thus, factors such as sex dimorphism in size, different developmental stages and indeterminate growth should be considered before different samples are submitted to a discriminant study for the analysis of species differentiation (Thorpe, 1983, 1987). The application of discriminant methods without controlling these factors may lead to spurious results, since discrimination among populations may represent a mere sampling artifact concerning the groups under study.
Discriminant analysis has been used for differentiating goat populations utilizing various morphological measurements simultaneously (Jordana et al., 1993; Herrera et al., 1996; Capote et al., 1998; Zaitoun et al., 2005; Dossa et al., 2007). In an attempt to distinguish between brown and Received 28 September 2012; Revised 25 February 2013;
Accepted 02 March 2013; Published Online 02 May 2013 *Corresponding Author
M. M. A. Aziz
Department of Animal and Fish Production, College of Agriculture and Food Science, King Faisal University, Al-Ahsa, 31982, Kingdom of Saudi Arabia
gray Bengal goats, Mukeherjee et al. (1979) reported significant difference between both breeds due to body length and chest circumference. Later, Herrera et al. (1996) employed discriminant analysis on several body measurements such as, shin circumference, chest girth, chest depth, rump length and width, and shoulder height to differentiate among five Spanish goat breeds. In Jordan, Zaitoun et al. (2005) applied discriminant analysis on 20 metrical variables to discriminate among different goat genetic groups. In these studies, step-wise discriminant analysis was first applied to select the most important discriminant variables used for differentiation among breeds under study. Then, the canonical discriminant analysis was conducted based on the selected variables.
In organisms such as goats, individuals within breeds show different developmental stages, and the samples utilized often incorporate a sampling error reflecting the presence of different age classes in the groups under study. Thus, size frequency distribution of individuals in the different populations will be a function of the ontogenetic development of individuals present in the different samples. A way of correcting the problem of the existence of variation in size due to ontogeny or to other causes would be to remove statistically the effect of size present within the samples of each group and then apply CDA to the samples already corrected for within group differences in size, (Strauss, 1985).
Saudi Arabia possesses about 2.2 million head of goats (FAOSTAT, 2007). Their share in the total annual production of meat and milk is approximately 14% and 6%, respectively. This low productivity is due to the lack of sound breeding programs for genetic improvement, operating nationwide. The population belongs to several breeds and their crosses. Unfortunately, these breeds are not completely exploited and their main characteristics are not well documented. Nevertheless, the breeds vary in color, body weight, size, morphostructural characteristics such as shape and presence or absence of horns and wattles. These differences have not been previously investigated and knowledge of such diversity is important.
In this study, three Saudi goat types were considered for investigation. They represent an important genetic resource in their environment and make up an integral part of the livestock population in the country. Our main purpose is to achieve uniformity within these three types, and develop them into three definite breeds in terms of
morphological and production characteristics, since the breed is the operational unit for the assessment of livestock diversity (Simon, 1999; Duchev and Groeneveld, 2006; Duchev et al., 2006). For this reason, characterization of local domestic animal populations is of major importance. The first step of the characterization process of any unexploited genetic resources falls on the knowledge of the morphological trait variation (Azor et al., 2008; Delgado et al., 2001). The foregoing justifies the main objective on which the present study was based, i.e. differentiation between these types based on some morphological characteristics, using size-free canonical discriminant analysis. Results obtained from this study would provide information useful to contribute to the establishment of standard for breeds both in magnitude and variability.
Materials and Methods
A total of 188 animals belonging to three different goat types were used in this study. The first type, called Ardi, is considered a definite breed, while the other two (Line1 and Line2) have been developed from unknown origins. All goats are predominantly horned. Ardi breed is black in color, and has very long dropping ear, while the other two lines are white, with a short, erected ears with different colors inside. Animals of Line1 have short hair, while those of Line2 are covered with a medium hair length. Line1 and Line2 differ in the shape of the horns and the color of the muzzle, as it is black in the former and red in the later. Age of animals and their pedigree are not known.
Data were collected on body weight (BW) and 16 body measurements including Ear length (EL), Head length (HL), Jaw length (JL), Head width (HW), Canon length (CL), Canon circumference (CC), Body length (BL), Rump width (RW), Heart girth (HG), Chest width (CW), Height at withers (WH), Tail length (TL), Fumer length (FL), Rump length (RL), Neck length (NL) and Neck circumference (NC). Weight was recorded to the nearest 100 gram using an electronic scale. After weighing, body measurements were taken, to the nearest 0.5 cm. All measurements were taken while the animal standing on a flat surface with the head held up, while restricting the animal by holding. A graduated measuring stick was used for taking the height measurements, while the length and circumference measurements were taken using a flexible tape; and a special wooden caliper was used for the width measurements. All measurements were taken by the same person.
Statistical analysis
various procedures of SAS package (SAS, 2000). Basic statistics for body weight and measurements were obtained using the PROC UNIVARIATE and PROC FREQ of SAS (2000). Variance components were also estimated to partition variation in body weight and measurements into intra-breed (residual) and inter-breed variance components, considering breed effect as random. The maximum likelihood technique (ML), as described by Van Vleck and Searle (1979), was adopted and the analysis was conducted using the VARCOMP procedure of SAS (SAS, 2000). The ML procedure was preferred because its estimators maximize the likelihood of the parameters and are consistent, asymptotically normal and efficient, (Harville, 1977). Then, the data were subjected to the logarithmic transformation, as the scatter plot of each two trait measurements followed a curved line. This relationship usually becomes linear if both measurements are transformed to logarithms (Klingenberg, 1996). In practice, log transformation often renders relations among variables more linear and also can make variances more homogeneous. Furthermore, log-transformed data are independent of measurement units, but retain the information about scale.
The method of size-free CDA consists of several steps, starting from removing the within-breed variation by regressing each character separately on the first pooled within-breed principal component. Then, CDA is applied to residues obtained from the regressions (Strauss, 1985). The analyses were performed sequentially, according to the following order:
1. The transformed data were first standardized using the STANDARD procedure of SAS (2000) to center the log transformed values of each character by the breed mean. Data were standardized to zero mean and a unit standard deviation.
2. The first eigenvector was then used as a multivariate size estimate, because the following two conditions were met:
a. All coefficients of the first eigenvector were positive
b. These coefficients were positively and significantly correlated with the values of body weight and measurements, (Strauss, 1985).
3. The standardized values were then used to estimate the first principal component, using PRINCOMP procedure of SAS (2000). The first principal component is the linear combination that accounts for the maximum variance.
4. The values of each trait were then regressed
on the first principal components (PC-1), to remove the effect of size on each character and the residues resulted from the regression analysis were obtained. The residues express variation after the removal of the within-breed size effect. This step was carried out using a combination of REGRESSION and SCORE procedures of SAS (2000), because both procedures do not standardize the regression residuals by the mean, i.e. they do not prevent the demonstration of inter-breed differences since each breed would have a mean equal to zero for each character (dos Reis, et al. 1990).
5. Canonical discriminant analysis was then performed on the residuals obtained from regression of each character on PC-1 (Strauss, 1985), using CANDISC procedure of SAS (2000). In this case, using size-free CDA would remove the effect of within-breed size variation by regressing each character separately on the first pooled within-breed principal component (a multivariate size estimate). Size-free CDA computation was then normally continued by multiplying the inter-breed covariance matrix by the inverse of the within-breed covariance matrix and extracting the eigenvalues and eigenvectors from the resulting matrix (Morrison, 1976). These eigenvectors, which express the axes of the greatest variation, are then linearly combined with the values of body weight and measurements to compose the canonical variables that produce the individual scores. The ability of this function to identify the three genetic groups was indicated as the percentage of individuals correctly classified from the sample that generated the function.
Mahalanobis distances were also calculated using the CANDSIC procedure. The accuracy of the classification was evaluated using split-sample validation (cross-validation) of the DISCRIM procedure of SAS (2000). In cross-validation, one individual is removed from the original matrix and the discriminant analysis is then performed from the remaining observations and used to classify the omitted individual. The proportion of individuals correctly re-allocated is taken as a measure of the morphological distinctness of the population. The individual scores for each breed were plotted in the space of the canonical variables that determine the patterns of discrimination among breeds, using the GPLOT procedure of SAS (2000). Phylogenetic tree of the three goat breeds was constructed based on the calculated Mahalanobis distances, using the Neighbor program of the PHYLIP (Phylogeny Inference Package) (Felsenstein, 2001).
perform the estimation, through approximating a hypothesized probability density function from the observed data. The Kernel density estimation is a nonparametric technique for density estimation in which a known density function (the kernel) is averaged across the observed data points (the canonical scores) to create a smooth approximation, (Silverman, 1986). The KDE provides a very useful means of investigating the entire populations. Then, the three dimensional plotting procedure (PROC G3D) of SAS (2000) was conducted on the KDE to gain more insight into the structure of the data.
Results
Means, standard errors and coefficients of variation (CV) of the morphometric characteristics of the three goat breeds are presented in Table (1). Mean of body weight of Ardi goats (4.98) was lower than the corresponding values observed for the other two breeds; coincided with the lowest coefficient of variation (%41.97). Ardi goats were younger at the time of measurements than animals from the other two lines. Line1 had higher mean of body weight than that of Line2, while the corresponding CV was lower. Generally, the coefficients of variation of BW were large,
reflecting great differences in size among the studied animals. On the other hand, Ardi goats had longer ear than those of the other two breeds, while its CV value was the lowest. An obvious characteristic of Ardi goats is their dropping ears. In general, means of the other body measurements were higher in Line1 compared to the corresponding values observed for the other two breeds, i.e. Ardi and Line2. The CV values coincided with these body measurements ranged between 7.60 (CC) and 18.53 (CW), between 12.84 (CC) and 26.53 (HL), and between 9.16 (CC) and 28.02 (NL) for Ardi, Line1 and Line2, respectively, reflecting differences among breeds, uncontrollable environmental circumstances such as nutrition and size as well as personal errors during taking the measurements. The high variability, as indicated by the CV values of the body weight and measurements, may also be a reflection of the wide variation observed among the ages of the studied animals. Generally, little differences between Line1 and Line2 in terms of body weight and measurements were observed in comparison with those observed between Ardi breed and each of both
Table 1. Means and their standard errors (SE) of body weight (kg) and measurements (cm) for the three breeds.
Trait
Ardi Line 1 Line 2
Mean± SD
N=88 CV(%)
Mean± SD
N=72 CV(%)
Mean± SD
N=28 CV(%)
BW 4.98±0.22 41.97 15.15±0.99 55.39 12.07±1.34 58.71 EL 18.77±0.25 12.29 14.13±0.29 17.56 13.71±0.42 16.35 HL 5.00±0.07 12.87 6.67±0.21 26.53 6.00±0.31 27.22 JL 7.11±0.07 9.33 9.48±0.27 24.27 8.65±0.36 21.67 HW 6.77±0.07 10.39 7.72±0.17 19.21 7.77±0.25 17.03 CL 9.28±0.10 9.77 11.00±0.21 16.40 10.61±0.29 14.70 CC 7.02±0.06 7.60 6.83±0.10 12.84 6.70±0.12 9.16 BL 28.44±0.44 14.67 41.05±1.15 23.77 37.13±1.57 22.37 PW 8.72±0.21 13.01 11.33±0.36 26.72 10.68±0.44 21.63 HG 38.81±0.50 12.46 55.01±1.45 22.32 50.43±2.30 24.16 CW 9.91±0.20 18.53 14.77±0.47 26.91 13.89±0.61 23.31 WH 37.93±0.43 10.56 50.84±1.13 18.81 46.61±1.74 19.72 TL 9.46±0.51 14.74 12.06±0.25 17.69 11.45±0.41 18.89 FL 18.76±0.21 10.74 25.63±0.68 22.38 23.16±1.00 22.84 RL 8.82±0.12 13.21 11.83±0.29 20.94 11.27±0.46 21.79 NL 16.78±0.26 14.36 22.80±0.64 23.63 21.02±1.11 28.02 NC 17.64±0.19 10.20 23.50±0.54 19.40 21.77±0.77 18.68
N: Number of observations CV: Coefficient of variation
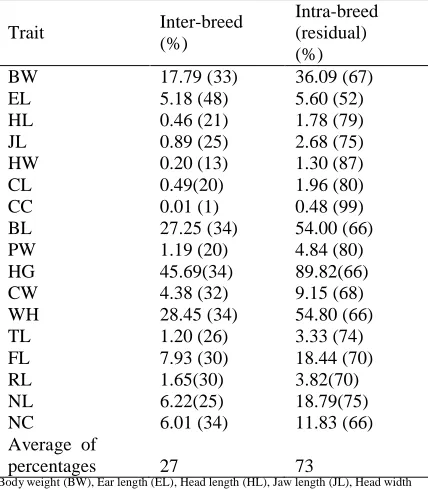
Table 2. Intra-breed and inter-breed variance components and their percentages out of the total.
Trait Inter-breed (%)
Intra-breed (residual) (%) BW 17.79 (33) 36.09 (67) EL 5.18 (48) 5.60 (52) HL 0.46 (21) 1.78 (79) JL 0.89 (25) 2.68 (75) HW 0.20 (13) 1.30 (87) CL 0.49(20) 1.96 (80) CC 0.01 (1) 0.48 (99) BL 27.25 (34) 54.00 (66) PW 1.19 (20) 4.84 (80) HG 45.69(34) 89.82(66) CW 4.38 (32) 9.15 (68) WH 28.45 (34) 54.80 (66) TL 1.20 (26) 3.33 (74) FL 7.93 (30) 18.44 (70) RL 1.65(30) 3.82(70) NL 6.22(25) 18.79(75) NC 6.01 (34) 11.83 (66) Average of
percentages 27 73
Body weight (BW), Ear length (EL), Head length (HL), Jaw length (JL), Head width (HW), Canon length (CL), Canon circumference (CC), Body length (BL), Rump width (RW), Heart girth (HG), Chest width (CW), Height at withers (WH), Tail length (TL), Fumer length (FL), Rump length (RL), Neck length (NL) and Neck circumference (NC).
Variance components are routinely estimated in quantitative genetics and animal breeding (Hofer, 1998; Ferreira et al., 1999), using several calculation methods. Maximum likelihood method was used in this study to partition the variability in body weight and measurements into intra-breed (residual) and interbreed variance components and to assess the morphological divergence between breeds. Table (2) shows the intra-breed and inter-breed variance components and their percentages out of the total. As shown from this table, percentages of the intra-breed variance (residual) were larger than those of the interbreed variance, ranging between 52% and 99% for EL and CC, with an average equal to 73%. Percentage of the inter-breed variation for CC was the lowest, accounting for 1%, confirming the lowest values of CV observed for this trait for the three breeds (7.60, 12.84 and 9.16 for Ardi, Line1 and Line2, respectively) (Table 2). This showed that most of the variability was due to within breed differences. This residual variance may be attributed to random, environmental or ontogenetic factors. According to Klingenberg (1996), discrimination between groups is often difficult because of allometric variation within groups. He further noted that the amount of
within group variation may far exceed between-group differences, which in agreement with our findings. Actually, any of these causes may confuse the study of discrimination among these breeds since they generate a variability component within the breeds. Thus, it is necessary to apply a procedure that will remove the effect of character size variation within breeds to permit the study of differentiation among them.
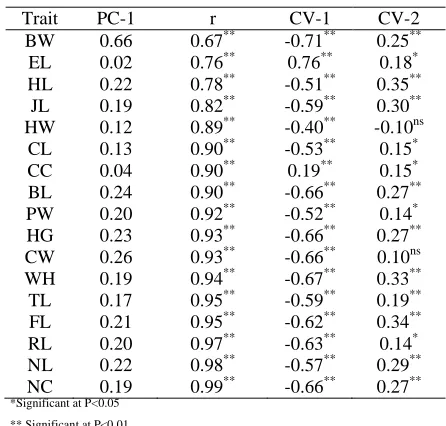
coefficients into correlation vectors, which may be calculated from the correlation between individual scores for the canonical variables and the values of the characters for each individual (Strauss, 1985). Size-free CDA was then applied to the three breeds on the basis of the residuals of each character. The correlation coefficients between the linear combination of the morphostructural variables of the native goat breeds and the scores obtained by canonical analysis are presented in Table (4). Variances of the two canonical variates (CAN1 and CAN2) were 7.02 and 0.15, representing 0.98 and 0.02 of the total variation. A highly significant canonical correlation (0.93, P<0.01) for the first canonical derived function was observed and allowed a perfect identification of individuals (Wilks lambda = 0.107; P<0.0001), while the correlation of the second correlation canonical function (0.36) was not significant. Using canonical discriminant analysis for differentiating among Creole goat breed and their F1 and F¬2 crosses with Nubian, Vargas et al. (2007) showed that percentage classification was higher in F2 (94.4%) and Creole (90.6%), than F1 (72.9%) does. They noted that the morphological traits of the Creole and F2 crosses were more stable than those of the F1. They further indicated that height at rump, rump width, rump length, head length, and chest depth were the most discriminative variables. In the same year, Dossa et al. (2007), working on morphological characterization of goats from Benin, reported that variance of CAN1 and CAN2 accounted for 92% of the total variation. When discriminating among several goat breeds of Burkina Faso, Traore et al. (2008) reported percentages of 94.5 and 5.5 for CAN1 and CAN2, respectively. Ebegbulem et al. (2011) reported an eigenvalue of 3.113, explaining 97.3% of the total variance of the morphological variables utilized for discriminating among three groups of West African Dwarf goats in Nigeria.
Correlation coefficients between body weight and measurements and the first canonical scores (CV-1) were all negative, except those of EL and CC, being the most discriminative variables. The coefficients were all significant (P<0.01), ranging between -0.71 (BW) and 0.76 (EL). The first canonical means were 2.80, -2.53 and -2.28 for Ardi, Line1 and Line2, respectively. These values indicate that Ardi breed was best identified, i.e. discriminated, by CAN1 and differed markedly in body weight and measurements from Line1 and Line 2. Correlation coefficients between body weight and measurements and the second canonical scores (CV-2) were all positive, except that of HW.
The values ranged between -0.10 (HW) and 0.35 (HL), and they were significant, except that between CV-2 and each of HW and CW measurements. These values were lower in magnitude than the corresponding values obtained for CV-1. Means of the second canonical scores were 0.01, 0.32 and -0.86 for Ardi, Line1 and Line2, respectively, indicating that Line1 and Line2 were closer and best identified by this function. Generally, the correlations between the length measurements and the canonical scores were stronger than those between width and circumference measurements and the canonical scores.
Table 3. The first principal component (PC-1), the correlation coefficients (r) between the first eigenvector
and body weight and measurements and the canonical discriminant analysis coefficients (CV-1 and CV-2) expressed as Pearson correlation coefficients between
body weight and body measurements and scores obtained by canonical analysis (CV-1 and CV-2).
Trait PC-1 r CV-1 CV-2
BW 0.66 0.67** -0.71** 0.25** EL 0.02 0.76** 0.76** 0.18* HL 0.22 0.78** -0.51** 0.35** JL 0.19 0.82** -0.59** 0.30** HW 0.12 0.89** -0.40** -0.10ns CL 0.13 0.90** -0.53** 0.15* CC 0.04 0.90** 0.19** 0.15* BL 0.24 0.90** -0.66** 0.27** PW 0.20 0.92** -0.52** 0.14* HG 0.23 0.93** -0.66** 0.27** CW 0.26 0.93** -0.66** 0.10ns WH 0.19 0.94** -0.67** 0.33** TL 0.17 0.95** -0.59** 0.19** FL 0.21 0.95** -0.62** 0.34** RL 0.20 0.97** -0.63** 0.14* NL 0.22 0.98** -0.57** 0.29** NC 0.19 0.99** -0.66** 0.27**
*Significant at P<0.05 ** Significant at P<0.01 NS not significant
Body weight (BW), Ear length (EL), Head length (HL), Jaw length (JL), Head width (HW), Canon length (CL), Canon circumference (CC), Body length (BL), Rump width (RW), Heart girth (HG), Chest width (CW), Height at withers (WH), Tail length (TL), Fumer length (FL), Rump length (RL), Neck length (NL) and Neck circumference (NC).
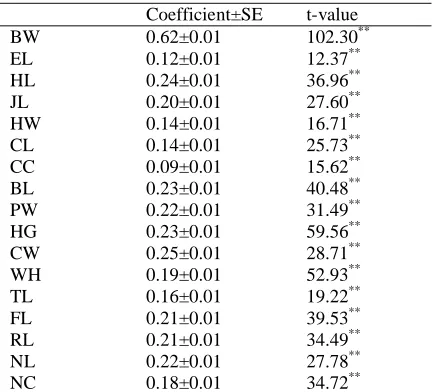
choice for such an estimate. The "residuals" are subsequent PCs, which are perpendicular to the PC-1 (Strauss, 1995). Table (4) shows the regression coefficients of body weight and each body measurement on the first principal component scores, their standard errors and the corresponding “t” values. All coefficients were significant (P<0.0001), indicating the presence of differences in size among breeds. The coefficients ranged between 0.09 (CC) and 0.62 (BW). The regression coefficient of BW was the highest indicating that differentiation among the three breeds is largely dependent on the size of the animal. The lowest coefficient was observed for CC (0.09), followed by that of EL (0.12), coincided with the lowest PC-1 values of 0 . 0 4 a n d 0 . 0 2 , r e s p e c t i v e l y , T a b l e ( 4 ) .
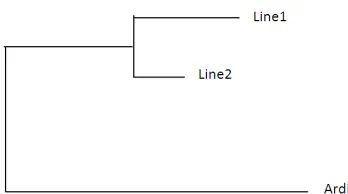
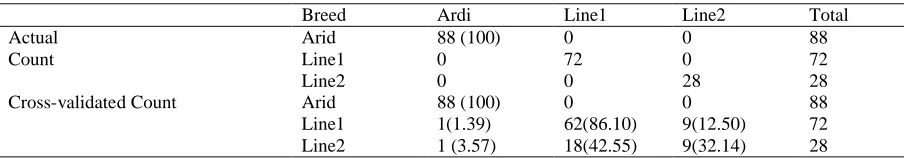
The plot of the canonical variables CAN1 and CAN2 showed two well defined and non-overlapping phenetic groupings, one corresponded to the Ardi breed that was clearly isolated from the other two overlapping lines, (Figure 1). This finding was confirmed by the three dimensional plot, shown in Figure (2). There are two clear and isolated modes observed in the diagram, corresponding to the two clusters observed in Figure (1). The highest one is coincided with Ardi breed, while the lowest coincided with the two lines. This indicates that Ardi breed is more homogenous and greatly differs from the other two breeds. This was supported by the values of the Mahalanobis distance estimated between the three breeds based on the 17 variables studied (Table 5). Distances between all pair-wise comparisons were significant (P<0.001). The distance between Line1 and Line2 was the closest (0.55), i.e. they were poorly differentiated from each other, while distances between Ardi and each of Line1 and Line2 were larger, accounting for 25.03 and 21.44 between Arid and each of Line1 and Line2, respectively. The dendogram (Figure 3) showed two clusters: cluster one included Line1 breed as a large group and one sub cluster representing Line2, while cluster two included Ardi breed which is clearly separated from cluster one. The distribution of the three breeds shown in the three figures agrees with the results of the Mahalanobis distances (Table 5). The two discriminant functions accurately classified the individual goats into their respective breeds (Table 6). Although the cross-validation process with split-sample method correctly assigned 100% of Ardi animals into their distinct genetic groups, it assigned only 86.10% and 42.55% of animals belonging to Line1 and Line2 into their original distinct genetic groups. The results of Table (6) indicated one animal
from each of Line1 and Line2 was misclassified under Ardi breed with percentages accounting for 1.39 and 3.57, respectively. On the other hand, 9 goats were misclassified from each line, i.e. Line1 and Line2 with percentages accounting for 12.50 and 32.14 for both lines, respectively. The reason that could be adduced for these misclassifications is the high degree of intermingling between the two lines. Working on three groups of West African Dwarf goats, Ebegbulem et al. (2011) indicated that 83.5%, 82.8% and 85.2% of the original cases of the three groups were correctly classified, while 16.7% of individuals belonging to class 1 was classified as belonging to class 2; 10.3% and 6.9% individuals in class 2 were wrongly classified as belonging to classes 1 and 3 respectively. They further indicated that 14.8% of individuals belonging to class 3 were wrongly classified as belonging to class 2. They concluded that the cross-validation analysis upheld the results of the original classification in classes 1 and 3, but shows that 77.6% of individuals in class 2 were correctly classified and that 12.1% of class 2 individuals were wrongly classified as belonging to class 3.
Table 4. The regression coefficients of body weight and each body measurement on the first principal component scores, their standard errors (SE) and the corresponding t
values.
Coefficient±SE t-value BW 0.62±0.01 102.30** EL 0.12±0.01 12.37** HL 0.24±0.01 36.96** JL 0.20±0.01 27.60** HW 0.14±0.01 16.71** CL 0.14±0.01 25.73** CC 0.09±0.01 15.62** BL 0.23±0.01 40.48** PW 0.22±0.01 31.49** HG 0.23±0.01 59.56** CW 0.25±0.01 28.71** WH 0.19±0.01 52.93** TL 0.16±0.01 19.22** FL 0.21±0.01 39.53** RL 0.21±0.01 34.49** NL 0.22±0.01 27.78** NC 0.18±0.01 34.72**
Figure 1. Canonical representation of the three native Saudi goat breeds using the morphological variables.
Figure 2. The bivariate kernel density of the two canonical discriminant scores of the three goat types.
Figure 3. Representation of the similarity among the three goat types.
Table 5. The Mahalanobis distances (above the diagonal) and their F values (below the diagonal) estimated between the three breeds according to body weight and
measurements.
Table 6. Actual and cross-validated numbers of goats and their percentages classified in the three breeds.
Breed Ardi Line1 Line2 Total
Actual Count
Arid 88 (100) 0 0 88
Line1 0 72 0 72
Line2 0 0 28 28
Cross-validated Count Arid 88 (100) 0 0 88
Line1 1(1.39) 62(86.10) 9(12.50) 72 Line2 1 (3.57) 18(42.55) 9(32.14) 28
Discussion
Morphometric measurements have been found useful in contrasting size and shape of animals (Mckracken et al., 2000; Latshaw and Bishop, 2001; Afolayan et al., 2006; Ajayi et al., 2008). These measurements can be utilized as criteria for describing breeds and differentiating between them. Further, they can be used for distinguishing groups of animals and establishing breeds (Sierra, 2009). Herrera (2007) stated that morphometric variables could be used to explore breed structure and variability between various breeds. Later, Parés i Casanova (2009) mentioned that these measurements could be considered a proxy for describing a breed. On the other hand, canonical discriminant analysis has usually been used to discriminate goat populations based on morphological characters measured from adequately large sample sizes (Jordana et al., 1993, Herrera et al., 1996; Zaitoun et al., 2005). However, the application of CDA to study organisms varies within samples due to sampling bias, may result in artifactual discrimination due to shifts in mean character values. In such cases, data must be corrected for within-group size differences before conducting the canonical discriminant analysis. Separation of size-related variation within groups from between-group differences has been a traditional topic in several morphometrics studies (Bookstein et al., 1985; Rohlf and Bookstein, 1987; Marcus, 1990; Reyment, 1991). In the present study, several morphometric measurements were utilized to differentiate among three Saudi goat breeds using a size-free canonical discriminant analysis. Data were corrected for within-breed size differences, which found to be larger than between breed variance, before conducting the canonical discriminant analysis. The method did effectively discriminate among the three breeds despite the variation in size existing within each population.
Mahalanobis distance between Line1 and Line2 suggest that both lines are more closely related to each other than their relation with Ardi breed. In
a good discriminant variable on Rove breed and Chad’s Creole goats. Vargas et al. (2007) indicated that height at rump, rump width, rump length, head length, and chest depth were the most discriminative variables among Creole breed and their F1 and F2 crossbreds sired by Nubian bucks.
The proportion of individuals correctly re-allocated is taken as a measure of the morphological distinctness of the population. In this study, the cross-validation process assigned 100% of Ardi animals into their distinct genetics group, while percentages of animals assigned in Line1 and line2 were 86.10 and 42.55, respectively. In related investigation, Dossa et al. (2007) was able to correctly allocate more than 70% of individual goats into their different groups. Similarly, Traore et al. (2008) used discriminant analysis to correctly classify most Sudan and Sudan-Sahel goat populations of Burkina Faso into their source population (79.3% and 82.7%, respectively).The observed morphological differences among the studied breeds may support the hypothesis that much of the morphological variation is under genetic control, indicating that they can be objectively improved under proper management practices. The phenotypic characterization in previous studies aimed to identify and differentiate goat breeds in different countries and to determine which variables, among several zoometric variables, were most effective for this purpose. The statistical methods used were mainly discriminant analysis, canonical discriminant analysis and step-wise discriminant analysis. The conclusion differed for each objective, highlighting the need to standardize the statistical methods according to the objective. It was necessary to explore new classification methods that may be more accurate for distinguishing between breeds and allow a better understanding of the involvement of each variable in the process of classification. In the present study, size-free CDA is applied to differentiate among three Saudi goat types. The approach has not been previously applied on livestock species, although it was employed in evolutionary biology and systematic (Campbell and Atchley, 1981; Neff and Marcus, 1980). It has also been used in studies of geographic differentiation and in the analysis of species differentiation and macro-evolution (Thorpe, 1983; Lessa and Patton, 1989; Patton and Smith, 1989). The approach is proved useful and informative in differentiating between the three breeds under study, but it needs further investigation regarding its reliability.
Conclusion
The results indicated that there was clear separation between Ardi breed and the other two lines that were closely related to each other. Therefore, the technique used in this study could be utilized in field assessment, management and conservation of different goat populations, where the goal is to distinguish among them and to obtain phenotypically pure local genetic resources for future selection and breeding improvement strategies. In this regard, there is a need to exploit traits peculiar to each breed for establishing sustainable genetic improvement programs under on-farm conditions. However, an investigation on the genetic characterization of Saudi goats utilizing the tools of molecular genetics will complement the results obtained from morphometric differentiation. Molecular genetic analysis together with participatory breeding programs involving local breeders is needed to validate the present results. This could permit rapid field assessment and subsequent conservation of the goat genetic resources in the country.
Acknowledgement
This research work was supported by the Deanship of Scientific Research, King Faisal University, Saudi Arabia, Grant No. 110074.
References
Afolayan, R. A, I. A. Adeyinka and C. A. M. Lakpini. 2006. The estimation of live weight from body measurements in Yankasa sheep. Czech J. Anim. Sci. 51:343-348.
Ajayi, F. O., O. Ejiofor and M. O. Ironke. 2008. Estimation of body weight from linear body measurements in two commercial meat-type chickens. Global J. Agric. Sci. 7:57-59.
Azor, P. J., F. Goyache and J. P. Gutiérrez. 2008. Método genéticos y estadísticos de diferenciació n entre poblaciones. In: Junta de Andalucía (Ed.). pp. 169–184. La ganadería andaluza en el siglo XXI, Patrimonio Ganadero Andaluz, vol. III.
Bookstein, F. L. 1982. Foundations of morphometrics. Ann. Rev. Ecol. Syst. 13:541-470.
Bouchel, D., J. J. Lauvergne, E. Guibert and F. Minvielle. 1997. Morpho-biometrical study of Rove goats. I. Height at the withers (HW), depth of the thorax (DT), substernal gap (SG) and index of substernal slenderness (Iss) of females. Rev. Méd. Vét. 148:37–46.
Campbell, N. A. and W. R. Atchley. 1981. The geometry of canonical variate analysis. Syst. Zool. 30:268-280.
Capote, J., J. V. Delgado, M. Fresno, M. E. Camacho and A. Molina. 1998. Morphological variability in the Canary goat population. Small Rum. Res. 27:162–167.
Chatfield, C. and A. J. Collins. 1980. Introduction to Multivariate Analysis. McGraw-Hill, New York.
Delgado, L. H., C. Barba, M. E. Camacho, F. T. P. S. Sereno, A. Martinez and J. L. Vega-Pla. 2001. Livestock characterization in Spain. AGRI 29:7-18 (in Spanish).
Dos Reis, S., L. Pessoa and R. Strauss. 1990. Application of size-free canonical discriminant analysis to studies of geographic differentiation. Braz. J. Gen. 13(3):509-520.
Dossa, L. H., C. Wollny and M. Gauly. 2007. Spatial variation in goat populations from Benin as revealed by multivariate analysis of morphological traits. Small Rum. Res. 73:150-159.
Duchev, Z., O. Distl and E. Groeneveld. 2006. Early warning system for loss diversity in European livestock breeds. Arch. Für Tierzucht, Dummerstorf 49:521-531.
Duchev, Z. and E. Groeneveld. 2006. Improving the monitoring of animal genetic resources on National and International level. Arch. Für Tierzucht, Dummerstorf 49: 532-544.
Ebegbulem, V. N. S. N. Ibe and B. O. Asuquo. 2011. Morphometric differentiation of West African Dwarf goats in Sothern Nigeria using discriminant analysis. J. Agric. Vet. Sci. 3:29-34.
FAOstat. 2007. http://faostat.fao.org/default.aspx
Felsenstein, J. 2001. PHYLIP: Phylogeny Inference Package. University of Washington, pp. 246.
Ferreira, G. B., M. D. MacNeil and L. D. Van Vleck. 1999. Variance components and breeding values for growth traits from
different statistical models. J. Anim. Sci. 77:2641–2650.
Harville, D. A. 1977. Maximum likelihood approaches to variance component estimation and to related problems. J. Am. Stat. Assoc. 72:320-338.
Hernández, J. S. 2000. Ethnological characterization of the Creole goats in the Puebla southern, México, Doctoral thesis, University of Có rdoba, Có rdoba, Spain).
Herrera, M. 2007. Metodología de caracterizació n zooetnoló gica. La ganadería andaluza en el siglo XXI, Patrimonio ganadero andaluz I, pp. 435–448. (in Spanish).
Herrera, M., E. Rodero, M. J. Gutierrez, F. Pena and J. M. Rodero. 1996. Application of multifactorial discriminant analysis in the morphostructural differentiation of Andalusian caprine breeds. Small Rum. Res. 22:39–47.
Hofer, A. 1998. Variance component estimation in animal breeding: A review. J. Anim. Breed. Gen. 115(1-6):247–265.
Jordana, J., O. Ribo and M. Pelegrin. 1993. Analysis of genetic relationships from morphological characters in Spanish goat breeds. Small Rum. Res. 12:301–314.
Klingenberg, C. P. 1996. Multivariate allometry, In: L. F. Marcus, M. Corti, A. Loy, G. J. P. Naylor and D. E. Slice (Eds.). pp. 23-49. Advances in Morphometrics. Series: Nato Science Series A: (closed), Vol. 284. Proceedings of the NATO ASI held in Il Ciocco, Tuscany, Italy, July 18-30, 1993.
Latshaw J. D. and B. L. Bishop. 2001. Estimating body weight and body composition of chickens by using noninvasive measurements. Poultry Sci. 80:868-873.
Lessa, H. P. and J. L. Patton. 1989. Structural constraints, recurrent shapes and allometry in pocket gophers (genus Thomomys). Biol. J. Linn. Soc. 36:349-363.
Marcus, L. F. 1990. Traditional morphometrics. In: F. J. Rohlf and F. L. Bookstein. (Eds.) pp. 77-122. Proceedings of the Michigan morphometrics workshop, Special Publication No. 2: Ann Arbor. Museum of Zoology, University of Michigan.
McCracken, K. V., D. C. Paton and A. D. Afton. 2000. Sexual size dimorphism of the Musk duck. Wilson Bull. 112:457-466.
McGarigal, K., S. Cushman and S. Stafford. 2000. Multivariate Statistics for Wildlife and Ecology Research. Springer Verlag, New York.
Morrison, D. F. 1976. Multivariate Statistical Methods. McGraw-Hill: New York.
Mukeherjee, D. K., C. S. P. Singh and H. R. Mishra. 1979. A note on some phenotypic parameters in grey and brown Bengal goats. Indian J. Anim. Sci. 49:671–671.
Neff, N. A. and L. F. Marcus. 1980. A Survey of Multivariate Methods for Systematics. Privately Published, New York.
Parés i Casanova, P. M. 2009. Zoometría. Valoració nmorfoló gica de los animals domésticos. Ministerio de Medio Ambiente y Medio Rural y Marino, 6:171–196. (in Spanish).
Patton, J. L. and M. F. Smith. 1989. Population structure and the genetic and morphologic divergence among pocket gopher (genus Thomomys). In: D. Otte and J. A. Endler (Eds.). pp. 215-235. Sepciation and its Consequences, Sinauer, Sunderland.
Pimentel, R. A. 1979. Morphometrics: The Multivariate Analysis of Biological Data. Kendalll/ Hunt: Dubuque, Iowa.
Reyment, R. A. 1991. Multidimensional Palaeobiology. Pergamon Press, Oxford.
Rohlf. F. J. and F. L. Bookstein. 1987. A comment on shearing as a method for "size correction”. Syst. Zool. 36:356-367.
SAS. 2000. SAS User’s Guide in Statistics, release 9.2. SAS Institute Inc. Cary NC, USA.
Sierra, I. 2009. Importancia de la morfología y su valoració n en los animals domésticos. Valoració n morfoló gica de los animales domésticos. Ministerio de Medio Ambiente y Medio Rural y Marino. 1:23–46 (in Spanish).
Silverman, B. W. 1986. Density Estimation. Chapman and Hall, New York.
Simon, D. L. 1999. European approaches to conservation of farm animal genetic resources. AGRI 25:79–99.
Strauss, R. E. 1985. Evolutionary allometry and variation in body form in the South American catfish genus Corydoras (Callichthyidae). Syst. Zool. 34(4):381-396.
Strauss, R. E. 1995. Metamorphic growth-gradient changes in the South American loricariid catfishes Loricariichthys maculatus and Pseudohemiodon laticeps. Studies Neotrop. Fauna Env. 30:177–191.
Thorpe, R. S. 1983. A review of the numerical methods for recognizing and analyzing racial differentiation. In: Numerical Taxonomy, J. Felsenstein (Ed.). pp. 404-423. Springer-Verlag: Berlin.
Thorpe, R. S. 1987. Geographic variation: a synthesis of cause, data, pattern and congruence in relation to subspecies, multivariate analysis and phylogenesis. Boll. Zool. 54:3-11.
Traore, A., H. H. Tamboura, A. Kabore, L. J. Royo, I. Fernandez, I. Alvarez, M. Sangare, D. Bouchel, J. P. Poivey, D. Francois, L. Sawadogo and F. Goyache. 2008. Multivariate analyses on morphological traits of goats in Burkina Faso. Arch. Für Tierzucht, Dummerstorf 51:588-600.
Van Vleck, L. D. and S. R. Searle. 1979. Variance Components and Animal Breeding. Cornell University, N.Y.
Vargas, S., A. Larbi and M. Sánchez. 2007. Analysis of size and conformation of native Creole goat breeds and crossbreds used in smallholder agrosilvopastoral systems in Puebla, Mexico. Trop. Anim. Health Prod. 39:279–286.
Wright, S. 1954. The interpretation of multivariate systems, In: O. Kempthorne, T. A. Bancroft, J. W. Gowen and J. L. Lush (eds). pp. 11-33. Statistics and Mathematics in Biology. Iowa State College Press, Ames.
Yakubu, A., A. E. Salako, I. G. Imumorin, A. O. Ige and M. O. Akinyemi. 2010. Discriminant analysis of morphometric differentiation in the West African Dwarf and Red Sokoto goats. South Afr. J. Anim. Sci. 40(4):381-487.
Zaitoun, I. S., M. J. Tabbaa and S. Bdour. 2005. Differentiation of native goat breeds of Jordan on the basis of morphostructural characteristics. Small Rum. Res. 56:173–182.