Infogain Publication (Infogainpublication.com) ISSN : 2454-1311
Experimental Study of the Influence of Tool
Geometry by Optimizing Helix Angle in the
Peripheral Milling Operation using Taguchi
based Grey Relational Analysis
Vikas V
1, Shyamraj R
2, Abraham K. Varughese
31M.Tech. Student, College of Engineering and Management, Punnapra, Alappuzha, Kerala
2Assistant Professor, College of Engineering and Management, Punnapra, Alappuzha, Kerala
3
Scientist/Engineer, Vikram Sarabhai Space Centre (ISRO), Thiruvananthapuram, Kerala
Abstract—Tool selection is a critical part during
manufacturing process. The tool geometry plays a vital role in the art of machining to produce the part to meet the quality requirements. The tool parameters which play major roles are tool material, tool geometry, size of the tool and coating of the tool. Out of these, selection of right kind of tool geometry plays a major role by reducing cutting forces and induced stresses, energy consumptions and temperature. All this will leads to reduced distortions and the selection of wrong tool geometry results in enhanced tool cost and loss in production. However these tool geometric features are often neglected during machining considerations and procurement of tools. Thus the objective of the study is to analyze the contribution of tool geometry in peripheral milling operation and to find the optimized helix angle to get minimum cutting force (useful in thin wall machining) and thereby ensuring perpendicularity and best surface finish to reduce the chatter vibration and deflection by optimizing the machining parameters such as spindle speed, feed per tooth and side cut. The experiments are conducted on CNC milling machine on aluminium alloy 2014 using solid carbide end mills of 10 mm diameter with various helix angles by making all other geometric features constant. Taguchi method is used for design of experiment. The optimum level of parameters has been identified using Grey relational analysis (GRA) and also the percentage contribution is identified using ANOVA.
Keywords— ANOVA, end mill, Grey relational analysis helix angle, Machining dynamics, peripheral milling, tool geometry.
I. INTRODUCTION
Machining is a term that covers large collection of manufacturing processes designed to remove unwanted materials in the form of chips from a workpiece. Almost every manufactured product has components requiring
machining almost to great precision [9]. Most of the existing researches for machining the components are only based on process planning and the influences of cutter geometric features are often neglected. But the previous researches points out that the tool geometric feature has a direct influence in the cutting performance and should not be neglected during machining consideration [2].In the 1980’s the cutting performances of several right and left hand helix are reported to explain the importance of cutter geometric features and the effect on cutting force and surface roughness [1]. The previous studies say that geometry of milling cutter surfaces is one of the determining parameters affecting the quality of manufacturing process and the end milling has been widely used in manufacturing industry for its efficiency and its versatility. Peripheral milling operation (one of the type of end milling) by using the end mills is selected to study the influence of helix angle as the periphery of the end mill is determined by the helical structure of the tool. 1.1 Machining Dynamics
Infogain Publication (Infogainpublication.com) ISSN : 2454-1311
II. ENDMILL GEOMETRICAL FEATURES
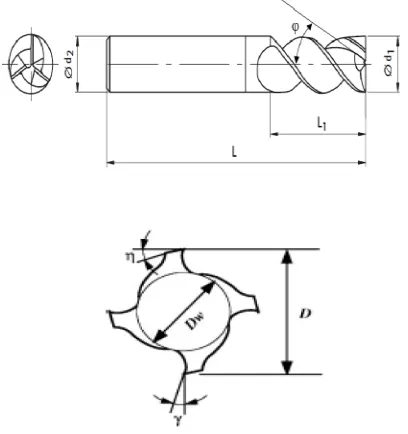
Tool geometry is very important to ensure the right formation of chips. The shape of an end mill is a primary influencing factor which affect the surface finish. The geometrical feature of an end mill consists of diameter
(D), inscribed circle diameter (DW), Number of flutes (N),
rake angel ( ), clearance angle ( ) and helix angle ( ) as shown in figure 1
Fig.1: Endmill Geometrical features
Each of the geometrical features has their own specific functions. Radial rake angle has a major effect on the power efficiency. It also determines the life of the tool since it will affect the stiffness of the cutting edge. A positive rake angle endmill will improve machinability, there by producing the lower cutting force and cutting temperature. Axial rake angle controls the chip flow and the thrust force of the cut and also the strength of the cutting edge determined by axial rake angle. The primary clearance is selected for the material being machined and prevents the tool from rubbing on the workpiece. It also affects the strength of the tool. The secondary clearance must be large to clear the workpiece and permit chips to escape but not so large that it weakens the cutter or tool [8]. On the other side, a small clearance angle is likely to produce noise and higher surface roughness [2].
III. EXPERIMENTAL DETAILS 3.1 Workpiece
Two aluminium 2014 blocks of sizes 158x142x50 and 182x143x50 were used. Slot width of 10 mm which is the diameter of the tool are machined on both sides of the blocks to produce the wall thickness of 3mm, 4mm, and 5mm using slot milling process with depth of 11 mm to do the peripheral milling on the walls. Figure 2 shows one of the workpiece
Fig.2: Workpiece after Slot Milling
3.2 Cutting Tool
Three uncoated solid carbide end mill cutters as shown in figure 3 made from SECO TOOLS, SWEDEN are used in this experiments.
Fig.3: Endmills used in the experiment (50o, 27o, 38o Helix angles)
The tools are selected with varying helix angle by making all other geometrical features constant as shown in table 1. The helix angle, rake angle and the clearance angle are measured using ZOLLER TOOL MEASURING and PRESETTING MACHINE, GERMANY. It uses the technology of Image/Vision based measurement system to get the clear structure of the tool on the screen with the help of transmitted and incident light and inspected using the pilot 3.0 software.
Table 1: Details of tools used in the experiment
Tools Tool 1 Tool 2 Tool 3
Tool Manufacture No:
39100 35100 36100
Helix Angle 27o 38o 50o
Diameter (d)
10 mm 10 mm 10 mm
Number of Cutting Edges (Z)
3 3 3
Full Length (L)
75 mm 75 mm 75 mm
Flute Length (l)
Infogain Publication (Infogainpublication.com) ISSN : 2454-1311 Radial Rake
Angle (γ)
10o 10o 10o
Clearance
angle(α)
15o 15o 15o
IV. DESIGN OF EXPERIMENT
As per our data, we have to conduct a total of 81 (4
factors each at three levels which gives a total of 34=81
experiments) experiments. This is known as full factorial experiment. When the experiment is done with reduced number of experiments, it is called fractional factorial experiment. In fractional factorial experiment only certain selected experiments are done according to the design (orthogonal array).Taguchi’s Orthogonal Arrays are used for the experimental design to reduce the experiments.
Thus L27 (34) orthogonal array is used 27 rows
corresponding to the number of tests as shown in table 2. Table 2: L27 (34) Orthogonal Array
Exp no:
Helix angle Spindle
Speed
Feed per Tooth
Side Cut
1 27 2500 0.04 1
2 27 2500 0.04 2
3 27 2500 0.04 3
4 27 3500 0.06 1
5 27 3500 0.06 2
6 27 3500 0.06 3
7 27 4500 0.08 1
8 27 4500 0.08 2
9 27 4500 0.08 3
10 38 3500 0.08 1
11 38 3500 0.08 2
12 38 3500 0.08 3
13 38 4500 0.04 1
14 38 4500 0.04 2
15 38 4500 0.04 3
16 38 2500 0.06 1
17 38 2500 0.06 2
18 38 2500 0.06 3
19 50 4500 0.06 1
20 50 4500 0.06 2
21 50 4500 0.06 3
22 50 2500 0.08 1
23 50 2500 0.08 2
24 50 2500 0.08 3
25 50 3500 0.04 1
26 50 3500 0.04 2
27 50 3500 0.04 3
V. EXPERIMENTAL ANALYSIS
The experiment was conducted in 3-axis CNC milling machine. The rotating cutting force dynamometer (RCD)
was installed to measure the cutting force for the peripheral milling operation. Three tools of varying helix angles were used in this experiment. The tools were
replaced with 27o, 38o and 50o helix tools for each nine
experiments respectively to study the influence of helix angles. The peripheral milling was carried out for 142 mm length on first block and 143 mm length on second block. Wall of thickness 2mm was left after each
experiment with a side cut (ae) of 1 mm, 2mm and 3mm
side on 3mm, 4mm and 5mm wall thickness respectively. The peripheral milling profile is shown in the figure 4.
Fig 4: Peripheral Milling Profile
Cutting force was measured from the graph recorded in the computer. The surface roughness was measured using
the TAYLOR/ HOBSON PRECISION FORM
TALYSURF MACHINE and perpendicularity is
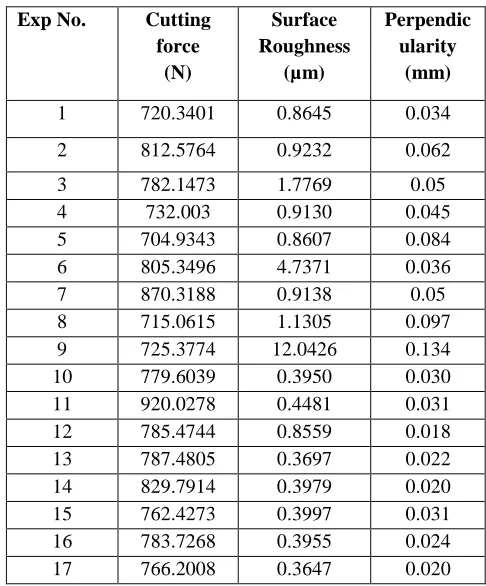
measured using LEITZ PRECISION MEASURING MACHINE, grade–c. The measured outputs are given in the table 3
Table 3: Results Obtained Exp No. Cutting
force (N)
Surface Roughness
(µm)
Perpendic ularity
(mm)
1 720.3401 0.8645 0.034
2 812.5764 0.9232 0.062
3 782.1473 1.7769 0.05
4 732.003 0.9130 0.045
5 704.9343 0.8607 0.084
6 805.3496 4.7371 0.036
7 870.3188 0.9138 0.05
8 715.0615 1.1305 0.097
9 725.3774 12.0426 0.134
10 779.6039 0.3950 0.030
11 920.0278 0.4481 0.031
12 785.4744 0.8559 0.018
13 787.4805 0.3697 0.022
14 829.7914 0.3979 0.020
15 762.4273 0.3997 0.031
16 783.7268 0.3955 0.024
Infogain Publication (Infogainpublication.com) ISSN : 2454-1311
18 679.0788 0.3528 0.018
19 762.0045 2.1664 0.015
20 811.5694 1.9391 0.020
21 758.4461 2.1308 0.022
22 760.1509 1.8828 0.023
23 853.7375 1.9194 0.029
24 905.4611 4.0485 0.030
25 844.0668 2.5229 0.033
26 876.0125 2.8238 0.019
27 902.1992 5.4441 0.022
VI. OPTIMIZATION USING GREY RELATIONAL ANALYSIS 6.1 Grey Relational analysis
The grey relational analysis (GRA) developed by Deng in 1989 suggested the grey theory based on the random uncertainty of small samples which develop into an evaluation technique to solve certain problems of system that are complex and having incomplete information. The grey relational analysis (GRA) is one of the powerful and effective soft-tool to analyze various processes having multiple performance characteristics. Thus the values are optimized using the steps in GRA. Some of the equations are
If the expectancy is “larger-the-better”, then the original sequence is normalized as follows
∗ =
If the expectancy is “smaller-the-better”, then the original sequence is normalized as follows.
∗ = max −
max − min
Normalization of Cutting Force
Normalization of Cutting Force is based on smaller the better criterion because Cutting Force should be minimized
∗ =
Normalization of Ra
Surface roughness values should be minimized to 0. So we take smaller the better equation for normalizing the Ra value.
∗ =
Normalization of Perpendicularity
Perpendicularity values should be minimized to 0. So we take smaller the better equation for normalizing the perpendicularity value.
∗ =
6.2 Finding the Response Table for Grey Relational Grade
The mean of the grey relational grade for each level of parameter and the total mean of the grey relational grade for the 27 experiments were calculated as shown in table 4
Table 4: Response Table for Grey Relational Grade Process
Parameters
Level 1
Level 2
Level 3
Max-Min
Rank
Helix angle
0.666 0.809* 0.687 0.142 1
Spindle Speed
0.731* 0.715 0.716 0.016 4
Feed per
Tooth
0.7113 0.758* 0.694 0.063 2
Side Cut 0.752* 0.718 0.692 0.0604 3
Total mean value of grey grade = 0.721121 *Optimum levels
VII. ANALYSIS OF VARIANCE (ANOVA) The purpose of analysis of variance (ANOVA) is to investigate which of the process parameters significantly
affect the performance characteristics. This is
accomplished by separating the total variability of the grey relational grades, which is measured by the sum of the squared deviation from the total mean of the grey relational grade into contributions by each machining parameter and the error. The ANOVA test establishes the relative significance of the individual factors and their interaction effects.
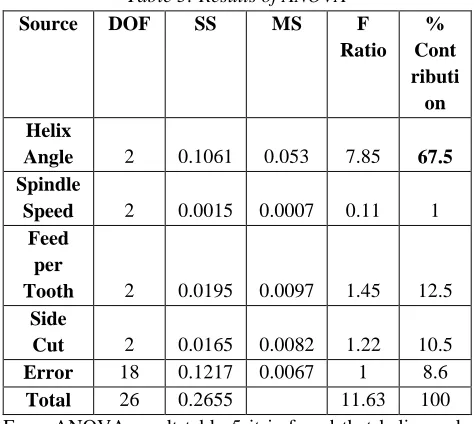
Table 5: Results of ANOVA
Source DOF SS MS F
Ratio % Cont ributi on Helix
Angle 2 0.1061 0.053 7.85 67.5 Spindle
Speed 2 0.0015 0.0007 0.11 1 Feed
per
Tooth 2 0.0195 0.0097 1.45 12.5 Side
Cut 2 0.0165 0.0082 1.22 10.5
Error 18 0.1217 0.0067 1 8.6
Total 26 0.2655 11.63 100
From ANOVA result table 5 it is found that helix angle (tool geometry) is the most influencing factor on over all responses. 67.5% of result is influenced by the helix angle followed by feed per tooth of 12.5%. The side cut has 10.5% of contribution and the least contribution is given by the spindle speed of 1%.
(1)
(2)
(4)
(5)
Infogain Publication (Infogainpublication.com) ISSN : 2454-1311
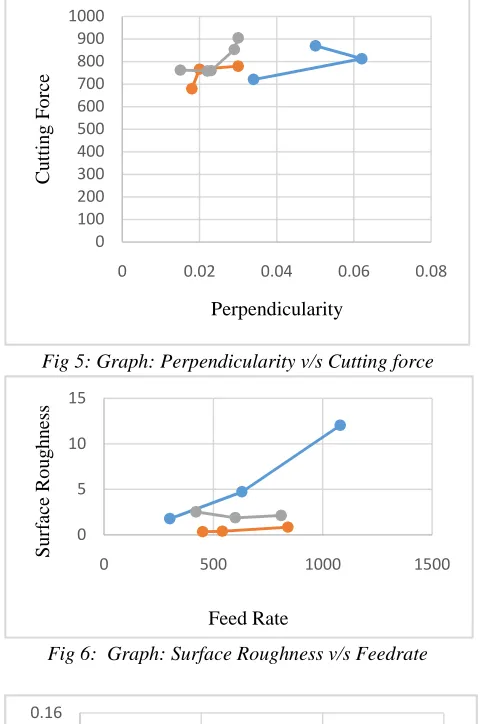
Fig 5: Graph: Perpendicularity v/s Cutting force
Fig 6: Graph: Surface Roughness v/s Feedrate
Fig 7: Graph: Perpendicularity v/s Feedrate
VIII. CONCLUSION
1. The percentage influence of parameters on
multi-response variables using GRA was obtained as; Helix angle 67.5%, Feed per Tooth 12.5 %, Side Cut 10.5 % and Spindle Speed 1%. Thus it is clear that helix angle (tool geometry) has a greatest influence in milling process on aluminium.
2. The tool with helix angle 27o has the highest value
of perpendicularity (0.134 mm) prone to more tool deflection result chatter and vibration. The tool
with 50o helix angle has the least value (0.015
mm) of perpendicularity for increased feed rate. From the graph 7, it is understood that tool deflection is less for higher helix. At higher feed rates, the tool deflection can be reduced by using the tool with higher helix angle and graph shows an increase in perpendicularity with feedrate
except for 50o (higher) helix angle. Thus higher
helix significantly reduces the side loading and make it possible for peripheral milling with much less deflection. The side cut has the least effect and has negligible effect by spindle speed in aluminium.
3. For surface roughness is concerned, tool with helix
angle 38o has the lowest value of Ra (0.3528) and
tool with helix angle 27o has the highest value of
Ra (12.0426). From the graph 6, it is understood that some improvement in surface finish is obtained by increasing the helix angle. At higher feed rates, better finish is obtained when a larger helix angle is used. The graph shows the increase in Ra value with increase in feed rates. This is due to the increase in the feed per tooth causes the significant rise in surface roughness. Spindle speed have least effect in determining the surface finish of aluminium during milling
4. From figure 5, the perpendicularity can be related
to the cutting force. The perpendicularity increases
with the cutting force for 27o, 38o, 50o helix
angles. Thus perpendicularity can be related to the change in helix angles.
5. From the graph 6 the surface roughness is critical
for 27o helix angle (lower helix angle). This is due
to the fact that for lower helix angle the chip disposal is not easy for aluminium. In lower helix
angle (27o) the flute helically “winds” closely
around the cutter. Due to the gummy nature of aluminum, the chips get stuck in between which affect the surface finish of the workpiece. Thus geometry of the milling cutter surface is one of the predominant parameters that exercise an influence on the quality of the manufacturing process.
REFERENCES
[1] S.Ema and R.Davies, “Cutting Performance of
End Mills with Different Helix Angles”, Science direct, vol 29 No. 2. pp.217--227, 1989.
[2] Raja Izamshah, Yuhazri M.Y, M, Haszley,
M.Amran, and Sivarao Subramonian, “Effects Of Endmill Helix Angle On Accuracy For Machining Thin-Rib Aerospace Component” Scientific.net, vol315.pp.773-777, 2013
[3] Garimella Sridhar, Ramesh Babu P,
“Understanding The Challenges In Machining 0
100 200 300 400 500 600 700 800 900 1000
0 0.02 0.04 0.06 0.08
C
u
tt
in
g
F
o
rc
e
Perpendicularity
0 5 10 15
0 500 1000 1500
S
u
rf
ac
e
R
o
u
g
h
n
es
s
Feed Rate
0 0.02 0.04 0.06 0.08 0.1 0.12 0.14 0.16
0 500 1000 1500
P
er
p
en
d
ic
u
la
ri
ty
Infogain Publication (Infogainpublication.com) ISSN : 2454-1311
Thin-Walled Thin Floored Avionic
Components”, IJASER, vol 2, Nov 1, 2013
[4] Lohithaksha M Maiyar, Dr.R.Ramanujam,
“Optimization of Machining Parameters for End Milling of Inconel 718 Super Ally Using Taguchi Based Grey Relational Analysis” Procedia engineering 64, 2013, pp.1276-1282
[5] M. Zatarain, J. Munoa, T. Insperger, “Analysis
of the Influence of Helix Angle on Chatter Stability” Science direct, June 30 2007
[6] Hasan Gokkaya, Muamer Nalbant, “The effects
of cutting tool geometry and process parameters on the surface roughness of AISI 1030 steel” Science Direct, Materials and design 28, 717-721, 2007
[7] Benjamin Edes, “Helical Tool Geometry in
Stability Predictions and Dynamic Modelling Of Milling” Mospace, May 2007
[8] Julia Hricova “Design of End Mill Geometry for
Aluminium Alloy Machining”, Hricova, 2014
[9] ASM Metals Hand Book vol 16.
[10]Ganesh Babu, Shanmugam, “Analytical
Modelling of Cutting Forces of End Milling Operation on Aluminium Silicon Carbide Particulate Metal Matrix Composite Material Using Response Surface Methodology”ARPN journal of engineering and applied sciences, vol 3, 2008
[11]M. Dogra, V.s Sharma, Dureja, “Effect of Tool