Mining Patterns from 9-1-1 Calls Dataset
Athithyaa Selvam
Department of Computer
Science and Engineering
Sri Venkateswara College of
Engineering
Sriperumbudur
Balasubramanian
Thiagarajan
Department of Computer
Science and Engineering
Sri Venkateswara College of
Engineering
Sriperumbudur
Thivakaran T. K.
Department of Computer
Science and Engineering
Sri Venkateswara College of
Engineering
Sriperumbudur
ABSTRACT
Everybody encounters different kinds of emergency circumstances in their day-to-day life. A 9-1-1 call may be a consequence of a natural disaster, emergency medical need, fire attack, crime or an individual or group of persons needing some form of immediate assistance. Strategy makers are faced with difficult decisions of providing resources to handle these emergencies, and due to lack of data, they face many problems. In this paper, a model is developed using data mining techniques for identifying patterns based on an analysis of the characteristics of 9-1-1 call activity from Montgomery County 9-1-1 calls dataset. This analysis is useful for allocating emergency responders and helps them take proactive steps in their response efforts. The model will also help strategy makers anticipate the occurrences of emergencies and enable them to effectively handle the emergency by appropriate allocation of resources.
General Terms
Data Mining, Pattern Mining
Keywords
Pre-processing, K-means Clustering, Visualization, 9-1-1 Dataset
1.
INTRODUCTION
People face different kinds of emergency situations in their daily life. The emergency situations which pose an immediate risk to life, health, property, and environment require urgent intervention to prevent worsening of the situation. In all countries, the government sets up agencies with a hotline for emergency services that are responsible for emergency planning and management. In the USA, the emergency situations are managed with a 9-1-1 hotline number. A 9-1-1 call from any telephone will link the caller to an emergency dispatch office called as Public-Safety Answering Point. The quickness of the response given to the call depends on the resource and infrastructure availability in the area from where the call originated. The 9-1-1 operations are constrained due to aged hardware and software and lack of reliable data to manage the operations of high volume of calls. Slow response rates to the emergency calls increases the crime rate and it can even can lead to death. If strategy makers are able to comprehend the elements which contribute high volume of 9-1-1 calls, they can implement proactive strategies to provide quick responses. Understanding these factors can guide strategy makers in distributing resources on the basis of need. Every day, the police commanders allocate a limited number of patrol cars to respond to the emergency calls. Patrol cars are assigned to specific geographical sub-divisions of
precincts. In this process, the primary information considered by commanding officers is the overall recent history of crime events and the traditional crime patterns that persist in each geographical area. When good insights are got from this data, patterns can be formed, and the areas with the high crime rates can be found. Accordingly, more police resources can be allocated for such areas. Doing this saves many lives along with a lot of time and effort. Similarly, areas with a high rate of medical emergencies and fire accidents can be found and resources can be allocated accordingly. This study analyses 9-1-1 emergency call data compiled from Montgomery County in Pennsylvania [1]. The study will conduct a hotspot analysis to determine the areas of high call volume and perform spatial analysis to understand factors that contribute these high call volumes and how they influence the calls. The results of the study can help shape strategy making and be a guide to distributing resources to communities fairly.
This paper is organized as follows: Section 2 presents a literature survey on analysis of 9-1-1 calls and resource allocation in emergency situations. Section 3 describes the system architecture and Section 4 details the visualizations of the dataset. Section 5 describes the model and Section 6 shows the results of the model. Section 7 draws conclusions and gives directions for the future work.
2.
RELATED WORK
Initiatives have been taken to analyze the 911 calls and address the problem of allocating resources for 9-1-1 emergency situations. According to Kuhn and Hoey [2], installation of enhanced 9-1-1 systems and comprehensive analysis of the communication division has been used to improve 9-1-1 operations in Washington D.C. This method does not try to understand the problem in order to address it and thus fails to achieve a good solution in all situations. A better approach was taken by Jasso et al. [3], where a multi-linear regression model was proposed to predict the number of calls for a period of time in San Francisco Bay area. In this model, the predictions are used to detect possible emergency events by sounding an alarm when the number of calls exceeds the predicted number of calls. However, when location has to be accounted for, then linear regression has a limitation because it does not account for the variability of a spatial context. Other approaches have been proposed for analyzing 911 call data, such as 9-1-1 call stream analysis [4], spatiotemporal analysis [5, 6], Detection of hotspots [7] and emergency event detection [8].
3.
SYSTEM ARCHITECTURE
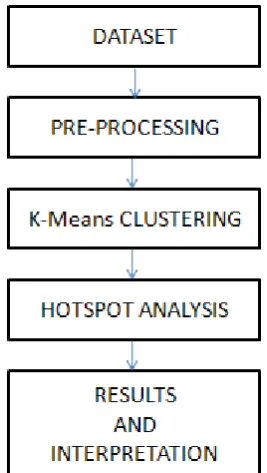
cluster the data set based on attributes. The visual plot of the clustered data is then obtained. Hotspot analysis is done on the dataset along with the superimposition of latitude and longitude plot of the clustered result on Montgomery county map. Recommendations for the reallocation of the emergency service force can be given with the results of Hotspot analysis. The system architecture is shown in figure 1.
Figure 1. Architecture of the System
4.
DATASET PRE-PROCESSING AND
VISUALIZATION
The dataset used in the analysis is the 9-1-1 calls in Montgomery County, Pennsylvania from 12/10/2015 to 10/8/2016. It consists of 116908 calls. The data was already geo-coded with response addresses. The various important attributes of the dataset is shown in Table 1.
The three broad types of calls are:
1. Emergency Medical Services (EMS) – The EMS calls are for various medical emergencies and crimes.
2. Fire – These are calls for fire related accidents. 3. Traffic – These are calls for vehicle accidents and
road emergencies.
The dataset was loaded and pre-processed. The pre-processed data was then analyzed using clustering data mining technique. The output of the analyzed data is then visualized.
4.1
Area wise Visualization
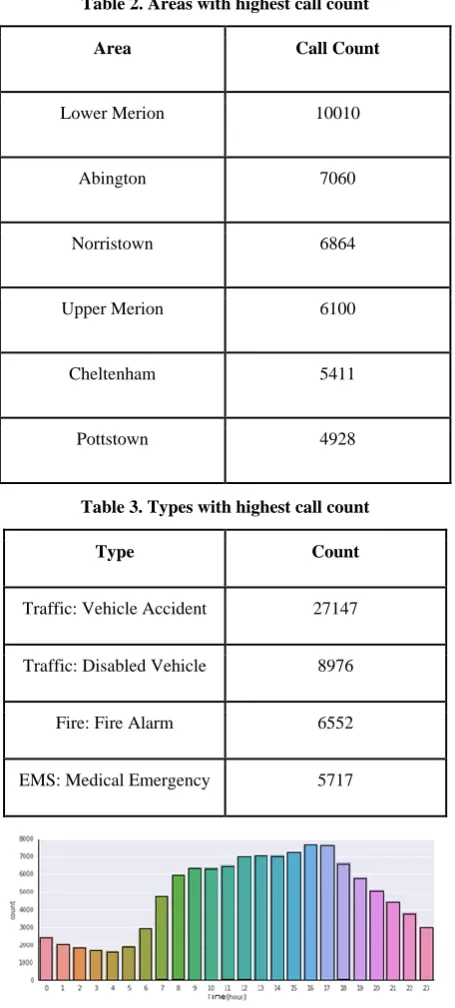
The results of the area wise visualization is shown in figure 2. It is a bar-graph with the Area in x-axis and Call Count in the y-axis. The areas which have the 6 highest call counts are shown in Table 2.
4.2
Call-Type wise Visualization
The results of call-type wise Visualization is shown in figure 3. The type is in x-axis and the count is in y-axis of the bar graph. The types which have highest call count are shown in
Table 3. It can be seen that Traffic: Vehicle accidents have the highest 9-1-1 call count. The total number of calls in EMS was 57529, Fire was 17582, and Traffic was 41796.
Table 1. Attributes Of The Dataset
Figure 2. Visualization of Area based on Count of Incidents
4.3
Time wise Visualization
The results of time wise visualization is shown in figure 4. It can be seen that most of the calls occur between the time period 12:00 hrs. and 18:00 hrs.
Figure 3. Visualization of Types based on Count of Incidents
Variable name
Description
Latitude The Latitude of the call location.
Longitude The Longitude of the call location.
Description Description of the call
Zip Zip code of the call location
Call Type The type of 911 call
Time Stamp Time stamp of the call
Area Area where the call originated
Table 2. Areas with highest call count
Area Call Count
Lower Merion 10010
Abington 7060
Norristown 6864
Upper Merion 6100
Cheltenham 5411
Pottstown 4928
Table 3. Types with highest call count
Type Count
Traffic: Vehicle Accident 27147
Traffic: Disabled Vehicle 8976
Fire: Fire Alarm 6552
EMS: Medical Emergency 5717
Figure 4. Time wise visualization
5.
DATA MINING MODEL
5.1
K-Means Clustering
Clustering is a process of partitioning a set of data (or objects) into a set of meaningful sub-classes, called clusters. Dataset is clustered in order to extract patterns from it. In this paper, K-means clustering algorithm is used for clustering the dataset. ALGORITHM:
function K-means()
Initialize k prototypes (w1,...,wk) such that wj = il,
𝑗 ∈ 1, … … 𝑘 , 𝑙 ∈ {1, … . 𝑛}
Each cluster Cj is associated with prototype wj
Repeat
for each input vector il, where l ∈ {1,….,n}
do
Assign il to the cluster Cj* with nearest prototype wj* (i.e.) 𝑖𝑙 − 𝑤𝑗 ∗ ≤ 𝑖𝑙 − 𝑤𝑗 , 𝑗 ∈ {1, … . 𝑘}
for each cluster Cj, where 𝑗 ∈ {1, … , 𝑘},
do
Update the prototype wj to be the centroid of all samples currently in Cj, so that wj = 𝑖𝑙/ 𝐶𝑗
Compute the error function:
𝐸 =
𝑘𝑗 =1 𝑖𝑙∈𝑐𝑗𝑖
𝑙− 𝑤
𝑗 2Until E does not change significantly or cluster membership
no longer changes.
5.2
Hotspot Analysis
Hot Spot Analysis is a spatial cluster detection method which identifies statistically significant spatial concentrations of the high and of low values associated with a set of geographic features. The Hot Spot Analysis tool in Arc GIS [9] uses the Getis-Ord Gi* algorithm. The outcome from the Hot Spot Analysis tool is a Z score and p-value for each feature. The higher the Z score, the more intense the clustering. A Z score near zero indicates no apparent spatial clustering. The Z score is based on the Randomization Null -Hypothesis computation. The Getis-Ord local statistic is given as:
𝐺𝑖∗= 𝑤𝑖,𝑗𝑥𝑗 𝑛
𝑗 =1 − 𝑋 𝑛𝑗 =1𝑤𝑖,𝑗
𝑆 𝑛 𝑤𝑖,𝑗
2− 𝑤
𝑖,𝑗 𝑛 𝑗 =1
2 𝑛
𝑗 =1 𝑛 −1
(1)
Where xj is the attribute value for feature j, wi,j is the spatial weight between feature i and j, n is equal to the total number of features and:
𝑋 = 𝑥𝑗 𝑛 𝑗 =1
𝑛 (2)
𝑆 = 𝑥 2 𝑛 𝑗 =1
𝑛 − 𝑋 2 (3)
The Gi statistic is a z-score so no further calculations are required. The Hot Spot Analysis tool calculates the Getis-Ord Gi* statistic for every feature in the dataset. The resultant Z score shows where features with either high or low values cluster spatially. This tool works by monitoring each feature within the context of neighboring features. To be a statistically significant hot spot, a feature will have a high value and be surrounded by other features with high values. The local sum for a feature and its neighbors is equated proportionally to the sum of all features. The p-values are numerical approximations of the area under the curve for a known distribution and they are limited by the test statistic. The equations associated with hotspot analysis are given by equations (1), (2), (3).
5.2.1
Interpretation
(hot spot). For statistically significant negative Z scores, the smaller the Z score is, the more acute the clustering of low values (cold spot).
Figure 5. Clustering result
6.
RESULTS AND DISCUSSION
The result of clustering process is shown in figure 5. The clustering output was used to generate heat maps of calls by month, day and hour, shown in figure 6.
Figure 6. Heat map of Calls by hour and day It can be seen that the maximum number of calls in a day is between 08:00 hrs. – 18:00 hrs. and the highest number of calls in a month is recorded between the days 22-26. This conclusion obtained from figure 6 is justified with the plot in figure 7.
Figure 7. Heat map of calls by month and day Figure 8 shows the count of calls of different sub-types in major areas in Montgomery County. A few important results
of sub-types which have a high call count are seen in the figure.
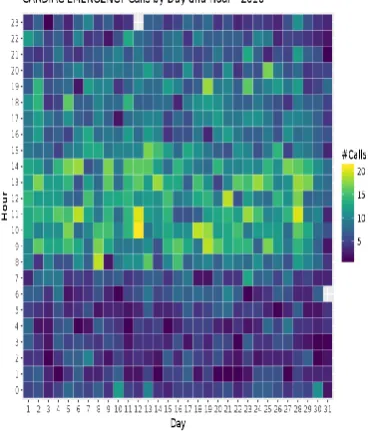
Figure 8. Area wise count of various sub types Vehicle accidents are high among all the townships which is very concerning given the number of lives at risk during each accident. Figure 9 shows the vehicle accident call count by day and hour.
Figure 10. Cardiac Emergency Calls by day and hour Hotspot analysis was done to determine areas of high and low concentrations of calls. The hotspot analysis showed the concentrations of 9-1-1 calls. This is particularly important because if the areas having high concentration of calls can be determined, then the resources can be accordingly allocated towards responding to emergencies. For example, the response center in the northeast region of the map has statistically significant cold spots around it, while the center in the southeast region of the map has a large amount of statistically significant hot spots. More resources could be sent to the call centers with high call volume for improving the response time. The result of the hotspot analysis is shown in figure 11.
The average 9-1-1 call response time for Montgomery County Police Department, Maryland was 7.46 minutes [10] as of June 2016. According to Police response time performance audit for the city and county of Denver [11], the average response time for a 9-1-1 call has increased from 11.4 minutes to 14.3 minutes in 2013.
Figure 11. The map of Montgomery County and its 9-1-1 Hotspot map
This response time can be reduced by efficient planning of resource allocation using the results got above i.e., more resources can be allocated for the areas/regions with a high number of emergency calls.
7.
CONCLUSION
This paper provides the results of a model which analyses a 9-1-1 emergency calls dataset. The analysis attempts to determine hot spots of 9-1-1 calls and the factors that influence them. There are various types of possible actions that could follow up the results that were found in this analysis. This can help shape strategy making, be a guide to distributing the fire, medical and police resources to communities fairly and save majority of lives by decreasing the response time for the 9-1-1 calls. The main limitation on this model was the spatial and temporal aspects of the data. The data was only for Montgomery County, Pennsylvania, and only from 10 months of collection. A bigger dataset over a larger area and a larger period of time could probably lead to different results. Moreover, since the dataset is relatively small, applying the model across other areas may not lead to an accurate result.
In the future, if a bigger dataset of 9-1-1 calls is available, more accurate patterns and insights can be got from the dataset and a better model can be developed.
8.
REFERENCES
[1] Montgomery County, PA: 911 Calls [Online]Available: https://www.kaggle.com/mchirico/montcoalert
[2] Kuhn, P., Hoey, T.P., Improving 911 police operation Washington, D.C. National Productivity, pp. 125-130, 1987
[3] Jasso, H., Fountai, T., Baru, C., Hodgkiss, W., Reich, D., Warner, K., “Prediction of 9-1-1 call volumes for emergency event detection,” Proc. of the 8th Annual Int. Conf. on Digital Government Research: Bridging Disciplines & Domains, pp. 148-154, ACM , 2007 [4] Hodgkiss, W., Baru, C., Fountain, T.R., Reich, D.,
Warner, K., Glasscock, M., “Spatiotemporal analysis of 9-1-1 call stream data,” Proceedings of the 2005 National Conference on Digital government research, pp. 293-294. Digital Government Society of North America, 2005
[5] Jasso, H., Hodgkiss, W., Baru, C., Fountain, T., Reich, D., Warner, K., “Spatiotemporal characteristics of 9-1-1 emergency call hotspots,” Proceedings of the National Science Foundation Symposium on Next Generation of Data Mining and Cyber-Enabled Discovery for Innovation (NGDM'07), Baltimore, Maryland, Oct 10-12, 2007
[6] Jasso, H., Hodgkiss, W., Baru, C., Fountain, T., Reich, D., Warner, K., “Spatiotemporal analysis of 9-1-1 call stream data,” Proceedings of the 7th Annual International Digital Government Research Conference, San Diego, California, May 21-24, 2006
[8] Jasso, H., Baru, C., Fountain, T., Hodgkiss, W. , Reich, D., Warner, K., “Using 9-1-1 call data and the space-time permutation scan statistic for emergency event detection,” Proceedings of the 2008 International Conference on Digital government research, Montreal, Canada, May 18-21, 2008
[9] Hot Spot Analysis (Getis-Ord Gi*) [Online]Available: http://resources.esri.com/help/9.3/arcgisengine/java/gp_t oolref/spatial_statistics_tools/hot_spot_analysis_getis_or d_gi_star_spatial_statistics_.htm
[10]Montgomery County Police Department (MCPD), Average emergency 911 call response time, June 2016 [Online]Available:
https://reports.data.montgomerycountymd.gov/stat/goals/ qucz-i7xn/vkh3-qxu6/aiwx-jr7x
[11]Police Response Time Performance Audit, June 2014 [Online]Available: