www.astrophys-space-sci-trans.net/7/419/2011/ doi:10.5194/astra-7-419-2011
© Author(s) 2011. CC Attribution 3.0 License. Astrophysics and Space Sciences
Transactions
Lower limits on the lifetime of massive neutrino radiative decay
from the 2006 total solar eclipse
V. Popa
Institute for Space Sciences, R-77125, Bucharest - M˘agurele, Romania
Received: 14 November 2010 – Revised: 2 March 2011 – Accepted: 10 April 2011 – Published: 22 September 2011
Abstract. We report on the search for signatures of
possi-ble neutrino radiative decays, in occasion of the 2006 total solar eclipse (TSE). The lower lifetime limits obtained in the hypothesis of normal mass hierarchy (m3m2> m1) are about 3 orders of magnitude better than the previous re-sults. The inverted mass hierarchy scenario (m2> m1m3) is also investigated. The reached sensitivity suggests that the limits presented here are the best obtainable using this technique.
1 Introduction
The evidence of neutrino oscillations implies that neutrinos have non-vanishing masses, and that neutrino flavor eigen-states are superpositions of mass eigeneigen-states. The Sun is a very strong source ofνeneutrinos; the expected flux at Earth (neglecting oscillation effects) is 8'7×1010cm−2s−1. The SNO result (Ahmad et al., 2002) demonstrate that a frac-tion of this flux reaches the Earth as neutrinos of different fla-vors thanνe. In the two generation approximation, this lead to1m21,2=6×10⁻⁵eV2, corresponding toν
e↔νµ oscil-lations. A more refined approach, considering all 3 neutrino generations, yields1m21,2=7.65×10⁻⁵eV2(Schwetz et al., 2010); we estimate that the effect of this update on the life-time limits presented in this paper is less than 1%. Returning to the simplified 2 generation approach, the radiative tran-sition between the neutrino mass eigenstates composing the electron neutrino is allowed (νH→νL+γ, whereνH stands for the heavier component andνL for the lighter one), and some of the emitted photons could appear (in the observer frame) as visible. The existing very stringent limits on the neutrino magnetic moment,µν<1.3×10⁻¹⁰µB(Amsler et
Correspondence to: V. Popa
al., 2008) refer only to the neutrino flavor eigenstates; fur-thermore, exotic decay mechanisms cannot be excluded.
Direct searches for radiative (anti)-neutrino decays were performed in the vicinity of nuclear reactors (e.g. Bouchez et al., 1988, yielding limits betweenτ0/m >10−8s/eV and τ0/m >0.1 s/eV, for 1m/m between 10−7 and 0.1); the Borexino Counting Test Facility at Gran Sasso yielded limits at the level ofτ0/m∼103s/eV (Derbin and Smirnov, 2002). Very strong limits were inferred from cosmological or as-trophysical considerations, but such limits are indirect and rather speculative. Some of them are shortly reviewed in Cecchini et al. (2011).
In a pioneering experiment performed in occasion of the 24 October 1995 TSE, a search was made for visible photons emitted through radiative decays of solar neutrinos during their flight between the Moon and the Earth (Birnbaum et al., 1997). The authors assumed that neutrinos have masses of the order of few eV,1m212'10−5eV2, an energy of 860 keV and that all decays yield visible photons, which travel nearly in the same direction as the parent neutrinos. From the ab-sence of a positive signal they estimated a lower limit onτ0 (97 s) which, in view of the assumptions made, is now not reliable.
Another search for solar neutrino radiative decays was made during the 21 June 2002 TSE, in Zambia (Cecchini et al., 2004b). The proper lower time limits (95% C.L.) ob-tained for theν2→ν1+γ decays of left-handed neutrinos ranged fromτ0/m2'10 to'109s/eV, for 10−3eV< m1< 0.1 eV.
Fig. 1. One of the frames recorded during the totality. The center of the image corresponds to the position of the center of the Sun behind the Moon. (From (Cecchini et al., 2011))
2 The experiment
The total solar eclipse of 29 March 2006 was observed from a campus in the Southern Libyan Sahara (17.960◦E longitude, 24.496◦N latitude and 465 m altitude) with a Matsukov-Cassegrain telescope (8=235 mm,f =2350 mm) equipped with a fast 16 bit Mx916 CCD camera.
The night before the eclipse we aligned the system, ad-justed the focus and took calibration images of some standard luminosity stars (SAO99215 and SAO99802). The photo-metric analysis showed that an acquisition digital unit (ADU) corresponds to 6.1±0.1 photons.
The telescope movement was set to follow the Sun in order to have always the center of the acquired images coincident with the Sun center. We implemented a special CCD expo-sure algorithm in order to adapt the expoexpo-sure times to the luminosity level of the Moon image. The ashen light (the Sun’s light reflected by the Earth back to the Moon) is one of the main background sources, but allows the reconstruction, frame by frame, of the real position of the Sun behind the Moon, eliminating the risk of pointing errors. More techni-cal details are described in Cecchini et al. (2011).
The data collected consist in 212 digital pictures of the central part of the “dark” disk of the Moon. Each image pixel covers a solid angle of 1.99”×1.95”. The analysis is based on the wavelet decomposition of the images; we selected only the central largest dyadic square from each frame (256×256 square pixels); the total coverage was 8.490×8.320(the Moon apparent diameter is 310).
Figure 1 shows one of the frames recorded during the to-tality phase; details on the Moon surface seen in the ashen light are clearly visible.
3 Monte Carlo simulations
The analysis of the data obtained by this experiment required a detailed Monte Carlo simulation, including the neutrino production in the solar core, its propagation, decay, and the photon detection on Earth. Such a code was developed for the analysis of the data collected during the 2001 eclipse and was adapted to the conditions of the 2006 observations. The model is described in detail in Cecchini et al. (2004a).
Solar neutrino production was simulated according to the “BP2000” Standard Solar Model (SSM) (Bahcall et al., 2001). We chose a specific reaction/decay yielding neutri-nos (both from the p–p and the CNO cycles); the neutrino energy and the position of its production point in the core of the Sun were generated according to the SSM. As we are interested only in neutrinos that could undergo radiative de-cays between the area of the Moon seen by our experiment and the Earth, a decay point was generated and the arrival direction of the decay photon was chosen. Once the geom-etry of the event is known, the photon energy is computed taking into account the Lorentz boost, and for visible pho-tons the probability density of the angular distribution, de-pending on whether the neutrino is a Dirac neutrino, left or right-handed, or a Majorana neutrino. The number of visible photons is about 5·10−4of the total spectrum; this quantity is integrated over all directions accessed by the instrument aperture.
The interpretation of the solar neutrino oscillation data in the simplest two flavor model (assuming that the elec-tron neutrinoνe is just the superposition of two mass eigen-statesν1andν2) yields a square mass difference of1m21,2= 6×10⁻⁵eV2 (Ahmad et al., 2002). This mass difference was used in simulating the possible ν2→ν1+γ decays. There is also the possibility of a more complex scenario, assuming a mixing between all 3 mass eigenstates. Since 1m21,3'1m22,3=2.4×10⁻³eV2 (as known from atmo-spheric neutrino (Ambrosio et al, 2004; Ashie et al., 2005) and long baseline oscillation experiments (Adamson et al., 2008)), theν3→ν2+γ and theν3→ν1+γ decays should be similar.
The simulation yields the probabilities that the emitted photon is in the visible bandwidth. They are obtained in the a priori assumption that heavier neutrino mass eigenstates un-dergo radiative decays in the space between the Moon and the Earth, and the photon reaches the detector.
1 10 102 103 104 105 106 107 108 109 1010
10-4 10-3 10-2 10-1
1 10 102 103 104 105 106 107 108 109 1010
10-4 10-3 10-2 10-1
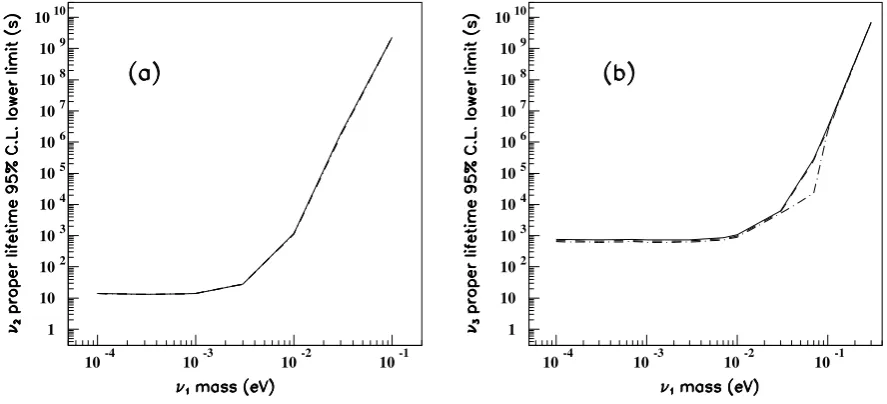
Fig. 2. (a): 95% C.L. lower limits for theν2proper lifetime, assuming normal hierarchy. The differences between different polarization states cannot be seen at this scale. (b): 95% C.L. lower limits for theν3proper lifetime, assuming sin2θ13=0.1 and normal mass hierarchy. The graphs correspond from up to down to lefthanded, Majorana and righthanded neutrinos. (from Cecchini et al., 2011)
in theν2decay is much smaller than in theν3case; the pho-ton energy is boosted in the visible spectrum for directions along the direction of the parent neutrino. For theν3decay the condition is satisfied for photons emitted at larger angles. The above discussion assumes the normal neutrino mass hierarchy; as the only input for the simulation related to neu-trinos is one of the mass values, the mass differences and the polarity, the Monte Carlo results are independent on the hierarchy scenario.
4 Data analysis and results
The search for theν2→ν1+γ and theν3→ν1,2+γ signa-tures from the frames recorded during the 2006 TSE is based on the analysis of the superposition of 195 good quality im-ages similar to Fig. 1. As the imim-ages are aligned with respect to the position of the Sun behind the Moon, most of the Moon scape details in Fig. 1 are washed off. The obtained image was analyzed using the wavelet decomposition, in the simple Haar basis. Then-order term of the decomposition is ob-tained by dividing theN×N pixels2image in square fields ofN/2n×N/2npixels2and averaging the luminosity in each field; the averages are then removed and the resulting image, then-order residual, can be used to obtain the(n+1)-order term. Thus, each decomposition term results in an image that enhances the contrast of the objects on the correspond-ing scale, while the residuals contain information for smaller dimension scales.
The decay signal is searched for by averaging the lumi-nosity of the images over “rings” concentric to the position of the center of the Sun. As the wavelet analysis requires a
dyadic dimension of the field (the number of pixels on each border have to be an integer power of 2), there is no “cen-tral pixel”, so we have considered the four pixels adjacent to the image center as “central” and then averaged the obtained luminosity profiles.
The used image has 256×256 pixels2, so we could go as far as the 7t horder in the wavelet decomposition. None of the image decomposition terms or residuals show structures as would be expected from solar neutrino radiative decays; thus we might infer that a possible signal cannot be larger than the statistical fluctuations.
4.1 Lifetime limits in the normal mass hierarchy hy-pothesis
The expected scale of the decay signal (few tens of seconds of arc) suggest that the wavelet term most sensitive to the ν2→ν1+γ andν3→ν1,2+γ decays should be the 5t h or-der, with a typical scale of about 16”. The number of visible photons originating from solar neutrino radiative decays that could be recorded by the telescope CCD may be computed as
Nγ=P 8(2,3)SMtobs
1−e
htMEi
τ
e− tSM
τ(2,3), (1)
whereP are the mass-dependent Monte Carlo probabilities and8(2,3)represents the flux ofν2orν3solar neutrino com-ponents at the Earth level
82=8νsin2θ12 83=8νsin2θ13,
104 105 106 107 108 109 1010
10-2 10-1
104 105 106 107 108 109 1010
10-2 10-1
105 106 107 108 109 1010
10-2 10-1
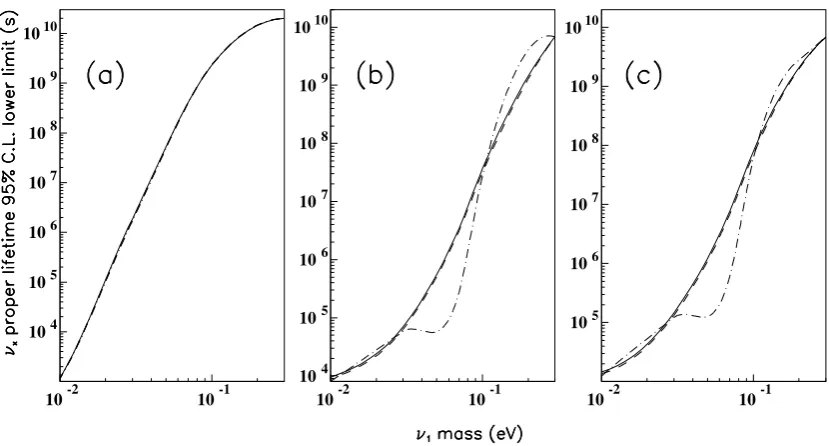
Fig. 3. (a): 95% C.L. lower limits for theν2→ν1+γ proper lifetime, assuming inverted hierarchy. The differences between different polarization states cannot be seen at this scale. (b): 95% C.L. lower limits for theν2→ν3+γ proper lifetime, assuming inverse mass hierarchy. The graphs correspond lefthanded (solid line), Majorana (dashed line) and righthanded (dot-dashed line) neutrinos. (c): 95% C.L. lower limits for theν1→ν3+γproper lifetime, assuming inverse mass hierarchy. The lines follow the same convention as in (b).
mixing angle determined from oscillation experiments (the vacuum solution) in the two flavor approximation. The pre-ferred solar neutrino oscillation solution assumes the matter enhancement effects, that dramatically alter the value ofθ12 in the solar interior, but our experiment is sensitive only to possible decays occurring between the Moon and the Earth, thus we use the vacuum value ofθ12.At this time the mix-ingθ13is unknown; in our calculations sin2θ13we arbitrarily used sin2θ13=0.1. If θ13=0, the corresponding lifetime lower limits are meaningless; the lower the value ofθ13, the lower the resulting limits would be.
In Eq. (1)SM is the area on the Moon surface covered by our observations,tobs is the total acquisition time, htMEiis the average travel time of the neutrinos from the Moon to the Earth (assuming that the decay point is uniformly distributed on that distancehtMEiis one third of the flying time),tSM is the flight time from the Sun to the Moon andτ(2,3) the lifetime of theν2 andν3 neutrino mass higher states. All time variables in Eq. (1) are defined in the laboratory frame of reference.
As no structure compatible with one of the two radiative neutrino decay hypotheses were found in our analysis, we can extract only lower limits for the lifetimes of the heavy neutrino components. We assume that the number of photons produced trough radiative decays between the Moon and the Earth reaching our detector should beNγ≤3σT5, whereσT5 is the standard deviation of the luminosity of the 5t hterm in the wavelet decomposition of the data. The 95% C.L. lower limits for theν2proper lifetimes are shown in Fig. 2(a).
Al-though they were computed assuming three possibleν2 po-larizations, the results are so close that they cannot be sepa-rated on the graph. For theν3proper lifetimes, the tentative 95% C.L. upper limits (computed assuming sin2θ13=0.1) are shown in Fig. 2(b). The solid line corresponds to left-handed Dirac neutrinos, the dash-dotted line to Majorana neutrinos and the dashed line to righthanded Dirac neutrinos. Note that in this case,ν1represents the lowest mass neutrino state.
4.2 Lifetime limits in the inverted mass hierarchy hypothesis
As already mentioned, the Monte Carlo output is indepen-dent on the hierarchy hypothesis, so lifetime limits may be computed for the inverted hierarchy just permutating the in-dexes in Eq. (1) and restricting the mass range ofν1to larger values. Furthermore, as the lowest mass neutrino state is now ν3, the results are no more dependent on the unknown mix-ingθ13. Limits for theν2radiative decays may be obtained directly using Eq. (1). The resulting 95% C.L. lower lifetime for theν2→ν1+γ andν2→ν3+γ decays are shown in Fig. 3(a) and, respectively, 3(b). For theν1→ν3+γ pro-cess, Eq. (1) should be modified by adding to 81 the sur-viving component ofν1neutrinos produced troughν2decays between the Sun and the Moon:
82·
1−e−τtSM2→1
e−
htSMi
The very large values ofτ2→1(between 109and 1016s in the laboratory frame) make this correction negligible. For the same reason we neglect the enhancements effects during the crossing of the solar matter. The resulting 95% C.L. lower limits are shown in Fig. 3(c).
5 Conclusions
The analysis of the 195 frames recorded in occasion of the 26 March 2006 total solar eclipse did not evidence signals compatible with the Monte Carlo predictions for the radiative decays of the heavier components of the solar neutrinos.
In the normal mass hierarchy hypothesis (m3m2> m1), we obtained lower lifetime limits for theν2→ν1+γ and ν3→ν2,1+γ decays about 3 orders of magnitude better than the similar results published by Cecchini et al. (2004b). The new limits are in the range 10÷109s, for neutrino masses 10−4< mν1<0.1 eV. In the inverted hierarchy sce-nario (m2> m1m3) we find similar lifetime limits for the corresponding possible decays, and neutrino masses 10−3< mν1<0.3 eV.
The clear detection of the ashen light combined with the negative result, demonstrate that the searched signal should be fainter than the ashen light itself; thus the limits presented in this paper are the best obtainable using this technique, since there is no way to avoid the ashen light background. Acknowledgements. The author acknowledges the essential contri-bution of his colleagues and friends to the experiment, simulation and data analysis: S. Cecchini, D. Centomo, G. Giacomelli, R. Giacomelli, M. Giorgini, L. Patrizii, and C. G. S¸erb˘anut¸. The experiment was founded by the University and INFN Section of Bologna. We acknowledge also the support from the Ital-ian Institute of Culture of Tripoli. The analysis was partially founded under CNCSIS Contract 539/2009. Special thanks are due to the referees of the first version of this paper for their competent and constructive observations. Last but not least, the author thanks the organizers of the 2010 ECRS, Turku, Finland, for the excellent and stimulating atmosphere during the symposium.
Edited by: K.-H. Kampert
Reviewed by: two anonymous referees
References
Adamson, P. et al. (MINOS Coll.): Search for active neutrino disap-pearance using neutral-current interactions in the MINOS long-baseline experiment., Phys. Rev. Lett., 101, 131802, 2008. Ahmad, Q. R. et al. (SNO Coll.): Measurement of day and night
neutrino energy spectra at SNO and constraints on neutrino mix-ing parameters, Phys. Rev. Lett., 89, 011302, 2002.
Ambrosio, M. et al. (MACRO Coll.): Measurements of atmospheric muon neutrino oscillations, global analysis of the data collected with MACRO detector, Eur. Phys. J., 36, 323–339, 2004. Amsler, C. et al. (Particle Data Group): Review of particle
proper-ties, Phys. Lett. B, 667, 1, 2008.
Ashie, Y. et al. (SuperK Coll.): A Measurement of atmospheric neu-trino oscillation parameters by SUPER-KAMIOKANDE I, Phys. Rev., 71, 112005, 2005.
Bahcall, J. N., Pinsonneault, M. H., and Basu, S.: Solar models: Current epoch and time dependences, neutrinos, and helioseis-mological properties, Astrophys. J., 555, 990–1012, 2001. Birnbaum, C. D., Foussard, P., Schwemling, P., and Vanucci, F.: An
experimental limit on radiative decays of solar neutrinos, Phys. Lett. B, 397, 143–146, 1997.
Bouchez, B., Pichard, B., Soirat, J. P. et al.: New experimental limits on radiative neutrino decay, Phys. Lett. B, 207, 217–221, 1988.
Cecchini, S., Centomo, D., Giacomelli, G. et al.: Monte Carlo sim-ulation of an experiment looking for radiative solar neutrino de-cays, Astropart. Phys., 21, 35–43, 2004a.
Cecchini, S., Centomo, D., Giacomelli, G. et al.: Search for possi-ble neutrino radiative decays during the 2001 total solar eclipse, Astropart. Phys., 21, 183–194, 2004b.
Cecchini, S., Centomo, D., Giacomelli, G. et al.: New lower lim-its on the lifetime of heavy neutrino radiative decay, Astropart. Phys., 34, 486–492, 2011.
Derbin, A. V. and Smirnov, O. Ju.: Search for neutrino radiative decay with a prototype Borexino detector, JETP Lett., 76, 409– 413 2002.