RESEARCH ARTICLE
TRENDS OF GROUNDWATER HYDROLOGY IN COASTAL REGIONS OF CHENNAI
*1
Annapoorani, A.,
2Murugesan, A.,
3Ramu, A. and
4Renganathan, N. G.
1
Department of Chemistry, Sakthi Mariamman Engineering College, Chennai-602 105
2
Department of Chemistry, Sriram Engineering College, Perumalpattu, Veppampattu RS, Chennai-602 024
3
School of Chemistry, Madurai Kamaraj University, Madurai – 625 021
4
Department of Chemistry, Vel Tech Dr RR, Dr SR Technical University, Avadi, Chennai – 600 062
ARTICLE INFO
ABSTRACT
Groundwater analysis is carried out to identify the quality of groundwater due to increase in population, industrial growth in Chennai city. Intrusion of seawater was determined using hydro geochemical ions to know the origin of salinity in the coastal areas of Chennai city. Samples were collected monthly in the year of 2012 from the coastal areas of Chennai city and analyzed. The distribution of ions indicates that variation of sodium and chloride are more towards the seashore and calcium and bicarbonate are dominating ions in the interior part of the Chennai city. Gibbs plot indicates that evaporation is the dominating process towards the coastal areas. Piper diagram indicates that field I and II were the dominating faces. Integrated GIS Analysis was assessed to determine the quality of water and intrusion of seawater based on ionic ratio.
Copyright © 2014 Annapoorani et al.This is an open access article distributed under the Creative Commons Attribution License, which permits unrestricted use,
distribution, and reproduction in any medium, provided the original work is properly cited.
INTRODUCTION
In rural and urban area the groundwater is an important source for the drinking, agricultural and industrial usage. Usage of groundwater decreases due to the contamination and pollution occurred in the surface water due to increase in population as well as industries. Due to increase in population, there is an excess withdrawal of groundwater, which leads to the intrusion of salt water or anthropogenic activity. Groundwater is the main source for drinking in urban cities, but it suffers
from the intrusion of salt water (Mondal et al., 2010).
Resources of groundwater quality in coastal aquifers had been
reported (Rajmohan et al., 2000; Senthilkumar et al., 2008;
Pujari and Soni 2009). Groundwater quality assessment and correlation of ions in Kancheepuram District had been
reported (N.RajMohan et al., 1999, C.SivaKumar et al., 2008).
Intrusion of salt water in Sadras city had been reported by
(N.C.Modal et al., 2011)
Study Area
In India, the Chennai is the fourth largest metropolitan city in
the world and 3rd largest commercial and industrial centre in
*Corresponding author: Annapoorani, A.,
Department of Chemistry, Sakthi Mariamman Engineering College, Chennai-602 105
India. Variation in seasonal temperature is not possible due to coastal predominance and it lies on the thermal equator. Chennai occupies the northeast part of Tamil Nadu and lies on the coastal region of Bay of Bengal and it is altitude of 8 meters from the sea level. Adyar river and Coovum river flows through the Chennai city and both of them are connected by the Bay of Bengal. Sewage of Chennai city is pumping into the Coovum river, Adyar river, Buckingham canal and Otteri Nalla.
MATERIALS AND METHODS
Samples were collected from bore wells in pre-cleaned polythene bottles from the sampling locations. The 21 water samples were collected from 21 places for every month and it is presented as the average of three months (Post Monsoon, Summer, Pre Monsoon and Winter) in Chennai city 2012. AR grade chemicals and double distilled water were used to carry out the analysis. EC, pH and TDS parameters were measured in situ. Chloride, carbonate, bicarbonate, hardness, Sodium, Potassium, Calcium, Magnesium, Sulphate were measured. The study area map and spatial variation was done using GIS (Geographical Information System). The countor had been drawn using Arc GIS 10.2. Aquachem is a software developed for graphical and numerical analysis. we are using Piper Diagram to charecteristics the quality of water and to analysis
ISSN: 0976-3376
Vol. 5, Issue 11, pp.655-660, November, 2014Asian Journal of Science and TechnologySCIENCE AND TECHNOLOGY
Article History:
Received 23rd August, 2014
Received in revised form 11th September, 2014 Accepted 30th October, 2014
Published online 19th November, 2014
Key words:
Integrated GIS Analysis, Ionic ratio,
which anion and cation is dominating one and responsible for the quality of the water. Geography is important to human beings. Spatial variation is very important day to day life, so they developed a tools called geographic information system (GIS) helped us to know our geographic knowledge. It is possible in GIS to integrate different kinds of geographic information using GPS along with the data of water quality.
RESULTS AND DISCUSSION
According to WHO standards TDS up to 500 ppm is the highest desirable and up to 1500 ppm is maximum permissible. In the study area minimum TDS recorded is 693ppm (SC17). In post monsoon the 4 sample sites can be used for drinking purpose, but in winter except one other samples cannot be used for drinking purpose, but in pre monsoon and summer, there were no samples under the limit. Sawyer and McCurty (1967) classified groundwater, based on total hardness, 10% of ground water samples are moderately hard in post monsoon; winter, per monsoon and 20% of ground water samples are moderately hard in summer. 45% of ground water samples are hard in post monsoon and winter. 55% of ground water samples are hard in per monsoon and 65% of groundwater samples are hard in summer. Calcium and magnesium ion content starts decreasing from post monsoon till pre monsoon but increases in summer. The concentration of sodium increases from post monsoon till winter after that it starts decreases except SC6, SC18 where sodium content is very less below 300ppm.
Concentration of potassium is lower than Ca, Mg, Na. Permissible limit in drinking water is less 12ppm as reported by WHO. The chloride concentration in all the seasons varies from 130 to 20,717 in post monsoon; it is further increase in summer and pre monsoon and further decrease in winter. According to WHO standards only three sampling sites exceed the maximum allowable limit of sulphate (>400ppm). According to the WHO standards, the nitrate concentration varies within the maximum allowable limit (50 ppm). Variation of carbonate ions in the samples is negligible. According to WHO standards variation of Fluoride also within the maximum allowable limits (1.5 ppm). Variation of bicarbonate for all the four seasons according to WHO standards, it exceeds the most desirable limit.
Gibbs and Piper Diagram
The ratio of Na+/Na++Ca2+ and Cl-/Cl-+HCO3- varied as a
function of TDS which is used to determine which process is dominating one
1. Precipitation-dominance 2. Rock-dominance 3. Evaporation-dominance
In our study area evaporation is the dominating process in all the seasons indicating that intrusion of salt water in the coastal areas of Chennai city and it is shown in Fig 1. The position of this plotting indicates the relative composition of groundwater
0.0 0.1 0.2 0.3 0.4 0.5 0.6 0.7 0.8 0.9 1.0 1.1
1 10 100 1000 10000 Precipitation
Rock Water Interaction Evapouration T O T A L D IS S O L V E D S O L ID S (P P M ) CHLORIDE/CHLORIDE+BICARBONATE
0.3 0.4 0.5 0.6 0.7 0.8 0.9 1.0
1 10 100 1000 10000 Precipitation
Rock Water Interaction Evaporation T D S (P P M ) Na+K/Na+K+Ca Post Monsoon
0.0 0.1 0.2 0.3 0.4 0.5 0.6 0.7 0.8 0.9 1.0 1.1
1 10 100 1000 10000 Precipitation
Rock Water Interaction Evapouration T O T A L D IS S O L V E D S O L ID S (P P M ) CHLORIDE/CHLORIDE+BICARBONATE
0.3 0.4 0.5 0.6 0.7 0.8 0.9 1.0
1 10 100 1000 10000 Precipitation
in terms of the cation-anion pairs that correspond to four vertices of the field. The geochemical evolution can be understood from the piper plot which has been divided into six subfields,
1. Ca-HCO3 type
2. Na-Cl type
3. Mixed Ca-Na-HCO3 type
4. Mixed Ca-Mg-Cl type
5. Ca-Cl type
6. Na-HCO3 type
Maximum samples in Post Monsoon fall in the field of 6 & 4 which indicates majority of the samples are concentrated in the
Mixed Ca-Na-HCO3 type and Na-HCO3 type. In winter fall in
the field of 2 & 4 which indicates majority of the samples are concentrated in the Na-Cl type and mixed Ca-Mg-Cl type. Maximum Samples in Pre Monsoon and winter fall in the field of 2 which indicates majority of the samples are concentrated in the Na-Cl type, which is the field 2, due to the saline nature in the groundwater. Strong quality fluctuations are induced mainly by cyclic atmospheric and biological changes to a very
stable water quality. The abundance of alkali metals (Na++K+)
and the distribution of alkaline earth metals [Mg2++Ca2+] are
found in these samples. In these distributions, triangle shows the sodium which is higher than magnesium. This also suggests that the seawater intrusion has taken place and in
these places concentration of Na+ is more compared to Mg2+
and Ca2+. The abundance of Cl- ion cluster is higher than
bicarbonate ions. Hence, it is brought out the NaCl is major the component in Chennai towards the seashore whereas Mg and bicarbonate ions are the components in interior of the Chennai city and shown in Fig 2.
Integrated GIS Analysis
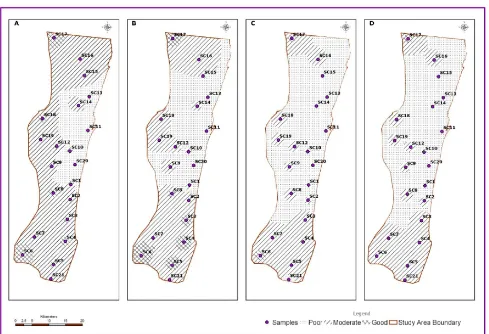
The weightage overlap had been carried out for the following parameters such as total dissolved solids, corrosivity ratio, total hardness, chloride/bicarbonate ratio in order to determine the quality of water. The important parameter to determine the water quality was total dissolved solids; therefore it carries maximum weightage followed by total hardness, chloride/ bicarbonate ratio and corrosivity ratio respectively. For good quality of water the maximum rank of 9 had been given and the rank of 1 had been given to the bad quality of water. Weightage Overlap I has been drawn for total dissolved solids and corrosivity ratio, Weightage Overlap II has been drawn for total hardness and chloride/bicarbonate ratio. Weightage Overlap has been drawn for Weightage Overlap I and II. The integrated GIS analysis is carried out to determine the quality of water. The maximum weightage is given to the total dissolved solids, followed by total hardness, chloride/ bicarbonate ratio respectively. The maximum rank has been given to the good quality of water and minimum rank has been given to the bad quality of water. The quality of water is good
0.0 0.1 0.2 0.3 0.4 0.5 0.6 0.7 0.8 0.9 1.0 1.1
1 10 100 1000 10000 Precipitation
Rock Water Interaction Evapouration T O T A L D IS S O L V E D S O L ID S (P P M ) CHLORIDE/CHLORIDE+BICARBONATE
0.3 0.4 0.5 0.6 0.7 0.8 0.9 1.0
1 10 100 1000 10000 Precipitation
Rock Water Interaction Evaporation T D S (P P M ) Na+K/Na+K+Ca Pre Monsoon
0.0 0.1 0.2 0.3 0.4 0.5 0.6 0.7 0.8 0.9 1.0 1.1
1 10 100 1000 10000 Precipitation
Rock Water Interaction Evapouration T O T A L D IS S O L V E D S O L ID S (P P M ) CHLORIDE/CHLORIDE+BICARBONATE
0.3 0.4 0.5 0.6 0.7 0.8 0.9 1.0
1 10 100 1000 10000 Precipitation
Rock Water Interaction Evaporation T D S (P P M ) Na+K/Na+K+Ca Winter
Post Monsoon Summer
Pre Monsoon Winter
Fig. 2. Piper Diagram
Table 1. Variation of Quality of Water using Water Quality Index
Quality of
Water Post Monsoon Summer Per Monsoon Winter
Poor SC6, SC8, SC9, SC12, SC17, SC18 SC6, SC8, SC9, SC17 SC6, SC9,SC12, SC18 SC6, SC9, SC12, SC18 Very Poor SC2, SC3, SC4, SC5, SC7, SC16,
SC19, SC21
SC2, SC3, SC4, SC5, SC7, SC10, SC12, SC15, SC16, SC18, SC19
SC3, SC4, SC5,SC7, SC8, SC10,SC16, SC17, SC19
SC2, SC3, SC4, SC7, SC8, SC10, SC16, SC17, SC19 Unfit SC1, SC10, SC11, SC13, SC14,
SC15, SC20
SC1, SC11, SC13, SC14, SC20, SC21
SC1, SC2, SC11, SC13, SC14, SC15, SC20, SC21
in SC6 and SC17 from post monsoon till pre monsoon but it become moderate in summer. The quality of water is moderate in 71% of the sampling sites in post monsoon and summer it starts to decreases up to 57% in the pre monsoon and further decreases to 47% in the winter. The quality of the water in the remaining places is poor and shown in Fig. 3. WQI values of 6 sampling stations have been identified in the poor status of ground water quality during post monsoon and it decreases to 4 in other seasons. 7 sampling stations have been identified in very poor status of ground water quality during post monsoon, it increases to 10 in summer, but it decreases to 9 in per monsoon and winter. 8 sampling stations have been identified as Unfit for drinking in post monsoon, but it decreases to 6 in summer but increases to 9 in winter and per monsoon. Sampling station of SC8 & SC17 is poor in post monsoon and summer but it become very poor in winter and per monsoon. SC12 & SC18 is poor in post monsoon but it is very poor in summer, but it once again becomes poor in per monsoon and winter. SC2 is very poor in post monsoon and summer, but it become unfit in per monsoon and once again become very poor in winter and it is shown in the Table 1. LSI Values for the all the seasons are negative value indicating that the all the samples undergoes corrosion.
Conclusion
Calcium and magnesium ion content starts decreasing from post monsoon till pre monsoon but increases in summer. Based on TDS 4 samples are suitable for drinking in post monsoon, 1 in winter and nil in pre monsoon and summer seasons. The
concentration of sodium increases from post monsoon till winter after that it starts decreases except SC6, SC18 where sodium content is within permissible level. In the study area, based on Gibb’s ratio I & II evaporation is the dominating process in all the seasons. In Post Monsoon, majority of the
samples were concentrated in the Mixed Ca-Na-HCO3 type
and Na-HCO3 type. In winter, majority of the samples were
concentrated in the Na-Cl type and mixed Ca-Mg-Cl type. In Pre Monsoon and summer majority of the samples concentrated in the Na-Cl type, which is the field 2, due to the saline nature in the groundwater. Based on the Integrated GIS, Nillikuppam and Ponnari are fresh water type from post monsoon to pre monsoon but it become moderate in summer. In remaining areas are due to the intrusion of anthropogenic activity. Based on the WQI the quality of groundwater of Chennai city are good only in the small pockets.
REFERENCES
Modal NC., Singh VP., Somvir Singh., Singh VS., 2011. Hydrochemical characteristic of coastal aquifer from Tuticorin, Tamil Nadu, India, Environ Monit Assess 175:531-550.
Modal NC., Singh VS., Saxenea VK., Singh VP., 2010. Assessment of seawater impact using major hydrochemical ions: a case study from Sadras, Tamil Nadu, India, Environ Monit Assess DOI 10.1007/s10661-010-1636-8.
Pujari RP, Soni AK., 2009. Sea Water intrusion studies near Kovaya limestone mine, Saurashtra Coast, India., Environ monit Assess 154:93-109.
RajMohan N., & Elango L., 2004. Identification and evolution of hydrogeochemical processes in the groundwater environment in an area of the Palar and Cheyyar River
Basins, Southern India. Environmental Geology 46; 47-61.
Satheesh Herbert Singh D, 2005. A Thesis, Evaluation of Groundwater Status and Coastal Aquifer Modeling of Chennai City, Tamil Nadu, India.
Senthil Kumar G., Ramanathan A.L., Nainwal H.C and
Chidambaram S., 2008. Evaluation of the
hydrogeochemistry of groundwater using factor analysis in
the cuddalore coastal region, Tamil Nadu, India, Indian
Journal of Marine Sciences, 37(2), 181-185.
Sivakumar C., and Elango L., 2008. Assessment of water quality in Kalpakkam region, Tamil Nadu, Dept. Of
Geology, Anna University, Chennai, Nature Environment
and pollution technology, vol.7, no.4, 687-691.