Original Research Article
Prevalence of undernutrition and its determinants among preschool
children in a rural community of Shimoga, Karnataka
Vijaykumar P. Mane
1*, M. V. Sagar
2, Revathy R.
3INTRODUCTION
Nutrition has been recognized as a prerequisite for social and economic development of a country. Adequate nutrition is essential especially in early childhood to ensure healthy growth, proper organ formation and function, development of a strong immune system, and neurological and cognitive functions.1 The nutritional status of a country particularly of its vulnerable groups comprising of children, expectant and lactating mothers has been recognized as an important indicator of national development.2
Undernutrition is a condition resulting from lack of sufficient energy/protein to meet the body’s metabolic demands, as a result of either an inadequate intake of protein, intake of poor quality protein, increased demands due to disease or increased nutrient losses. It is a major health and nutrition problem in India. It occurs particularly in children and leads to various degrees of growth retardation. It is not only an important cause of childhood morbidity and mortality, but also leads to permanent impairment of physical and mental growth of those who survive.3-5
ABSTRACT
Background: Undernutrition is a major health and nutrition problem in India especially among preschool children. It
is an important cause of childhood mortality and morbidity and also leads to permanent impairment of physical and mental growth of those who survive. The objective of the study was to estimate the prevalence of undernutrition among preschool children in the study setting and to determine various factors associated with undernutrition of the child.
Methods: A cross sectional study was conducted among 400 preschool children in the field practice area of PHC Aaynoor, Shivamogga, Karnataka. Cluster sampling technique was used for sample selection. Data was collected by interviewing the parent /guardian using a pretested and semistructured questionnaire and anthropometric measurements were done as per standard techniques. Statistical analysis was done using WHO Epi-info software version 3.5.4.
Results: The prevalence of underweight, stunting and wasting was observed in 38%, 43% and 15.8% of children respectively. The study found significant association between the prevalence of undernutrition and gender, birth weight, birth order, number of siblings, caste, paternal literacy and availability of toilet in the house of the child.
Conclusions: The present study revealed that the problem of undernutrition is critical in the study area and identifies
multiple risk factors for its causation, thereby signifying a well - coordinated multi sectorial approach to curb the same.
Keywords: Birth weight,Preschool child,Gender identity, Malnutrition, Social class
Department ofCommunity Medicine, 1Koppal Institute of Medical Sciences, Koppal; 2Subbaiah Institute of Medical Sciences and Research Center, Shimoga, 3Shimoga Institute of Medical Sciences, Shimoga, Karnataka, India
Received: 28 June 2018
Accepted: 31 July 2018
*Correspondence:
Dr. Vijaykumar P. Mane,
E-mail: [email protected]
Copyright: © the author(s), publisher and licensee Medip Academy. This is an open-access article distributed under
the terms of the Creative Commons Attribution Non-Commercial License, which permits unrestricted non-commercial use, distribution, and reproduction in any medium, provided the original work is properly cited.
Globally in 2011, there were an estimated 165 million children under five years of age who were stunted, 52 million were wasted and 101 million were underweight. Childhood undernutrition is mainly a problem of low and middle income countries and the estimates in these countries are nearly ten times than those found in high income countries.6 India has the largest share of global childhood malnutrition with 48% stunting, 20% wasting and 43% underweight in children under 5 years of age.7 Undernutrition is the most important single cause of illness and death globally, accounting for 12% of all deaths and 16% of disability adjusted life years lost.8 The pre-school age mortality in India is as high as 2.3% of all deaths and undernutrition was shown to be an underlying cause in 3.4% and associated cause in no less than 46%.3 With this background, the present study was undertaken with the following objectives
Objectives of the study
To estimate the prevalence of undernutrition among preschool children in the study setting.
To determine various factors associated with undernutrition of the child.
METHODS
Design of study
Community based cross sectional study.
Period of study
January 2013 – December 2013.
Place of study
Field practice area of PHC Aaynoor, Shivamogga, Karnataka. It had a population of 20,144 residing in 30 villages and the number of under five children was 1,518 at the time of study.
Study population
Pre-school children in the study area.
Sample size
Minimum sample size calculated was 385 with an absolute precision of 7% and significance level of 0.05 and design effect of 2, taking 43% prevalence of underweight in India as per recent estimates.7 We included 400 preschool children in our study.
Sampling technique
Cluster sampling technique was used for sample selection. All the 30 villages in the field practice area of PHC Aaynoor were considered as clusters and the same constituted sampling units for the study. 20 clusters were
selected by population proportional to size sampling. In each cluster, house to house visit was done and 20 preschool children were included, thus making a total sample of 400.
Exclusion criteria
Exclusion criteria were children not found in the house even after giving 2 visits; child residing in the study area for a period of less than 6 months; children of temporary visitors/guests to the house.
Study tools and data collection
Questionnaire: Pretested and semi-structured questionnaire was used for collection of data by interviewing the parent/guardian of the child after taking an informed consent during house-to-house visit.
Weighing machine: Body weight was measured with minimal clothing and without footwear to the nearest 0.1 Kg using LED digital portable weighing scale (SAMSO). Child was weighed alone if the child was able to stand still on the weighing machine. If the child was unable to stand alone, mother was told to hold the baby and stand on the scale and the total weight was recorded. Then the mother’s weight was measured and child’s weight was obtained by deducting her weight from the previous reading.
Measuring tape (nonflexible): Length/height was measured using a standard metal tape to the nearest centimeters. For children less than 2 years old, recumbent length was measured. Child was made to lie on a firm flat surface, head was positioned such that the eyes are looking vertically upwards (i.e. Frankfurt plane positioned vertically), knees extended by applying firm pressure and feet are flexed at right angles to the legs and length was measured.
For children aged 2 years and above, standing height was considered. Child was made to stand on flat floor with bare feet placed slightly apart and the back of the head, shoulder blades, buttocks, calves and heels touching the upright wall. The child’s head is so positioned that a horizontal line drawn from the ear canal to the lower edge of the eye socket ran parallel to the floor (i.e., the Frankfurt plane positioned horizontally). The arms were made to hang at sides in natural manner and the reading was taken.
Statistical analysis
deviation of the reference median on any of these indices were considered as undernourished and termed as underweight, stunted and wasted respectively. Children below three standard deviation were considered to be severely undernourished.9
In addition, the prevalence of undernutrition was also estimated in relation to certain selected variables. To find out the association of undernutrition with these variables, chi-square test was applied and the statistical significance was evaluated at 5% level of significance.
Ethical clearance
It was obtained from the Institutional Ethical Committee, Shimoga Institue of Medical Sciences, Shivamogga.
RESULTS
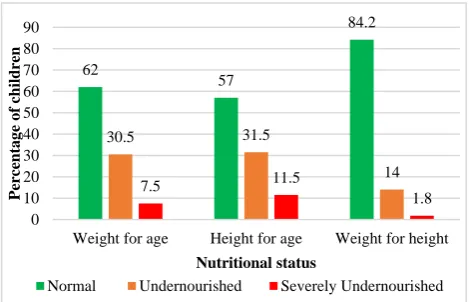
Figure 1 shows the distribution of study subjects according to their nutritional status. According to the WHO child growth standards, the prevalence of underweight (low weight for age), stunting (low height
for age) and wasting (low weight for height) was 122 (30.5%), 126 (31.5%) and 56 (14%) respectively in our study. The number of children having severe degree of underweight, stunting and wasting was found to be 30 (7.5%), 46 (11.5%) and 7 (1.8%) respectively.
Figure 1: Distribution of nutritional status of study subjects according to WHO child growth standards
2006 (n=400).
Table 1: Prevalence of under nutrition among study subjects according to certain selected variables of the child.
Variable Classification Children
observed (N)
Prevalence of undernutrition n (%)
Underweight Stunting Wasting
Gender
Male 190 82 (43.2) 88 (46.3) 31 (16.3) Female 210 70 (33.3) 84 (40) 32 (15.2) Total 400 152 (38) 172 (43) 63 (15.8)
χ2=
4.087 p=0.043
χ2=
1.623 p=0.203
χ2=
0.87 p=0.768
Age (in months)
12-23 112 43 (38.4) 55 (49.1) 22 (19.6) 24-35 101 32 (31.7) 43 (42.6) 10 (9.9) 36-47 97 37 (38.1) 36 (37.1) 12 (12.4) 48-59 90 40 (44.4) 38 (42.2) 19 (21.1) Total 400 152 (38) 172 (43) 63 (15.8)
χ2=
3.305 p=0.347
χ2=
3.105 p=0.376
χ2=
6.667 p=0.083
Birth weight
Low 64 38 (59.4) 41 (64.1) 15 (23.4) Normal 283 87 (30.7) 107 (37.8) 36 (12.7) Total 347* 125 (36) 148 (42.7) 51 (14.7)
χ2=
18.568 p=0.000
χ2=
14.708 p=0.000
χ2=
4.781 p=0.029
Birth order
First 192 65 (33.9) 69 (35.9) 27 (14.1) Second 134 49 (36.6) 66 (49.3) 19 (14.2) Third & above 74 38 (51.4) 37 (50) 17 (23) Total 400 152 (38) 172 (43) 63 (15.8)
χ2=
7.116 p=0.028
χ2=
7.525 p=0.023
χ2=
3.571 p=0.168
Number of siblings
None 87 28 (32.2) 30 (34.5) 14 (16.1) One 206 71 (34.5) 90 (43.7) 27 (13.1) Two & above 107 53 (49.5) 52 (48.6) 22 (20.6) Total 400 152 (38) 172 (43) 63 (15.8)
χ2=
8.382 p=0.015
χ2=
3.983 p=0.136
χ2=
2.958 p=0.228
62
57
84.2
30.5 31.5
14
7.5 11.5
1.8 0
10 20 30 40 50 60 70 80 90
Weight for age Height for age Weight for height
Perc
entag
e
o
f
children
Nutritional status
Normal Undernourished Severely Undernourished
Variable Classification Children
observed N Prevalence of undernutrition n (%)
Underweight Stunting Wasting
Immunization status
Complete 376 145 (38.6) 164 (43.6) 60 (16) Partial 24 7 (29.2) 8 (33.3) 3 (12.5) Total 400 152 (38) 172 (43) 63 (15.8)
χ2=
0.846 p=0.358
χ2=
0.973 p=0.324
χ2=
0.203 p=0.652
Exclusive breastfeeding
Given 336 130 (38.7) 146 (43.5) 52 (15.5) Not given 64 22 (34.4) 26 (40.6) 11 (17.2) Total 400 152 (38) 172 (43) 63 (15.8)
χ2=
0.425 p=0.514
χ2=
0.175 p=0.675
χ2=
0.119 p=0.731
*
Only children having data regarding their birth weights are considered here.
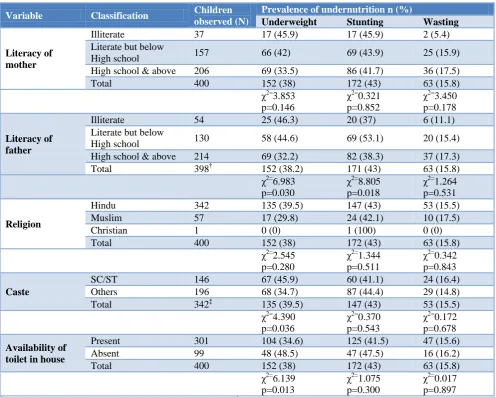
Table 2: Prevalence of under nutrition among study subjects according to certain social and environmental factors.
Variable Classification Children
observed (N)
Prevalence of undernutrition n (%)
Underweight Stunting Wasting
Literacy of mother
Illiterate 37 17 (45.9) 17 (45.9) 2 (5.4) Literate but below
High school 157 66 (42) 69 (43.9) 25 (15.9) High school & above 206 69 (33.5) 86 (41.7) 36 (17.5) Total 400 152 (38) 172 (43) 63 (15.8)
χ2=
3.853 p=0.146
χ2=
0.321 p=0.852
χ2=
3.450 p=0.178
Literacy of father
Illiterate 54 25 (46.3) 20 (37) 6 (11.1) Literate but below
High school 130 58 (44.6) 69 (53.1) 20 (15.4) High school & above 214 69 (32.2) 82 (38.3) 37 (17.3) Total 398† 152 (38.2) 171 (43) 63 (15.8)
χ2=
6.983 p=0.030
χ2=
8.805 p=0.018
χ2=
1.264 p=0.531
Religion
Hindu 342 135 (39.5) 147 (43) 53 (15.5) Muslim 57 17 (29.8) 24 (42.1) 10 (17.5) Christian 1 0 (0) 1 (100) 0 (0) Total 400 152 (38) 172 (43) 63 (15.8)
χ2=
2.545 p=0.280
χ2=
1.344 p=0.511
χ2=
0.342 p=0.843
Caste
SC/ST 146 67 (45.9) 60 (41.1) 24 (16.4) Others 196 68 (34.7) 87 (44.4) 29 (14.8) Total 342‡ 135 (39.5) 147 (43) 53 (15.5)
χ2=
4.390 p=0.036
χ2=
0.370 p=0.543
χ2=
0.172 p=0.678
Availability of toilet in house
Present 301 104 (34.6) 125 (41.5) 47 (15.6) Absent 99 48 (48.5) 47 (47.5) 16 (16.2) Total 400 152 (38) 172 (43) 63 (15.8)
χ2=
6.139 p=0.013
χ2=
1.075 p=0.300
χ2=
0.017 p=0.897
†
Two study children were not having fathers at the time of study; ‡Only children belonging to Hindu religion are considered here.
Table 1 shows the prevalence of undernutrition among study subjects according to certain important variables of the child. The prevalence of all the forms of undernutrition was more in male children than females and it was found to be significant for underweight (p=0.04). Similarly undernutrition was significantly more
(p=0.02) in case of birth order and only for underweight (p=0.01) in case of number of siblings. However, the present study could not find any association between the prevalence of undernutrition and age, immunization status and breastfeeding status of the child.
Table 2 shows the prevalence of undernutrition among study subjects according to certain social and environmental factors. The present study did not find any significant association between the prevalence of undernutrition and maternal literacy. However there was significant association between the prevalence of underweight (p=0.03) and stunting (p=0.01) among children with paternal literacy. We found significantly higher number of underweight children (p=0.03) in scheduled caste/tribe (SC/ST) families compared to others among those belonging to Hindu religion despite the fact that there was no significant association between the prevalence of undernutrition and religion of the child. Further, the number of underweight children was significantly (p=0.01) less in houses which had toilets.
DISCUSSION
The prevalence of undernutrition was high in the present study with 38% of underweight, 43% of stunting and 15.8% of wasting among children similar to the findings of NFHS – 3 survey10 for Karnataka and other studies done in different parts of the country.5,11-13 However, many other studies have found even higher prevalences of undernutrition, which could be due to differences in the study settings, cultural diversity between study populations, different time periods, differences in sampling techniques and data collection tools as well as differences in standards/references used for classifying undernutrition.14-17
In the present study, male children were found to be more affected by undernutrition than females contrary the findings of many other studies.11,15,16,18 NFHS – 3 and HUNGaMa surveys however have reported almost equal prevalence of undernutrition among male and female children.10,19 The prevalence of undernutrition was more in children who had low birth weight which conforms to the findings of two other studies.16,19 Both increasing birth order and number of siblings have been found to be associated with increasing prevalence of undernutrition in the present study similar to the findings of NFHS–3 survey and a study by Sengupta et al respectively.10,16 Many studiesincluding NFHS–3 and HUNGaMa survey have found an inverse association between the prevalence of undernutrition and maternal education unlike the present study findings.10,11,14,16,18,19 However there was significant association between undernutrition and paternal education similar to the findings of the study by Mathad et al done in Belgaum, Karnataka.20 A study by Joshi et al reported significantly higher prevalence of undernutrition in children belonging to lower caste similar to the present study.14 Availability of toilet in the
house has been shown to have a positive impact on the nutritional status of preschool children which also confirms HUNGaMa survey report.19
CONCLUSION
The present study revealed that the problem of undernutrition is critical in the study area and identifies multiple risk factors for its causation thereby emphasizing on multi sectoral approach for the prevention of the same.
ACKNOWLEDGEMENTS
Authors acknowledge faculty from the department of Community Medicine, Shimoga Institute of Medical Sciences, Shimoga, Karnataka for overall motivation and support. Authors also thank Administrative Medical Officer, PHC Aaynoor and all the field workers for their help and cooperation in conducting the study.
Funding: No funding sources Conflict of interest: None declared
Ethical approval: The study was approved by the Institutional Ethics Committee
REFERENCES
1. De Onis M, Brown D, Blössner M, Borghi E. Levels and Trends in Child Malnutrition. UNICEF -WHO- The World Bank Joint Child Malnutrition Estimates. 2012: 9-10.
2. Vinod N, Swarnakanta L, Smita P, Pushpa D. Nutritional status and dietary pattern of under five children in urban slum area. National J Comm Med. 2011;2(1):143-8.
3. Park K. Park’s Text book of Preventive and Social Medicine. 23rd ed. Jabalpur: M/s Banarasidas Bhanot Publishers; 2015: 549.
4. International Institute for Population Sciences (IIPS) and Macro International. 2007. National Family Health Survey (NFHS-3), 2005–06: India: Volume I. Mumbai: IIPS.
5. Anwar F, Gupta MK, Prabha C, Srivastava RK. Malnutrition among rural Indian children: An assessment using web of indices. Int J Public Health Epidemiol. 2013;2(4):78-84.
6. United Nations Children’s Fund, World Health Organization, The World Bank. UNICEF WHO- World Bank joint child malnutrition estimates. UNICEF, New York; WHO, Geneva; The World Bank, Washington, DC; 2012;9-10.
7. UNICEF. Improving child nutrition The achievable imperative for global progress. UNICEF. 2013: 117. 8. Kishore J. National Health programs of India National policies and legislations related to health. 10th ed. New Delhi: Century publications; 2012: 439.
standards: Training course on Child growth assessment. World health organization 2008.Module – C:22.
10. International Institute for Population Sciences (IIPS) and Macro International. 2007. National Family Health Survey (NFHS-3), 2005–06: India: Volume I. Mumbai: IIPS.
11. Mittal A, Singh J, Ahluwalia SK. Effect of maternal factors on nutritional status of 1-5 year old children in urban slum population. Indian J Community Med. 2007;32(4):264-7.
12. Santoshkumar A, Sunilkumar D, Ashok NC, Koppad R. Protein energy malnutrition and its association with immunization status and common morbidities among 1-5 year aged children in southern part of India, Mysore. Int J Cur Res Rev. 2013;5(2):105-10.
13. Renuka M, Rakesh A, Babu NM, Santosh KA. Nutritional status of Jenukuruba pre-school children in Mysore district, Karnataka. IJRRMS. 2011;1(1):12-7.
14. Joshi HS, Joshi MC, Singh A, Joshi P, Khan NI. Determinants of protein energy malnutrition (PEM) in 0-6 years children in rural community of Bareilly. Indian J Prev Soc Med. 2011;42(2):154-8.
15. Bisai S, Mallick C. Prevalence of undernutrition among Kora-mudi children aged 2-13 years in
Paschim Medinipur district, West Bengal, India. World J Pediatr. 2011;7(1):31-6.
16. Sengupta P, Philip N, Benjamin AI. Epidemiological correlates of undernutrition in under 5 years children in an urban slum of Ludhiana. HPPI. 2010;33(1):1-9.
17. Mitra SP. A study of dietary intake and nutritional status of under five children in slums of Kolkata city. Indian J Community Med. 2007;1(1):92. 18. Dey I, Chaudhuri RN. Gender inequality in
nutritional status among under five children in a village in Hooghly district, West Bengal. Indian J Public Health. 2008;52(4):218-20.
19. HUNGaMa fighting hunger and malnutrition the HUNGaMa survey report 2011. Naandi foundation; 2011;28. Available at: www.hungamaforchange.org. Accessed on September 14th 2013.
20. Mathad V, Metgud C, Mallapur MD. Nutritional status of under-fives in rural area of south India. Indian J Med Sci. 2011;65(4):151-6.
Cite this article as: Mane VP, Sagar MV, Revathy