Original Research Article
Work environment of automated and non-automated rice mills in
Amapara district, Sri Lanka
K. R. M. Chandrathilaka
1*, S. R. De Alwis Seneviratne
2, K. N. Lankatilake
3,
D. B. D. L. Samaranayake
3, A. K. Karunarathna
4INTRODUCTION
Sri Lanka which has been a paddy growing country from ancient times, harvests paddy during two major seasons, namely, Yala (March-August) and Maha (September-February) seasons. Being a major paddy harvesting area in Sri Lanka, the Ampara district’s contribution to the annual national paddy production was about 17.4% (199,265 MT) in Yala season in 2014 and 16.5% (368,748 MT) in Maha season in 2013/14.1,2
Paddy is transformed into its two major consumable forms, namely raw rice and parboil rice by a process of milling.3,4 Milling removes the husk, bran layers and impurities in the paddy grain to produce the rice kernel that is edible.5 The milling process may be just one step, two steps or multi stage depending on the machines used. Several electrically powered machinery such as, rubber roll sheller/ dehusker, rice polisher and sometimes destoner and grader are installed inside the mill for the processing of paddy grains.6 In some mills this process is
ABSTRACT
Background: Paddy cultivation is a major occupation in informal sector in Sri Lanka. In 2014, contribution of the agricultural activities to the country’s annual GDP was 9.9% of which, contribution by paddy was 11.3%. The objective of the current study was to describe the work environment in rice mills with respect to dust, humidity and thermal condition, ventilation and illumination.
Methods: A cross sectional study in 107 randomly selected rice mills was carried out in Ampara district in Sri Lanka. Standardized measurements were carried out to assess internal work environment of the mills.
Results: Milling activities showed a seasonal variation. The majority of the mills (95.3%) manufactured raw rice only. Other than the basic characteristics, both automated (AMs) and non-automated mills (NAMs) showed common features. All rice mills exceeded the threshold limit values for total (520.04 mg/m3, SD=191.86 mg/m3) and respirable dust (48.14 mg/m3, SD=9.4 mg/m3). Mean daytime indoor relative humidity in the majority of the mills (n=102, 95.3%) was within the accepted upper limit. In most of the mills, ventilation (n=84, 78.5%) and illumination in polishing/packing area (n=60, 56.1%) was satisfactory while in dehusking/paddy inlet area (n=96, 89.7%), illumination was below the limits.
Conclusions: Work environment in both the AMs and NAMs in Ampara district presented with poor work standards compared to the required guidelines.
Keywords: Dust exposure, Occupational health, Rice milling, Thermal comfort, Work environment
1
Department of Allied Health Sciences, 3Department of Community Medicine, Faculty of Medicine, University of Colombo, Sri Lanka
2Faculty of Medicine, General Sir John Kotelawala Defence University, Rathmalana, Sri Lanka
4Department of Agricultural Engineering, Faculty of Agriculture, University of Peradeniya, Peradeniya, Sri Lanka
Received: 02 June 2018
Accepted: 05 July 2018
*Correspondence:
K. R. M. Chandrathilaka,
E-mail: [email protected]
Copyright: © the author(s), publisher and licensee Medip Academy. This is an open-access article distributed under the terms of the Creative Commons Attribution Non-Commercial License, which permits unrestricted non-commercial use, distribution, and reproduction in any medium, provided the original work is properly cited.
automated where the worker involvement is limited while in some it is done manually by workers.7
Studies have confirmed that work environmental factors have a major influence on the worker’s health.4,8-12 Thus,
it is important to investigate the work environment in rice mills to ensure safety and health of the workers. Therefore, current study was aimed at describing the work environment in rice mills with respect to characteristics, such as, dust concentration, humidity, heat stress, ventilation, overcrowding and intensity of illumination which are very important for a safe work environment in rice mills and to compare those characteristics between automated and non-automated mills. The findings of this study will establish a baseline to implement necessary preventive measures to address the highlighted deficits in the rice mills in future.
METHODS
This descriptive cross sectional study was conducted during the months of March-August, 2014 in 107 randomly selected automated and non-automated rice mills in Ampara district in Sri Lanka which represented nearly 16% of the mills (n=690) in the district. Written consent was taken from the rice mill owners and the workers prior to data collection.
Basic rice mill characteristics were collected from the rice mill owners using an interviewer administered questionnaire. Monthly average income generated by milling was calculated taking into consideration income generated from selling rice, husk and bran during the study period. The rice mills were categorized as automated mills (AMs) and non-automated mills (NAMs) based on operational characteristics. Automated mills which had larger production and storage capacities were operated by self and casual types of employees whereas NAMs which had a lesser production capacity were self-occupied. The study period was categorised as peak and off-peak period based on work load of the mills. Each period included nearly three months while peak period had comparatively higher workload than the off-peak period.
Respirable dust level was measured using the (GilAir3™ personal air sampler). The samplers were fixed to the millers in selected rice mills. The inhalable dust sampling head was mounted close to their breathing zone. The sampler, filters the air passing through the filter head containing the cassette fitted with the filter paper on to which the particulate matter gets collected. The millers get about performing their work while the sampling of air takes place. The filter papers were transported in a desiccator to the laboratory of the Department of Community Medicine, Faculty of Medicine, University of Colombo. The filter papers were weighed before and after dust sampling on an electronic weighing scale which weighed accurately to the fourth decimal place. Thus, 163 readings were obtained for respirable dust in 107 rice
mills. Measurement of total dust level was done using the same sample with total dust sampling filter head. The procedure for the measurement of total dust level was same as that for respirable dust. Environmental measurements for relative humidity (RH) and heat stress were measured using the Thermal Environmental Monitor (QUESTemp0 32™; serial number TPR080021). Ventilation inside the mill was assessed based on the calculation of the floor area, in relation to door and window areas for which the measurements were taken using a measuring tape. Intensity of illumination was measured within 1 m2 of working area at paddy inlet and packing areas of AMs and dehusking and polishing areas of NAMs using a digital light meter (model number: CEM DT-1308TM). The illumination values at paddy inlet in AMs were grouped together with those of dehusking area in NAMs while values near packing area in AMs and polishing area of NAMs were grouped together to facilitate the analysis. Humidity and heat stress inside the rice mills were measured at places representative of positions occupied by workers and their movements while they were engaged in work.
The measurements were taken in accordance with the international standards and calibration of the dust sampler, thermal environmental monitor and digital light meter were done following the instructions given in the manufacturer’s user manual.
Statistical Package for the Social Sciences (SPSS) version 20 software was used in data analysis. Descriptive statistics were used to describe the general characteristics of the mills. The AM and NAM groups were compared for the measurements of dust, humidity, heat stress, ventilation and illumination using independent sample t test. The ethical approval for the current study was obtained from the Ethics Review Committee, Faculty of Medicine, University of Colombo, Sri Lanka.
RESULTS
Of the 107 rice mills, only 5 (4.7%) mills manufactured both parboiled rice and raw rice while rest of the mills (n=102, 95.3%) produced only raw rice.
Basic characteristics of the rice mills
The majority of the rice mills were non-automated mills (n=78, 72.9%) while the rest were automated (n=29, 27.1%). Table 1 summarizes the basic characteristics of NAMs and AMs during peak and off-peak periods. During the off-peak period, 48.3% (n=14) of the AMs and 2.6% (n=2) of the NAMs were not functioned due to shortage of paddy supply.
income of more than LKR 500,000.00 during the study period whereas 27.6% (n=8) of the AMs had LKR 500,000.00 or more even during the off-peak period. Number of AMs those had an average monthly income of
more than LKR 1,000,000.00 in the peak season was markedly reduced by 58.7% in the off-peak season (Table 1).
Table 1: Basic characteristics of the non-automated (NAM) and automated (AM) rice mills based on the peak and off-peak periods.
Characteristic
NAM n=78 AM n=29
Peak period No (%)
Off-peak period No (%)
Peak period No (%)
Off-peak period No (%)
Number of months operated in a year
≤5 months 02 (2.6) 02 (2.6)1 18 (62.1) 23 (79.3)2
>5 months 76 (97.4) 76 (97.4) 11 (37.9) 06 (20.7)
Total 78 (100) 78 (100) 29 (100) 29 (100)
Average monthly income (LKR)
00.01 - 100,000.00 76 (97.4) 78 (100) 1 00 (0.0) 14 (48.3)2
100,000.01 – 500,000.00 02 (0.0) 00 (0.0) 05 (17.2) 07 (24.1)
500,000.01 – 1,000,000.00 00 (0.0) 00 (0.0) 05 (17.2) 06 (20.7)
≥1,000,000.01 00 (0.0) 00 (0.0) 19 (65.6) 02 (6.9)
Total 78 (100) 78 (100) 29 (100) 29 (100)
Average amount of paddy processed per month (kg)
≤10,000 76 (97.4) 78 (100) 1 05 (17.2) 14 (48.3)2
10,000.01-100,000.00 02 (2.6) 00 (0.0) 10 (34.5) 13 (44.8)
≥100,000.01 00 (0.0) 00 (0.0) 14 (48.3) 02 (6.9)
Total 78 (100) 78 (100) 29 (100) 29 (100)
Number of mills based on workers’ employment category
Unemployed 00 (0.0) 02 ( 2.5)1 00 (0.0 ) 14 (48.3)2
Self only 68 (87.2) 75 (96.2) 02 (6.9) 05 (17.2)
Casual only 05 (6.4) 01 (1.3) 15 (51.7) 02 (6.9)
Both self and casual 05 (6.4) 00 (0.0) 12 (41.4) 08 (27.6)
Total 78 (100) 78 (100) 29 (100) 29 (100)
1
Two NAMs were closed during the off-peak season; 2Fourteen AMs were closed during the off-peak season.
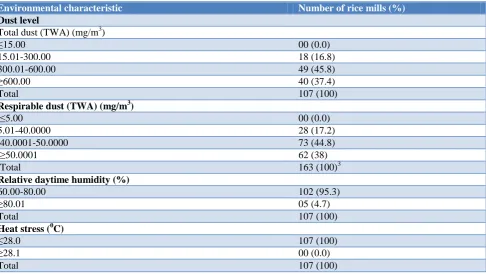
Table 2: Environmental data in the rice mills.
Environmental characteristic Number of rice mills (%)
Dust level
Total dust (TWA) (mg/m3)
≤15.00 00 (0.0)
15.01-300.00 18 (16.8)
300.01-600.00 49 (45.8)
≥600.00 40 (37.4)
Total 107 (100)
Respirable dust (TWA) (mg/m3)
≤5.00 00 (0.0)
5.01-40.0000 28 (17.2)
40.0001-50.0000 73 (44.8)
≥50.0001 62 (38)
Total 163 (100)3
Relative daytime humidity (%)
60.00-80.00 102 (95.3)
≥80.01 05 (4.7)
Total 107 (100)
Heat stress (0C)
≤28.0 107 (100)
≥28.1 00 (0.0)
Environmental characteristic Number of rice mills (%)
Ventilation
Satisfactory 84 (78.5)
Unsatisfactory 23 (21.5)
Total 107 (100)
Overcrowding
Overcrowded 00 (0.0)
Not overcrowded 107 (100)
Total 107 (100)
Intensity of illumination (lux)
Dehusking/ paddy inlet area
≤53.8 96 (89.7)
50.1-100.0 08 (7.5)
≥100.1 03 (2.8)
Total 107 (100)
Polishing/ packing area
≤53.8 47 (43.9)
53.9-100.0 50 (46.7)
≥ 100.1 10 (9.4)
Total 107 (100)
3
Respirable dust was calculated for all the rice mill workers (n=163) who had worked at the time of data collection in the selected rice mills (n=107).
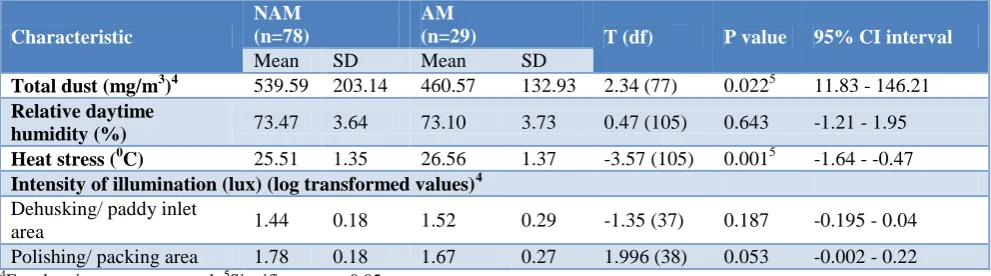
Table 3: Comparison of means of environmental characteristics between AM and NAM groups during the peak period.
Characteristic
NAM (n=78)
AM
(n=29) T (df) P value 95% CI interval
Mean SD Mean SD
Total dust (mg/m3)4 539.59 203.14 460.57 132.93 2.34 (77) 0.0225 11.83 - 146.21
Relative daytime
humidity (%) 73.47 3.64 73.10 3.73 0.47 (105) 0.643 -1.21 - 1.95 Heat stress (0C) 25.51 1.35 26.56 1.37 -3.57 (105) 0.0015 -1.64 - -0.47
Intensity of illumination (lux) (log transformed values)4
Dehusking/ paddy inlet
area 1.44 0.18 1.52 0.29 -1.35 (37) 0.187 -0.195 - 0.04
Polishing/ packing area 1.78 0.18 1.67 0.27 1.996 (38) 0.053 -0.002 - 0.22
4
Equal variances not assumed; 5Significant at p<0.05.
Number of AMs processed more than 10,000 kg per month was considerably reduced during the off-peak period compared to the peak period, nearly by 31.1%. None of the NAMs exceeded 10,000 kg during the off-peak period (Table 1).
In the off-peak period, percentage of self-occupied NAMs increased by 9% while the number of AMs operated only by casual workers decreased by 44.8% (Table 1). A trend of reduction in the number of casual workers during the off-peak period in both AMs and NAMs was also observed.
Environmental measurements
Frequency distribution of rice mills based on environmental measurements is tabulated in Table 2.
Dust levels
The mean total dust level was 520.04 mg/m3±191.86 mg/m3 (x ±SD) (n=107) and mean respirable dust level was 48.14 mg/m3±9.4 mg/m3 (x SD) (n=163). Dust levels in all the mills (n=107, 100%) were higher than the Occupational safety and Health Administration (OSHA) threshold limit values for total (15 mg/m3) and respirable dust (5 mg/m3) (Table 2). The majority of the rice mills had a total dust concentration of 300.01 mg/m3 or more (n=89, 83.2%) and a respirable dust concentration ranging from 40.0001 to 50.0000 mg/m3 (n=135, 82.8%).
Daytime relative humidity
In the majority (n=102, 95.3%) RH ranged between 60-80% (Table 2).
Heat stress
All the mills (n=107, 100%) had heat stress values of 28.0 0C or below indicating a satisfactory heat stress level.
Ventilation and overcrowding
Ventilation was satisfactory in majority of the mills (n=84, 78.5%) (Table 2). Three (2.8%) rice mills had not exceeded 15% of free uninterrupted space of the total floor area while 21.5% (n=23) of the mills lacked open areas of more than 50% of the free space inside the mills. Further, all the rice mills (n=107, 100%) were not overcrowded.
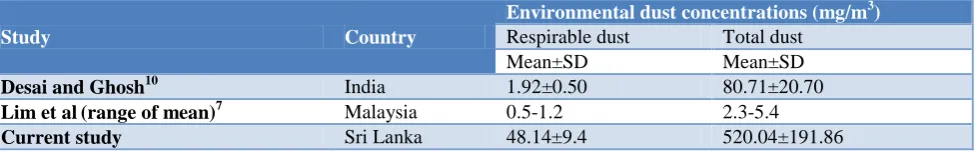
Table 4: Comparison of respirable and total dust concentrations of rice mills with other studies.
Intensity of illumination
In dehusking/paddy inlet area, the intensity of illuminance in the majority of the rice mills (n=96, 89.7%) were lower than minimum level according to the Factories (general standards of lighting) Regulations, Sri Lanka (1965) whereas in polishing/packing area, majority of the mills (n=60, 56.1%) exceeded the minimum value.13 The lowest light intensity was measured near the dehusking/ paddy inlet area of a rice mill which was 14 lux while the highest value was recorded as 257 lux near the packing/polishing area which was near the entrance to the mill.
Table 3 summarizes the work environmental characteristics of AMs and NAMs. This comparison of the environmental characteristics between AMs and NAMs was done only for the peak season as the variables varied considerably during off-peak season. Among the significant findings of this comparison were, a higher mean total dust level (p<0.05) and a lower heat stress (p<0.01) in NAMs (p<0.05) compared to AMs. All other factors were statistically not significant between the two groups (Table 3). Ventilation data were not included in the comparison due to wide variation of free space inside the mills during the peak period. However, there was a statistically significant difference (p<0.01) between NAMs and AMs in the mean total floor area (mean difference=75.58, SD=3.54; t (105)=13.029; CI(95)=
-87.46, -63.70) and total open area (mean difference=5.3, SD=0.63; t(105)=8.433; CI(95)=4.08, 6.59). Mean total
floor area was higher in the AMs compared to the NAMs although, the mean total open area was less.
DISCUSSION
No studies have been done previously to describe the work environment of rice mills in Sri Lanka. Besides the work environment this study presents information on working patterns, too. The current study was done during
the dry season, hence, the effect of seasonal variation was not considered.
Irrespective of whether it’s the peak period or not NAMs seem to operate over a longer period of time during a year than AMs. The reason being, the AMs can process a large quantity of paddy during a short period of time than NAMs which are operated manually. This is supported by the distribution of the average monthly income of the AMs when compared to that of NAMs which have a monthly income of LKR 100,000.00 or less.
The income generated by selling paddy husk was not considered in the calculation of average monthly income as its contribution to the income was relatively low. As expected, average monthly income was proportional to the average amount of paddy processed per month.
Rice mill workers’ employment category changed considerably during the off-peak period specially in AMs. Mills operated only by casual workers or both self and casual workers, reduced mainly because those were either closed or operated by the owner himself as the workload reduced during the off-peak period.
According to WHO, dust originating from processing of grains, such as rice, oats, wheat and barley belong to the category of organic and vegetable dust.14 These particles when inhaled find their way into the deepest tissues in the lung. Hence, it has been identified as a well-recognized cause of respiratory conditions, such as, asthma, chronic obstructive pulmonary disease, lung fibrosis, etc.8-11 In the current study, threshold limit values (TLVs) defined by the Occupational Safety and Health Administration (OSHA) for 8 hour time-weighted average (TWA) for total and respirable dust levels were used to interpret the data i.e. 5 mg/m3 and 15 mg/m3 respectively.15,16 The measured total and respirable dust levels were much higher than the respective TLVs (Table 2) and further, they were considerably higher than those of the Asian
Study Country
Environmental dust concentrations (mg/m3)
Respirable dust Total dust
Mean±SD Mean±SD
Desai and Ghosh10 India 1.92±0.50 80.71±20.70
Lim et al(range of mean)7 Malaysia 0.5-1.2 2.3-5.4
countries (Table 4).8,11 In addition, higher mean total dust levels in NAMs compared to AMs during the peak period (Table 3) may be due to lack of dust emission control methods. All the AMs comprised of enclosed columns to aid transportation of processing paddy grain between machines which was not available in NAMs. Enclosed columns prevent emission of a considerable amount of dust during the process. Thus, in general, the results indicate that the dust controlling methods have not been efficiently used specially in the NAMs compared to the AMs. High dust concentrations and poor housekeeping may have an effect on workers’ health.10 Therefore,
improvements in the milling environment and the knowledge and skills of workers are necessary. Occupational hazard can be prevented by elimination, engineering and/or administrative control measures and by the use of personal protective equipment.17 Under these methods regular housekeeping, proper equipment maintenance and healthy personal hygiene practices can be followed without much cost to ensure the health and safety of the mill workers. It was observed that rice mills in the study area lacked dust control methods while their owners/ occupiers were not knowledgeable on this aspect. That has to be considered when implementing programmes to eliminate the problems associated with the high dust levels.
Monthly mean values for daytime humidity in the rice mills ranged between 63-81% during the study period. The raw data obtained from the Department of Meteorology, Sri Lanka, on monthly mean day time relative humidity of the study area for the months from February to August in the years 2012 to 2014 ranged between 64 and 78%.18 Current study values of RH were in parallel with the country values for the same period of time although they were measured inside the mill. The majority of the mills (n=102, 95.3%) were within the range of upper limit of indoor relative humidity criteria drawn by American Society of Heating, Refrigerating and Air-Conditioning Engineers (ASHRAE) which is 60-80%. Relative humidity has been found as a cause for direct and indirect health effects such as disorientation and physical and emotional stress.19-21 High relative humidity is favourable for growth of mites and hence it has been stated that maintaining a relative humidity of 40-70% could be effective in minimizing the growth of micro-organisms.19 Therefore, humidity controlling methods should be implemented to avoid unnecessary health effects to millers in the mills which reported a high RH.
Heat stress was interpreted according to the American Conference of Governmental Industrial Hygienists (ACGIH) recommendation for permissible heat exposure threshold limit value for a moderate workload with a 75% work, 25% rest work regimen which is, 28.00C.22 Current study showed that in all the mills (n=107, 100%), heat stress were at a comfortable range. Compared to NAMs, AMs had a higher mean heat stress value (Table 3). The NAMs having a higher mean open area compared to the
AMs may have made the NAMs thermally comfortable. In addition, differences in the duration of operation may have influenced the increase in heat stress because the mills operated over a duration of 2-8 hours. Most of the NAMs operated to meet the needs of the consumer and the milling would have been over short spells of time whereas the AMs had stored paddy to process throughout the daytime. Thus, continuous heat build-up may occur in AMs compared to short bursts in NAMs which attenuates in non-functioning times of NAMs.
Satisfactory ventilation was defined according to Board of Investments (BOI) guidelines, Sri Lanka (2001), as having at least 15% of the floor space of the room of which at least 50% shall have openings so as to allow free uninterrupted air passage.23 In general, ventilation has been satisfactory in most of the rice mills (n=84, 78.5%) under study (Table 2). Further, there was a significantly lower mean total open area (p<0.01) in AMs compared to NAMs. The AMs, irrespective of being larger in size, had smaller percentage of open areas compared to the NAMs (Table 3) resulted in poor ventilation. As such, in AMs, the mean heat stress level was significantly high (p<0.01) than the NAMs which may warrant a change in building structure by increasing the number and size of the open areas such as windows and doors.
Regulation for overcrowding according to the Factories Ordinance of Sri Lanka states that, 400 cubic feet (11.33 m3) of free air space per person should be allowed to avoid overcrowding.24 None of the rice mills were overcrowded in the current study (Table 2).
According to the factories (general standards of lighting) regulations, Sri Lanka (1965), the minimum light intensity should be 5 ft candles (53.8 lux) at a height of 3 feet from the floor.13 The reason for contrast results for minimum illumination intensity between dehusking/paddy inlet area and polishing/packing area of rice mills may be due to the location of the later near to the door area of the mills. Further, dust arising during the milling process may reduce the visibility of the working areas. Since the relationship between working conditions and worker’s health is vital, maintaining an adequate illumination intensity will provide a safe environment for the mill workers.25,26 The results of the current study emphasise that employers/occupiers should pay attention to provide adequate lighting otherwise it may prone the workers to accidents and injury during work and maintenance activities.
Sri Lanka, it was found that such evaluations have not been performed in the study area for a long time.24
The current study has several limitations including factors inherent due to cross sectional nature, that need to be considered when interpreting the results and in addressing future research. This study could not describe all the work environmental factors related to rice milling due to lack of resources and accessibility problems. Further, differences in income and paddy processing capacity may have an effect on the results therefore, separate studies deeply addressing those factors would produce more details. Analysis based on other factors other than the income may reveal new areas to be researched.
By carrying out a research in the rice mill itself, it was possible to identify issues specific to the industry which were not evident due to less attention paid by the employers/ occupier and the relevant authorities towards work environmental factors. According to the findings, improving and regular monitoring of the work environment are recommended. Further research needs to be encouraged to investigate more into work environmental problems associated with rice milling in the future.
ACKNOWLEDGEMENTS
The provision of personal air samplers and other facilities in the laboratory of the Department of Community Medicine, Faculty of Medicine, University of Colombo, Sri Lanka and financial assistance through Higher Education for Twenty First Century (HETC) project of the World Bank are gratefully acknowledged.
Funding: Higher Education for Twenty First Century (HETC) project of the World Bank
Conflict of interest: None declared
Ethical approval: The study was approved by the Institutional Ethics Committee of Faculty of Medicine, University of Colombo, Sri Lanka
REFERENCES
1. Department of Census and Statistics, Sri Lanka. Paddy Statistics: Extent, Sown, Harvested, Average Yield and Production by District: 2014 Yala Season. 2014; Available at: http://www.statistics.gov.lk/ agriculture/Paddy%20Statistics/PaddyStatsPages/20 14yala(MT).pdf. Accessed 20 May 2015.
2. Department of Census and Statistics, Sri Lanka. Paddy Statistics: Extent, Sown, Harvested, Average Yield and Production by District: 2013/14 Maha Season. 2014; Available at: http://www.statistics. gov.lk/agriculture/Paddy%20Statistics/PaddyStatsPa ges/2013_2014Maha.pdf. Accessed on 20 May 2015.
3. Abeysekara NTQM. A study of the respiratory and other disorders in rice millers following exposure to
dusts of occupational origin. University of Colombo; 1994.
4. Batsungneon K, Kulworawanichpong T. Effect of Dust Particles in Local Rice Mills on Human Respiratory System. World Acad Sci Eng Technol. 2011;56:260-5.
5. International Rice Research Institute. Milling, Rice Knowledge Bank. No date; Available at: http://www.knowledgebank.irri.org/step-by-step- production/postharvest/milling#guidelines-for-good-milling. Accessed 21 June 2015.
6. Palipane KB. Milling and Quality Improvement in Rice. Institute of Post-Harvest Technology, Anuradhapura. No date; Available at: http://www.goviya.lk/agrilearning/Paddy/Paddy_Re search/Paddy_pdf/AM2.pdf. Accessed 11 November 2016.
7. International Rice Research Institute. Milling Systems, Rice Knowledge Bank. No date; Available at: http://www.knowledgebank.irri.org/step-by-step-production/postharvest/milling#milling-systems. Accessed 21 June 2015.
8. Lim HH, Domala Z, Joginder S, Lee SH, Lim CS, Abu Bakar CM, et al. Rice millers' syndrome: a preliminary report. Br J Ind Med. 2012;41(4):445–9. 9. International Labour Office. Recording and
notification of occupational accidents and diseases; An ILO code of practice. 1996; Available at: http://www.ilo.org/wcmsp5/groups/public/@ed_prot ect/@protrav/@safework/documents/normativeinstr ument/wcms_107800.pdf.
10. Simpson JCG, Niven RM, Pickering CAC et al. Prevalence and predictors of work related respiratory symptoms in workers exposed to organic dusts. Occup Environ Med. 1998;55(10):668–672. 11. Desai MR, Ghosh SK. Occupational exposure to
airborne fungi among rice mill workers with special reference to aflatoxin producing A. flavus strains. Ann Agric Environ Med. 2003;10(2):159-62. 12. Fishwick D, Barber CM, Bradshaw LM, et al.
Standards of care for occupational asthma. Thorax. 2008;63(3):240–50.
13. Department of Labour. Factories (general standards of lighting) Regulations, Sri Lanka. 1965.
14. World Health Organizaton. Hazard Prevention and Control in the Work Environment: Airborne Dust. 1999; Available at: http://www.who.int/ occupational_health/publications/en/oehairbornedus t3.pdf.
15. NIOSH. Particulates not Otherwise Regulated, Respiarble: Method 0600. NIOSH Manual of Analytical Methods (NMAM). 4th ed. 1998. 3. 16. NIOSH. Particulates not Otherwise Regulated,
Total: Method 0500. NIOSH Manual of Analytical Methods (NMAM). 4th ed. 1994. 2.
18. Department of Meteorology, Sri Lanka. Summary Data-Relative Daytime Humidity and Daytime Temperature. 2014.
19. Arundel V, Sterling EM, Biggin JH. Indirect Health Effects of Relative Humidity in Indoor Environments. Environ Health Perspect. 1986;65:351-61.
20. Baughman A, Arens EA. Indoor Humidity and Human Health Part I: Literature Review of Health Effects of Humidity-Influenced Indoor Pollutants. ASHRAE Transactions. 1996;102(1):193-211. 21. Ismail AR, Rani MRA, Makhbul ZKM. A Study of
Relationship between WBGT and Relative Humidity to Worker Performance. World Acad Sci Eng Technol. 2009;3(3):257-62.
22. US Department of Labour. Heat Stress. Occupational Health and Safety Administration. 1999. Available at: https://www.osha.gov/dts/ osta/otm/otm_iii/otm_iii_4.html Accessed on 12 December 2012.
23. Urban Development Authority. City of Colombo Development Plan - Volume II. 2001. Available at: http://www.buildsrilanka.com/CDP/P4_05.htm. Accessed 18 January 2015.
24. Department of Labour. Occupational Safety & Health and Payment of Workmen’s Compensation. In: Factories Ordinance. 1950; Available at: http://www.labourdept.gov.lk/web/images/PDF_upl oad/chapter04/1_factories_ordinance_i.pd.
Accessed on 12 December 2012.
25. Vimalanathan K, Babu TR. The effect of indoor office environment on the work performance, health and well-being of office workers. J Environ Health Sci Eng. 2014;12:113.
26. World Health Organization. Occupational health; A manual for primary health care workers. 2001. Available at: http://www.who.int/occupational_ health/regions/en/oehemhealthcareworkers.pdf. Accessed 10 September 2015.
Cite this article as: Chandrathilaka KRM,