Original Research Article
Association between dietary intake and bone density among female
Students at Imam Abdulrahman Bin Faisal University, Saudi Arabia
Seham H. Alyami, Maha J. Alqahtani, Hawra H. Alsadah, Nouf A. Altumaysi,
Omar I. Abuzaid, Arafat M. Goja*
INTRODUCTION
According to the National Institute of Health (NIH), “Osteoporosis, or porous bone, is a disease characterized by low bone mass and structural deterioration of bone tissue, leading to bone fragility and an increased risk of fractures of the hip, spine, and wrist”.1 It’s more common
in women than men, especially after menopause due to the reduction in estrogen hormone levels, which is
important in the activation of vitamin D receptors (VDR).2 There are multiple risk factors, changeable and non-changeable, that can affect bone health and the progression of the disease including advanced age, menopause, Non-Hispanic white or Asian ethnic background, small bone structure, low exposure to sunlight and parents who have broken their hips are at risk that cannot be changed.3 Many studies indicate that some nutrient positively affects the bone health, these
ABSTRACT
Background: Recently, new studies have shown that the prevalence of osteoporosis and related fractures has been increased among young females. This study aimed at finding out the association between dietary intake and bone mineral density (BMD) among university Saudi female students at Imam Abdulrahman Bin Faisal University.
Methods: A cross sectional study was carried out on 104 females’ students aged 18-24 years taken randomly from Rakkah campus. Dual X-ray absorptiometry was used to evaluate BMD and body composition. A complete and valid questionnaire was used to collect the required information about socio-economic status, lifestyle, body measurements, health history data, and food habits as well as food frequency questionnaire was also used. The results were statically analyzed (SPSS, 2015 V, 23) and descriptive statistics Chi-square test and independent samples t- test were used for the statistical analysis.
Results: The results demonstrated that the majority (65%) of students have normal body mass index (18.5-24.9 kg/m2), 58% normal BMD (>-1.0 SD) and 42% have low BMD. Among the low BMD students, 4% having osteoporosis (<-2.5 SD). In the present study, 36.5%, 30.8%, 37.5% and 36.5 % of student with high BMD consumed full fat dairy products, milk, yogurt, laben, cheese, respectively, compared with 21.2%, 19.2%, 245, 29.8% of students with low BMD.
Conclusions: Higher intakes in dairy products were associated with students’ bone health. Therefore, students should be more aware of their bone health and increase their knowledge regarding protective dietary foods for bone development.
Keywords: Osteoporosis, Saudi Arabia, Dietary patterns, Body composition, BMD
Department of Clinical Nutrition, College of Applied Medical Sciences, Imam Abdulrahman Bin Faisal University, Dammam, Saudi Arabia
Received: 22 August 2019
Accepted: 19 September 2019
*Correspondence:
Dr. Arafat M. Goja,
E-mail: [email protected]
Copyright: © the author(s), publisher and licensee Medip Academy. This is an open-access article distributed under the terms of the Creative Commons Attribution Non-Commercial License, which permits unrestricted non-commercial use, distribution, and reproduction in any medium, provided the original work is properly cited.
studies mainly focused on specific nutrient including dairy products, fruits and vegetables or individual nutrients such as calcium, phosphorus, protein and vitamin D.4-6 Much research has studied the linkage between dietary patterns and bone health. Such research indicates that foods higher in fruits, grains, vegetables, fish, and low in meat, may safely maintain bone density in adults, women and elderly, while dietary patterns high in energy-based foods such as processed meats, soft drinks, fried foods, and candy appear to be inversely associated with bone health.7-10
A cross sectional study was performed on young Saudi female students and employees in Taibah University, found that the prevalence of low bone mineral density was 9% (6% for osteopenia and 3% for osteoporosis). Moreover, serum osteocalcin was high 20.67 ng/ml versus 10.7 ng/ml. This study concluded that osteocalcin is a biomarker for the detection of low bone mineral density and needs to be performed not only for the screening of older women (above 50), but also in young women.11
Several studies in the past showed that weight loss may negatively affect bone mineral density.12 Slow weight loss in addition to a diet rich in vitamin D and calcium, along with resistance training can preserve bone health or even increase bone density.13 According to that, obesity may not prevent the prevalence of osteoporosis and protect the bones. Weight loss should be encouraged to obese people if done correctly. However, more studies are needed to show the exact effect of fat mass on bone health.
A scooping review study in Saskatoon, Canada (January 2017), showed that "dietary pattern which include more fruit, vegetables, whole grains, poultry and fish, nuts and legumes, and low-fat dairy products and decrease the intake of soft drinks, fried foods, meat and processed products, sweets and desserts and refined grains would be implicated as being beneficial for bone health". Also, it shows that the early utilization of healthy bone-beneficial dietary pattern from the early years of life will improve the mineral accumulation and maintenance, which will protect human from osteoporosis in later life.14
Current treatment of osteoporosis is focused on pharmacological intervention. However, there are other options for treatment and management of this disease such as exercises and dietary pattern changes which is important for bone health. This study shows that the high-intense training improve bone and muscle density, on the other hand, it would increase the risk of trauma and bone injury, while low-intense is much safer but with lower effectiveness in developing and improving of bone and muscle mass. According to Canada’s physical activity guide, all adults are advised to practice physical activity at least 30 minutes for 5 days per week, this include elderly even if they have osteoporosis or previous fractures.15
A cross sectional and prospective research found a good linkage between consuming dairy product and body composition and weight in adolescent and children. Risk of poor bone health and other diseases increased with lowering milk consumption.4 Another systematic review study supports the good relation between consuming a dairy product such as milk and preventing osteoporosis.16
To treat osteoporosis, there should be both pharmacological and non-pharmacological treatment such as, healthy lifestyle choices, diet that contain enough calcium and vitamin D, exercising and pharmacological therapy.17
In 2016 a case control study done on 45 cases middle age with osteoporosis for 6 months to see the effect of dietary intervention and education on nutritional status and bone mineral density (BMD). The results show reduced risk of osteoporosis among subjects as well as many benefits in their nutritional status.18
In 2017 a study done about osteosarcopenic obesity (OSO) in elderly women to find the effect of this disease on the body and how can be prevented. The results found that changes in dietary patters and doing exercise can prevent OSO and maintain a healthy bone.19
As the prevalence of osteoporosis is increasing in young women, the main goal of the study was to find out the association of dietary patterns with bone health condition among the university female students.
METHODS
Study design
The study was a cross-sectional study, conducted on Saudi young female students (18-24 years) at Imam Abdulrahman Bin Faisal University (IAU) in Al-Raka campus, Eastern Province, Saudi Arabia.
Sample size
A total of 104 students were recruited randomly from Al-Rakah campus at Imam Abdulrahman Bin Faisal University, in the period from December 2017 to April 2018. The inclusion criteria were resident in Eastern Province in Saudi Arabia, healthy Saudi female students (18-24 years) and not taken vitamin D or calcium supplements. The exclusion criteria were pregnancy and lactating women, having a chronic disease or students who take steroids medication, and if taking any medications that interferes with vitamin D or calcium utilization.
Dietary assessment
anthropometrics measurement. In addition, a quantitative food-frequency questionnaire (FFQ) was used to estimate habitual dietary intake of students.
Measurement of bone mineral density
BMD (g/cm2) and bone mineral content [(BMC) g] were measured by using dual energy X-ray absorptiometry (DEXA) of each student participated in the research.
A DEXA scan compares bone density with the bone density expected according to age, gender and ethnicity. The difference is calculated as a standard deviation (SD) score.
Data presentation
All collected data from the study were compared with the standardized data using WHO, nutrient intake.
Ethical consideration
All participants were provided with formal consent with honesty, objectivity, and respect for participant property, confidentiality about the study procedure and their rights and duties.
Statistical analysis
Descriptive statistics were calculated as frequency, percentage, mean and standard deviation. The significance of the results was assessed based on p-value (<0.05) and confidence intervals. Chi-square and t-test were used for assessing the differences between studied groups. All obtained results were tabulated to obtain the results (SPSS, 2015).
RESULTS
A total of 104 students (18-24 years) of age were met the criteria of the study. The mean weight, height and BMI of students with high BMD were mean±SD=59.8±16.0, 159.6±6.7 and 23.2±5.6 respectively, while students with low BMD were 54.9±13.2, 157.4±5.4 and 22.2±5.4 respectively. The results of the current study showed the BMD (g/cm2) differs significantly (p-value<0.05) between both groups (high BMD and low BMD), and most of the students belong to high BMD compared to low BMD. No significantly different showed in fat body mass (kg/m2) and lean body mass (kg) between both groups (Table 1).
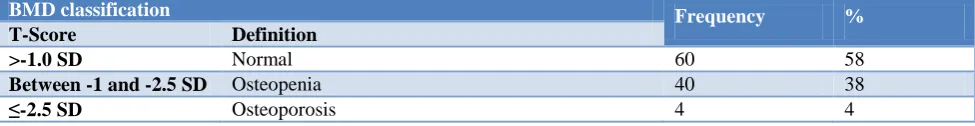
Figure 1: Prevalence of bone density among IAU students.
According to world health organization (WHO) classification of bone status, the participants were categorized as osteoporosis n=1(4%), osteopenia n=13 (52%) and normal n=11 (44%) (Table 2 and Figure 1). 58% of the students with high BMD, while 42% of students with the low BMD.
Table 1: General characteristics of the subjects.
Variables High BMD±Std. Low BMD±Std. P value Sig.
Weight 59.8±16.0 54.9±13.2 1.628 0.11
Height 159.6±6.7 157.4±5.4 1.799 0.08
BMI 23.2±5.6 22.2±5.4 0.930 0.36
Bone mineral density (g/cm2) 1.4±1.6 0.97±0.1 2.115 0.04*
Total body fat (%) 38.7±6.8 37.5±6.7 0.889 0.37
Fat body mass (kg/m2) 9.7±4.0 8.5±3.8 1.471 0.14
Lean body mass (kg) 14.5±1.9 16.1±17.6 -0.569 0.55
The data is presented as mean±standard deviation or number (%). BMD=Bone mineral density; BMI=Body mass index; Sig: significance. *= ≤0.05.
Table 2: BMD level among IAU university students according to the WHO classification.
BMD classification Frequency %
T-Score Definition
>-1.0 SD Normal 60 58
Between -1 and -2.5 SD Osteopenia 40 38
≤-2.5 SD Osteoporosis 4 4
0% 20% 40% 60%
Normal Osteopenia Osteoporosis
Table 3 shows the effect of meal and snack pattern on bone mineral density. It has been found that 34.6% of the participants with higher bone mineral density consume three meals or more per day when compared with 20.2% of participants low bone mineral density. For skipping meals, the participants with higher BMD skip meal more than those with low BMD. Moreover, when looking to snack consumption of low bone mineral group, it
revealed that 28.8% of them consume snacks between meals compared with the 40.4% of those with high bone mineral density group. Among them, chocolate is the most consumed type of snack (29.8 and 24.0%) in both high and low bone mineral density, respectively. Fruit (s) and vegetables come as the second preferable choice of snack type; it’s mainly consumed by 20.2% of students with the high BMD groups compared with 4.8% of low BMD groups.
Table 3: Results of meals and snack pattern.
Variable High BMD
No (%)
Low BMD
No (%) P value Sig.
Meal number
One meal 0 (0.0) 2 (1.9)
4.85 0.18 Two meals 24 (23.1) 21 (20.2)
Three meals 30 (28.8) 15 (14.4) More than three 6 (5.8) 6 (5.8)
Skipped meal
breakfast 13 (12.6) 9 (8.7)
0.36 0.94 Lunch 18 (17.5) 11 (10.7)
Dinner 18 (17.5) 15 (15.6) None 11 (10.7) 8 (7.80)
Snack
Yes 42 (40.4) 30 (28.8)
0.75 0.68 No 1 (1.0) 2 (1.9)
Sometimes 17 (16.3) 12 (11.5)
Snack type
None 1 (1.0) 1 (1.0)
6.04 0.19 Chocolate 31 (29.8) 25 (24.0)
Chips 5 (4.80 9 (8.7) Fruit and vegetables 16 (15.4) 5 (4.8) Others 7 (6.7) 4 (3.8)
Table 4: Results of dairy products consumption among the subjects.
Variable High BMD
N (%)
Low BMD
N (%) P value Sig.
Milk
Full fat 38 (36.5) 22 (21.2)
5.6 0.13 Low fat 16 (15.4) 10 (9.6)
None 5 (4.8) 11 (10.6)
Yogurt
Full fat 32 (30.8) 20 (19.2)
2.3 0.50 Low fat 21 (20.2) 16 (15.4)
None 6 (5.8) 8 (7.7)
Laben
Full fat 39 (37.5) 25 (24)
1.71 0.42 Low fat 10 (9.6) 12 (11.5)
None 11 (10.6) 7 (6.7)
Cheese
Full fat 38 (36.5) 31 (29.8)
1.96 0.58 Low fat 14 (13.5) 10 (9.6)
None 6 (5.8) 3 (92.9)
Table 4 shows dairy fat content and its association with bone mineral density. The full fat of milk, yogurt laben and cheese are the most consumed type of fat dairy product in both groups (high MBD, and low BMD) with the (36.5%, 21.2%), (30.8%, 19.2%), (37.5%, 24%), (36.5%, 29.8%) respectively.
Tables 5 shows that students who have higher BMD in total (46.1%) were more active and exercise compared (31.7%) to low BMD group. Among them, walking is the
most practices exercise by (36.5%, 27.9%) in both high and low bone mineral density, respectively. The time of practices was significantly different (p<0.05) between both groups, and most of the participants in both groups were found to be preferable once in week among both groups.
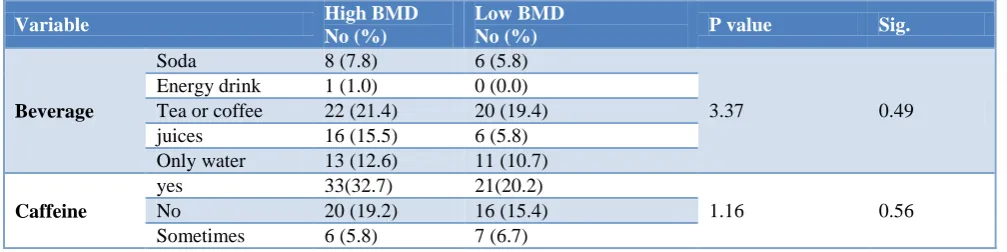
shown in table 6. With respect to caffeine consumption, 32.7% of students with high BMD consumed caffeine
regularly compared to 20.2% of low BMD group.
Table 5: Physical activity and practices among the subjects.
Variable High BMD
No (%)
Low BMD
No (%) P value Sig.
Type of physical activity
None 12 (11.5) 11 (10.6)
2.33 0.66 Walking 38 (36.5) 29 (27.9)
Running 5 (4.8) 2 (1.9) Swimming 2 (1.9) 0 (0) Dance 3 (2.9) 2 (1.9)
Time of practices in week
Once 32(30.8) 22 (21.2)
15.31 0.002* Twice 10 (9.6) 8 (7.7)
Three times 15 (14.4) 2 (1.9) More 3 (2.9) 12 (11.5)
Table 6: Effect of beverage, soft drink and caffeine on BMD.
Variable High BMD
No (%)
Low BMD
No (%) P value Sig.
Beverage
Soda 8 (7.8) 6 (5.8)
3.37 0.49 Energy drink 1 (1.0) 0 (0.0)
Tea or coffee 22 (21.4) 20 (19.4) juices 16 (15.5) 6 (5.8) Only water 13 (12.6) 11 (10.7)
Caffeine
yes 33(32.7) 21(20.2)
1.16 0.56 No 20 (19.2) 16 (15.4)
Sometimes 6 (5.8) 7 (6.7)
DISCUSSION
The purpose of this study was to examine the relationship between BMD and dietary patterns. Most of the female students have normal BMI (18.5-24.9) with normal bone mineral density (BMD) (>-1.0 SD) and a percentage of 62% and 58% respectively. There was a higher rate of early stage of osteoporosis (38% osteopenia) in addition to 4% of actual osteoporosis (T-score<-2.5 SD) among female students. The study indicated that the prevalence of osteoporosis rate is increasing in future even in young females. 20 The results agreed with the study conducted at Al-Taif University.11 Another study supported these findings with 52% of them were osteopenia, 44% normal and 4% osteoporosis.21 This is mainly due to inadequate dietary intake of calcium as well as the influence of body composition on BMD, and this more obviously due to significant differences (p<0.04) in BMD between high BMD and low BMD groups, as its apparent that small body size and underweight can negatively affect BMD.22 A meta-analysis done to quantify the effect of low BMI on fracture risk and it concluded the same results, which can worsen bone health and increase fracture risk.23
The results also show the relation between body composition and BMD, and this match with studies, which shows that there is a positively relationship between total body fat, fat body mass (kg/m2), lean mass and muscle strength with BMDs.24-26
In the present study, the content of fat among dairy products as well as animal protein was not significant with BMD. However, the relationship between dietary fat and bone health is controversial.27 In regard to other dietary patterns, the results found that high intake of soft drinks, coffee, juice and fast/fried foods can adversely impact bone health.9,28 Although, there wasn’t significant values between groups. This could be due to underreporting or lack of credibility when answering the questionnaire. Moreover, fruit and vegetable consumption have been shown positively affect BMD.29 In this study, the choices of snack (chocolate, fruit and vegetables, chips and others) was examined among the study groups. The preferable choices in both groups were chocolate, fruit and vegetables, others then chips, respectively. But there was no significant difference between the groups (p=0.19).
consumes fruit and vegetables as snack more than low BMD group by15.4% and 4.8%, respectively. Fruit and vegetables are rich in nutrients necessary for bone health, including potassium and magnesium, vitamin C, vitamin K, folate, and carotenoids and phytochemical which shows positive link between fruit and vegetable intake and bone health can be found in the results of the dietary approaches to stopping hypertension (DASH) and DASH-sodium intervention trials. 31
Data in the present study showed that people with higher BMD tend to eat healthy food at home and not fat food. Supporting this finding, a cross-sectional observational data showed that neighborhood exposure to healthy specialty stores was associated with higher BMD, while neighborhoods exposure to fast-food outlets was associated with lower BMD.32 The result shows that larger group of people consumed breakfast had high BMD and people with low BMD tend to skip breakfast meal. This finding, agreed with a cross-sectional study was done with 275 female students in Tokyo, the total hip BMD in participants who skipped breakfast three or more times was significantly lower than in those who did not skip breakfast (p=0.007).33
Data shows significant relation between BMD and duration of exercise per week (p=0.002), which agree with study conducted in King Saud university in Riyadh, bone metabolism markers correlated positively with BMD, in physically active participants and negatively with osteoporosis in all stages.34
Limitations
One of the limitations of this study is only using FFQ, which could be more accurate, is using other food dairy or 24 hour recall. However, future evidence supporting these findings as well as the effect of other nutrients on bone health is needed.
CONCLUSION
In conclusion, 42% of university female students participated in this study are classifies as osteopenia and osteoporosis, which could be indicate to the low intakes of dietary food that maintains and build bones such as dietary calcium and vitamin D among female students, in addition to some other factors as lifestyle may have negative effects on bone mineral density in young female. The present study showed that osteoporosis is a serious condition, not only in older women, but also among young women. These findings suggest that students should be more aware of their bone health and increase their knowledge regarding that, future research is needed to make investigate other factors associated with bone density especially among young females.
ACKNOWLEDGEMENTS
The authors would like to thank the department of clinical nutrition for providing all the facilities and the thanks also extend to Dr. Adil Othman (Radiology Department) for his great helps in dual X-ray absorptiometry analysis. The authors would also like to thank all the doctors as well as our colleagues who participated in the research project.
Funding: No funding sources Conflict of interest: None declared
Ethical approval: The study was approved by the Institutional Ethics Committee
REFERENCES
1. National Institute of Health (NIH). Fact sheet: osteoporosis overview, 2015. Available at: URL https://www.bones.nih.gov/healthinfo/bone/osteopor osis/overview. Accessed on 8 October 2017. 2. Nandi A, Sinha N, Ong E, Sonmez H, Poretsky L. Is
there a role for vitamin D in human reproduction?. Hormone Molecular Biol Clin Investigat. 2016;25(1):15-28.
3. National Osteoporosis Foundation (NOF). What is osteoporosis and what causes it?, 2017. Available at: URL https://www.nof.org/patients/what-is-osteoporosis/. Accessed on 2 October 2017.
4. Spence LA, Cifelli CJ, Miller GD. The role of dairy products in healthy weight and body composition in children and adolescents. Curr Nutr Food Sci. 2011;7(1):40-9.
5. Ito S, Ishida H, Uenishi K, Murakami K, Sasaki S. The relationship between habitual dietary phosphorus and calcium intake, and bone mineral density in young Japanese women: a cross-sectional study. Asia Pac J Clin Nutr. 2011;20(3):411-7. 6. Hu FB. Dietary pattern analysis: a new direction in
nutritional epidemiology. Curr Opin Lipidol. 2002;13(1):3-9.
7. Langsetmo L, Poliquin S, Hanley DA, Prior JC, Barr S, Anastassiades, et al. Dietary patterns in Canadian men and women ages 25 and older: relationship to demographics, body mass index, and bone mineral density. BMC Musculoskelet Disord. 2010;11:20.
8. Kontogianni MD, Melistas L, Yannakoulia M, Malagaris I, Panagiotakos DB, Yiannakouris N. Association between dietary patterns and indices of bone mass in a sample of Mediterranean women. Nutr. 2009;25(2):165-71.
9. Hardcastle AC, Aucott L, Fraser WD, Reid DM, Macdonald HM. Dietary patterns, bone resorption and bone mineral density in early post-menopausal Scottish women. Eur J Clin Nutr. 2011;65(3):378-85.
osteoporosis study. Am J Clin Nutr. 2002;76(1):245-52.
11. Zeidan ZA, Sultan IE, Guraya SS, Al-Zalabani AH, Khoshhal KI. Low bone mineral density among young healthy adult Saudi women: Prevalence and associated factors in the age group of 20 to 36 years. Saudi Med J. 2016;37(11):1225-33.
12. Zibellini J, Seimon R, Lee C, Gibson AA, Hsu M, Shapses SA, et al. Does diet-induced weight loss lead to bone loss in overweight or obese adults?. A systematic review and meta-analysis of clinical trials. J Bone Miner Res. 2015;30(12):2168-78. 13. Hunter GR, Plaisance EP, Fisher G. Weight loss and
bone mineral density. Curr Opin Endocrinol Diabetes Obes. 2014;21(5):358-62.
14. Movassagh EZ, Vatanparast, H. Current evidence on the association of dietary patterns and bone health: a scoping review. Adv Nutr. 2017;8(1):1-16. 15. Senderovich H, Tang H, Belmont S. The Role of exercises in osteoporotic fracture prevention and current care gaps. Where are we now?. Recent updates. Rambam Maimonides Med J. 2017;8(3):1-14.
16. Hiligsmann M, Neuprez A, Buckinx F, Locquet M, Reginster JY. A scoping review of the public health impact of vitamin D-fortified dairy products for fracture prevention. Arch Osteoporos. 2017;12(1):57-63.
17. Ivanova S, Vasileva L, Ivanova,S, Peikova L, Obreshkova D. Osteoporosis: therapeutic options. Folia Med (Plovdiv). 2015;57(3-4):181-90.
18. Zhao C, Zhou R, Tian Y, Tang Y, Ning H, Liu H. Effects of the nutritional education and dietary intervention on nutritional status and bone mineral density of middle-aged and senile patients with osteoporosis. Wei Sheng Yan Jiu. 2016;45(2):230-5. 19. Nasabian J, Inglis JE, Kelly O, Ilich JZ.
Osteosarcopenic obesity in women: impact, prevalence, and management challenges. Int J Womens Health. 2017;9:33-42.
20. Whittle CR, Woodside JV, Cardwell CR, McCourt HJ, Young IS, Murray LJ, at al. Dietary patterns and bone mineral status in young adults: the Northern Ireland Young Hearts Project. Br J Nutr. 2012;108(8):1494-504.
21. Alassaf AS, Albahussain FI, Alhmli HF, Almohaisen NA, Alotaishan SM. Prebiotic Effect on Bone Health among Female Students, University of Dammam, Saudi Arabia. Int J Scientific Res. 2016;5(10):530-2.
22. Lim J, Park HS. Relationship between underweight, bone mineral density and skeletal muscle index in premenopausal Korean women. Int J Clin Practice. 2016;70(6):462-8.
23. De Laet C, Kanis JA, Oden A, Johanson H, Johnell O, Delmas P, et al. Body mass index as a predictor
of fracture risk: a meta-analysis. Osteoporos Int. 2005;16(11):1330-8.
24. Andreoli A, Bazzocchi A, Celi M, Lauro D, Sorge R, Tarantino U, et al. Relationship between body composition, body mass index and bone mineral density in a large population of normal, osteopenic and osteoporotic women. La Radiologia Medic. 2011;116(7):1115-23.
25. He H, Liu Y, Tian Q, Papasian CJ, Hu T, Deng HW. Relationship of sarcopenia and body composition with osteoporosis. Osteoporos Int. 2016;27(2):473-82.
26. Salamone L, Glynn N, Black D, Epstein R, Palermo L, Meilahn E, et al. Body composition and bone mineral density in premenopausal and early perimenopausal women. J Bone Mineral Res. 2009;10(11):1762-8.
27. Denova-Gutierrez E, Munoz-Aguirre P, Shivappa N, Hebert JR, Lizbeth Tolentino-Mayo L, et al. Dietary inflammatory index and type 2 diabetes mellitus in adults: the diabetes mellitus survey of Mexico city. Nutrients. 2018;10(4):385.
28. Okubo H, Sasaki S, Horiguchi H, Oguma E, Miyamoto K, Hosoi Y, et al. Dietary patterns associated with bone mineral density in premenopausal Japanese farmwomen. Am J Clin Nutr. 2006;83(5):1185-92.
29. McGartland CP, Robson PJ, Murray LJ, Cran GW, Savage MJ, Watkins DC, et al. Fruit and vegetable consumption and bone mineral density: the Northern Ireland Young Hearts Project. Am J Clin Nutr. 2004;80(4):1019-23.
30. Park S, Joo S, Min H, Park JK, KimY, Kim SS, et al. Dietary Patterns and Osteoporosis Risk in Postmenopausal Korean Women. Osong Public Health Res Perspect. 2012;3(4):199-205.
31. New SA. Intake of fruit and vegetables: implications for bone health. Proc Nutr Soc. 2003;62(4):889-99. 32. Vogel C, Parsons C, Godfrey K, Robinson S,
Harvey NC, Inskip H, eta l. Greater access to fast-food outlets is associated with poorer bone health in young children. Osteoporos Int. 2016;27(3):1011-9. 33. Kuroda T, Onoe Y, Yoshikata R, Ohta H.
Relationship between skipping breakfast and bone mineral density in young Japanese women. Asia Pac J Clin Nutr. 2013;22(4):583-9.
34. Alghadir AH, Gabr SA, Al-Eisa, E. Physical activity and lifestyle effects on bone mineral density among young adults: sociodemographic and biochemical analysis. J Phys Therap Sci. 2015;27(7):2261-70.