Raut MK et al. Int J Community Med Public Health. 2018 May;5(5):1844-1858
http://www.ijcmph.com pISSN 2394-6032 | eISSN 2394-6040
Original Research Article
Monitoring of health and nutrition sustainable development goals and
indicators: a case of estimation of denominators in thirteen
100 million+ countries for the mid-year of 2017
Manoj Kumar Raut
1*, Daliya Sebastian
2, Ananta Basudev Sahu
3INTRODUCTION
Program monitoring and evaluations are the means to understand a program. Program evaluation is periodic, while program monitoring is continuous. For program monitoring, there is a need to have data on the population group, which is the target audience for receiving the
program. This is usually available through population censuses, which with quinquennial or decadal. But, during the inter-censal period, there is a need to obtain data on denominators for monitoring the program to enable effective course corrections to achieve the program objective, outputs and outcomes. This is an attempt to devise a methodology to arrive at these denominators for program monitoring.
ABSTRACT
Background: The success of any program is measured by continuous monitoring through service statistics for a periodic oversight and through evaluation surveys to measure the relevance, effectiveness, efficiency and impact of activities in the light of specified objectives. Service statistics need a lot of indicators to be tracked on a regular basis. The service statistics provide us with numerators. To understand the numerators more meaningfully, we need to standardize them by using specific denominators. So, denominators have to be estimated, which can enable computation of indicators for monitoring purposes. Census and large scale sample surveys provide proportions to calculate denominators for program monitoring purposes.
Methods: This paper uses demographic techniques to estimate denominators for the thirteen 100 million plus countries as of UN projections, 2017 of Philippines, Ethiopia, Japan, Mexico, Russian Federation, Bangladesh, Nigeria, Pakistan, Brazil, Indonesia, United States of America, India and China.
Results: The denominators have been estimated for number of live births, number of annual pregnancies, the first 1,000 days, children and women of reproductive age (15 to 49 years), pregnant, lactating, pregnant and non-lactating women, elderly in the age group of 60+ years.
Conclusions: The estimations of denominators at the sub-national levels becomes quite challenging due to the scarce availability of data to be used as proportions for different population groups. But, once, the methodology is improved with appropriate data, it could serve as a boon for annual program monitoring process at multiple data time points between two national surveys and between two consecutive censuses.
Keywords: Demographic techniques, Estimation of denominators, Program planning and monitoring
1
Research and Evaluation, Asia, Nutrition International, Asia Regional Office, New Delhi, India
2
International Centre for Research on Women, New Delhi, India
3
Monitoring and evaluation, Directorate of ICDS, Bhopal, Madhya Pradesh, India
Received: 29 January 2018 Revised: 12 March 2018 Accepted: 14 March 2018
*Correspondence: Dr. Manoj Kumar Raut,
E-mail: [email protected]
Copyright: © the author(s), publisher and licensee Medip Academy. This is an open-access article distributed under the terms of the Creative Commons Attribution Non-Commercial License, which permits unrestricted non-commercial use, distribution, and reproduction in any medium, provided the original work is properly cited.
International Journal of Community Medicine and Public Health | May 2018 | Vol 5 | Issue 5 Page 1845
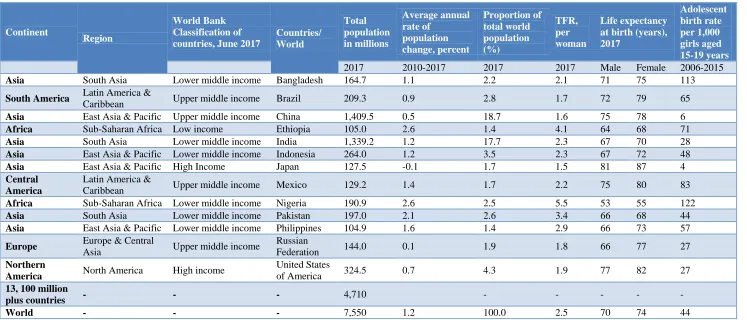
Table 1: Demographic profile of thirteen, 100 million plus countries in the world, 2017.
Continent
Region
World Bank Classification of countries, June 2017
Countries/ World
Total population in millions
Average annual rate of
population change, percent
Proportion of total world population (%)
TFR, per woman
Life expectancy at birth (years), 2017
Adolescent birth rate per 1,000 girls aged 15-19 years
2017 2010-2017 2017 2017 Male Female 2006-2015
Asia South Asia Lower middle income Bangladesh 164.7 1.1 2.2 2.1 71 75 113
South America Latin America &
Caribbean Upper middle income Brazil 209.3 0.9 2.8 1.7 72 79 65
Asia East Asia & Pacific Upper middle income China 1,409.5 0.5 18.7 1.6 75 78 6
Africa Sub-Saharan Africa Low income Ethiopia 105.0 2.6 1.4 4.1 64 68 71
Asia South Asia Lower middle income India 1,339.2 1.2 17.7 2.3 67 70 28
Asia East Asia & Pacific Lower middle income Indonesia 264.0 1.2 3.5 2.3 67 72 48
Asia East Asia & Pacific High Income Japan 127.5 -0.1 1.7 1.5 81 87 4
Central America
Latin America &
Caribbean Upper middle income Mexico 129.2 1.4 1.7 2.2 75 80 83
Africa Sub-Saharan Africa Lower middle income Nigeria 190.9 2.6 2.5 5.5 53 55 122
Asia South Asia Lower middle income Pakistan 197.0 2.1 2.6 3.4 66 68 44
Asia East Asia & Pacific Lower middle income Philippines 104.9 1.6 1.4 2.9 66 73 57
Europe Europe & Central
Asia Upper middle income
Russian
Federation 144.0 0.1 1.9 1.8 66 77 27
Northern
America North America High income
United States
of America 324.5 0.7 4.3 1.9 77 82 27
13, 100 million
plus countries - - - 4,710 - - - - -
World - - - 7,550 1.2 100.0 2.5 70 74 44
The availability of denominators on a regular basis is a necessity for programmatic purposes. This is usually available through population censuses, which is quinquennial or decadal. Censuses are quite expensive and are conducted non-annually at an interval of five or ten years. So, there is a need to project population at national as well as sub-national levels and estimate age specific denominators during the inter-censal period. Though there have been methods to estimate denominators at national and sub-national levels. There is still an unmet need to have a standardized method of estimation of denominators.
This paper uses demographic techniques to estimate denominators for the thirteen 100 million plus countries as of UN projections, 2017 of Philippines, Ethiopia, Japan, Mexico, Russian Federation, Bangladesh, Nigeria, Pakistan, Brazil, Indonesia, United States of America, India and China. Seven of these countries hail from Asia, two from Africa, one each from north, south and central America and Europe. Among these 13 countries, there are 2 billion plus and 11, 100 million plus countries, which constitute about 62% of the total population of the world, with about 4.71 billion population. They constitute 55% of the total under five population in the world. 58.1% and 58.6% of the adolescents and youth respectively reside here. 54.6% of the births and pregnancies are from these 13 countries. 57.4% and 60.6% of the adolescent girls 10 to 19 years of age and women of reproductive age of 15 to 49 years reside in these countries respectively.1 These countries belong to different regions and different economies.
Study objectives
In order to devise a methodology to estimate denominators for program monitoring, population data from thirteen 100 million plus countries has been used as an example with data validation from the smallest health catchment areas from the two countries of Indonesia and Philippines to use them as inputs for program planning and monitoring.
METHODS
This paper uses demographic techniques to estimate denominators for the thirteen 100 million plus countries as of UN projections, 2017 of Philippines, Ethiopia, Japan, Mexico, Russian Federation, Bangladesh, Nigeria, Pakistan, Brazil, Indonesia, United States of America, India and China. Seven of these countries hail from Asia, two from Africa, one each from north, south and central America and Europe. The denominators have been estimated for monitoring 2 goals out of the 17 Sustainable Development Goals (SDGs) and 169 targets which have been announced to demonstrate the scale and ambition of this new universal Agenda since the end year of Millennium Development Goals (MDGs) in 2015. These seek to build on the MDGs and complete what they did not achieve. They seek to realize the human rights of
all and to achieve gender equality and the empowerment of all women and girls. They are integrated and indivisible and balance the three dimensions of sustainable development: the economic, social and environmental.
The age wise denominators have been computed under certain assumptions. The life cycle approach can be best understood by example of childhood malnutrition. The first 1,000 days ranging from conception to the end of the second year of life is crucial for any intervention to ensure adequate nutrition and development, which will bring benefits throughout life. Focusing on this period increases the child’s chance of having a healthy and productive life in the future, and helps to break the inter-generational cycle of poverty. It is also known that maternal nutrition is an important determinant of child malnutrition. Many children are born malnourished because their mothers are malnourished, highlighting the significance of nutrition for women of childbearing age. The nutritional status of the women is a result of interactions among many risk factors like access to food, disempowerment, customs and traditions, nutritional demands of frequent pregnancies and lactation, and access to health services. Therefore, to tackle the issue of malnutrition, we need to have a life cycle approach – care during intrauterine life, the vulnerable first few years of life and the most neglected adolescent period. So, in this paper, we have tried to estimate the denominators for all these groups for the purpose of monitoring, which could be used at sub-national levels also.
The time periods considered here are based on the following references and assumptions: The calculation of month has been considered here as 30 days based on the sidereal year (the orbital period of the earth around the sun, taking the stars as a reference frame) of 365.25 days or 365 days and 6 hours, which comes to 365.25 days /12 months = 30.4375 days rounded off to 30 days in a month. The neonatal period is considered from birth through 27 days, 23 hours, 59 minutes, while the Post Neonatal period is considered from the end of 28th day through 364 days and the infant period is considered as 364 days, 23 hours, 59 minutes from the moment of birth. The World Health Organization (WHO defines adolescents as those people between 10 and 19 years of age. Youth is defined by the United Nations as 15 to 24 years and young people as 10 to 24 years, a term used by WHO and others to combine adolescents and youth. The World Health Organization (WHO) defines adolescents as those people between 10 and 19 years of age. The great majority of adolescents are, therefore, included in the age-based definition of “child”, adopted by the Convention on the Rights of the Child as a person under the age of 18 years. All the computations have been carried out in Microsoft Excel 2013. The formula for the computation of the denominators are as follows:
International Journal of Community Medicine and Public Health | May 2018 | Vol 5 | Issue 5 Page 1847
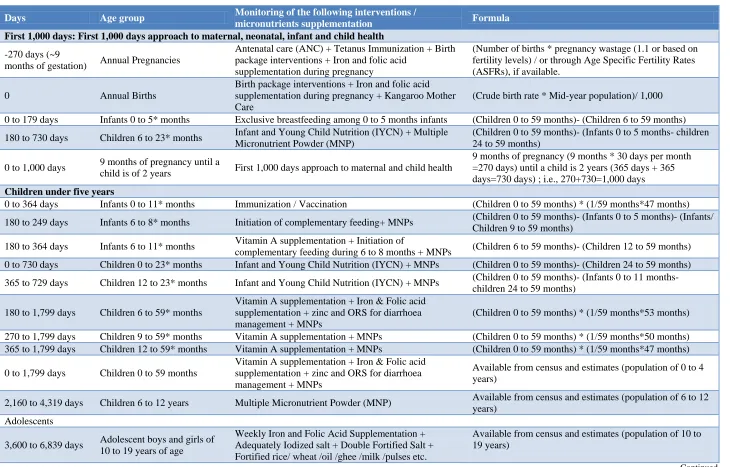
Table 2: Age specific nutrition and health Indicators and suggested methodology for estimation in a life cycle holistic approach.
Days Age group Monitoring of the following interventions /
micronutrients supplementation Formula
First 1,000 days: First 1,000 days approach to maternal, neonatal, infant and child health
-270 days (~9
months of gestation) Annual Pregnancies
Antenatal care (ANC) + Tetanus Immunization + Birth package interventions + Iron and folic acid
supplementation during pregnancy
(Number of births * pregnancy wastage (1.1 or based on fertility levels) / or through Age Specific Fertility Rates (ASFRs), if available.
0 Annual Births
Birth package interventions + Iron and folic acid supplementation during pregnancy + Kangaroo Mother Care
(Crude birth rate * Mid-year population)/ 1,000
0 to 179 days Infants 0 to 5* months Exclusive breastfeeding among 0 to 5 months infants (Children 0 to 59 months)- (Children 6 to 59 months)
180 to 730 days Children 6 to 23* months Infant and Young Child Nutrition (IYCN) + Multiple Micronutrient Powder (MNP)
(Children 0 to 59 months)- (Infants 0 to 5 months- children 24 to 59 months)
0 to 1,000 days 9 months of pregnancy until a
child is of 2 years First 1,000 days approach to maternal and child health
9 months of pregnancy (9 months * 30 days per month =270 days) until a child is 2 years (365 days + 365 days=730 days) ; i.e., 270+730=1,000 days Children under five years
0 to 364 days Infants 0 to 11* months Immunization / Vaccination (Children 0 to 59 months) * (1/59 months*47 months)
180 to 249 days Infants 6 to 8* months Initiation of complementary feeding+ MNPs (Children 0 to 59 months)- (Infants 0 to 5 months)- (Infants/ Children 9 to 59 months)
180 to 364 days Infants 6 to 11* months Vitamin A supplementation + Initiation of
complementary feeding during 6 to 8 months + MNPs (Children 6 to 59 months)- (Children 12 to 59 months) 0 to 730 days Children 0 to 23* months Infant and Young Child Nutrition (IYCN) + MNPs (Children 0 to 59 months)- (Children 24 to 59 months)
365 to 729 days Children 12 to 23* months Infant and Young Child Nutrition (IYCN) + MNPs (Children 0 to 59 months)- (Infants 0 to 11 months- children 24 to 59 months)
180 to 1,799 days Children 6 to 59* months
Vitamin A supplementation + Iron & Folic acid supplementation + zinc and ORS for diarrhoea management + MNPs
(Children 0 to 59 months) * (1/59 months*53 months)
270 to 1,799 days Children 9 to 59* months Vitamin A supplementation + MNPs (Children 0 to 59 months) * (1/59 months*50 months) 365 to 1,799 days Children 12 to 59* months Vitamin A supplementation + MNPs (Children 0 to 59 months) * (1/59 months*47 months)
0 to 1,799 days Children 0 to 59 months
Vitamin A supplementation + Iron & Folic acid supplementation + zinc and ORS for diarrhoea management + MNPs
Available from census and estimates (population of 0 to 4 years)
2,160 to 4,319 days Children 6 to 12 years Multiple Micronutrient Powder (MNP) Available from census and estimates (population of 6 to 12 years)
Adolescents
3,600 to 6,839 days Adolescent boys and girls of 10 to 19 years of age
Weekly Iron and Folic Acid Supplementation + Adequately Iodized salt + Double Fortified Salt + Fortified rice/ wheat /oil /ghee /milk /pulses etc.
Available from census and estimates (population of 10 to 19 years)
Days Age group Monitoring of the following interventions /
micronutrients supplementation Formula
Women of reproductive age
5,400 to 17,639 days Women of reproductive age (15 to 49 years of age)
Daily Iron and Folic Acid Supplementation + Adequately Iodized salt + Double Fortified Salt + Fortified rice/ wheat /oil /ghee /milk /pulses etc.+ family planning
Available from census and estimates (population of 15 to 49 years)
Men aged 19 to 49 years of age
6,840 to 17,639 days Men aged 20 to 49 years of age
Life style diseases, nutritional deficiencies + Adequately Iodized salt + Double Fortified Salt + Fortified rice/ wheat /oil /ghee /milk /pulses etc.+ family planning
Available from census and estimates (population of 20 to 49 years)
Elderly
18,000 days till disappearance of life
Elderly (50+ or 60+ or 65+ years)
Life style diseases, nutritional deficiencies + Adequately Iodized salt + Double Fortified Salt + Fortified rice/ wheat /oil /ghee /milk /pulses etc.
Available from census and estimates (population of 50+, 60+ or 65+ years)
International Journal of Community Medicine and Public Health | May 2018 | Vol 5 | Issue 5 Page 1849 2. Estimated Number of annual births: (Crude birth
rate/ 1,000) * population at mid-year. Alternatively, if we have age-specific fertility rates from 15 to 49 years in seven age groups, we could compute the annual births.
3. Estimated Number of annual pregnancies: Annual number of births*1.1 (Pregnancy wastage factor, which includes estimates of stillbirths, miscarriages, induced and spontaneous abortions). This factor of 1.1 may vary with varying levels of proportion of outcomes of pregnancies.
The age specific nutrition and health Indicators and suggested methodology for estimation in a life cycle holistic approach have been presented on Table 2.
RESULTS
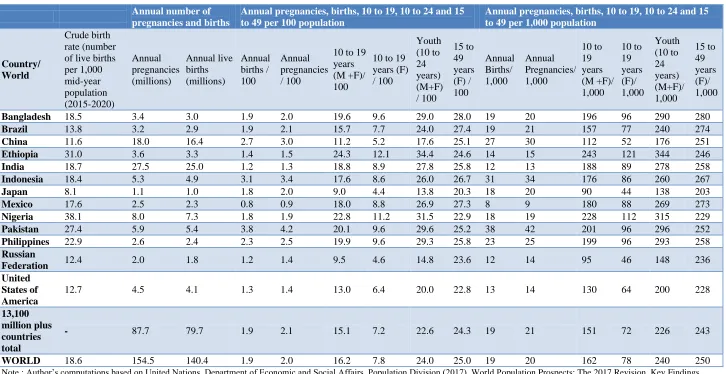
Estimated number of annual pregnancies, births and proportion of 10 to 19 years, 10 to 24 years and 15 to 49 years population
Considering the crude birth rates and adjusting it for pregnancy wastage, the estimated births and pregnancies of these 13 countries comes to 79.7 million (World: 140.4 million) and 87.7 million (World: 154.5 million) for the year 2017. The number of estimated annual births range from 1.0 million in Japan to 25.0 million births in case of India and the pregnancies range from 1.1 million in Japan to 27.5 million in India.The proportion (as a fraction of one) of population of live births comes to 1.9 per cent (World: 1.9 per cent) varying from 0.8% in Mexico to 3.8% in Pakistan. The proportion of pregnancies comes to 2.1% (World: 2.0%) varying from 0.9% in Mexico to 4.2% in Pakistan. The proportion of adolescent of both sexes comes to 15.1% (World: 16.2%) varying from 9% in Japan to 24.3% in Ethiopia. The proportion of adolescent girls aged 10 to 19 years comes to 7.2% (World: 7.8%) varying from 4.4% in Japan to 12.1% in Ethiopia. The population per 1,000 total population has also been computed. The number of annual births per thousand population vary from 8 in Mexico to 38 in Pakistan and the number of annual pregnancies vary from 9 in Mexico to 42 in Pakistan. The number of adolescents of 10 to 19 years of age of both sexes in a population of 1,000 varies from 90 in Japan to 243 in Ethiopia. The number of adolescent girls of 10 to 19 years of age in a population of 1,000 varies from 44 in Japan to 121 in Ethiopia. The women of reproductive age aged 15 to 49 years vary from 203 in Japan to 280 in Bangladesh. The number of youth of both sexes in a population of thousand varies from 138 in Japan to 344 in Ethiopia (Table 3).
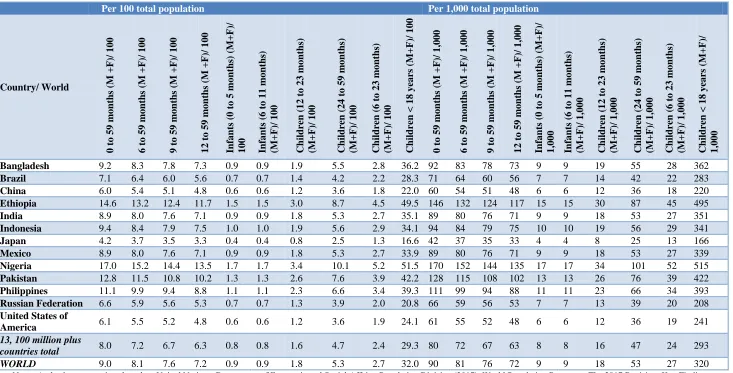
Estimated number of infants/ children under five years (0 to 59 months)
Using this method, the estimated number of infants 0 to 11 months comes to 79.4 million in these 13 countries (World:138 million) and 390 million children aged 0 to
59 months of age (World: 678 million). The number of infants varies from 2.0 million in Mexico, Japan, Philippines and Russian Federation to 24 million in India. The number of under five children varies from 5 million in Japan to 120 million in India. The proportion (as a fraction of one) of population of children aged 0 to 59 months of both sexes comes to 8 per cent (World: 9 per cent) varying from 4.2% in Japan to 17% in Nigeria. The proportion of population of infants in the age group of 0 to 11 months comes to 1.6% (World: 1.8%) varying from 0.8% in Japan to 3.4% in Nigeria. The children under the age of 18 years comes to 29.3% (World: 32%) varying from 16.6% in Japan to 51.5% in Nigeria. The population per 1,000 total population has also been computed. In order to plan programs and service delivery at a cluster of 200 households or 1,000 population, 100 households or 500 population and 50 households or 250 population, the proportions of infants and children have been computed per thousand population. The number of children 0 to 59 months vary from 42 per thousand population in Japan to 170 per thousand in Nigeria. The number of infants 0 to 5 months varies from 4 in Japan to 17 in Nigeria (Table 4 and 5).
Estimated population of adolescents (10 to 19 years), youth (10 to 24 years), children <18 years of both sexes, adolescent girls from 10 to 14 years, 15 to 19 years, 10 to 19 years of age and women of reproductive age from 15 to 49 years of age
Table 3: Estimated number of annual pregnancies, births and proportion of 10 to 19 years, 10 to 24 years and 15 to 49 years and estimated population of annual pregnancies, births, 10 to 19 years, 10 to 24 years and 15 to 49 years per 100 and per 1,000 total population, 2017.
Annual number of pregnancies and births
Annual pregnancies, births, 10 to 19, 10 to 24 and 15 to 49 per 100 population
Annual pregnancies, births, 10 to 19, 10 to 24 and 15 to 49 per 1,000 population
Country/ World
Crude birth rate (number of live births per 1,000 mid-year population (2015-2020)
Annual pregnancies (millions)
Annual live births (millions)
Annual births / 100
Annual pregnancies / 100
10 to 19 years (M +F)/ 100
10 to 19 years (F) / 100
Youth (10 to 24 years) (M+F) / 100
15 to 49 years (F) / 100
Annual Births/ 1,000
Annual Pregnancies/ 1,000
10 to 19 years (M +F)/ 1,000
10 to 19 years (F)/ 1,000
Youth (10 to 24 years) (M+F)/ 1,000
15 to 49 years (F)/ 1,000
Bangladesh 18.5 3.4 3.0 1.9 2.0 19.6 9.6 29.0 28.0 19 20 196 96 290 280
Brazil 13.8 3.2 2.9 1.9 2.1 15.7 7.7 24.0 27.4 19 21 157 77 240 274
China 11.6 18.0 16.4 2.7 3.0 11.2 5.2 17.6 25.1 27 30 112 52 176 251
Ethiopia 31.0 3.6 3.3 1.4 1.5 24.3 12.1 34.4 24.6 14 15 243 121 344 246
India 18.7 27.5 25.0 1.2 1.3 18.8 8.9 27.8 25.8 12 13 188 89 278 258
Indonesia 18.4 5.3 4.9 3.1 3.4 17.6 8.6 26.0 26.7 31 34 176 86 260 267
Japan 8.1 1.1 1.0 1.8 2.0 9.0 4.4 13.8 20.3 18 20 90 44 138 203
Mexico 17.6 2.5 2.3 0.8 0.9 18.0 8.8 26.9 27.3 8 9 180 88 269 273
Nigeria 38.1 8.0 7.3 1.8 1.9 22.8 11.2 31.5 22.9 18 19 228 112 315 229
Pakistan 27.4 5.9 5.4 3.8 4.2 20.1 9.6 29.6 25.2 38 42 201 96 296 252
Philippines 22.9 2.6 2.4 2.3 2.5 19.9 9.6 29.3 25.8 23 25 199 96 293 258
Russian
Federation 12.4 2.0 1.8 1.2 1.4 9.5 4.6 14.8 23.6 12 14 95 46 148 236
United States of America
12.7 4.5 4.1 1.3 1.4 13.0 6.4 20.0 22.8 13 14 130 64 200 228
13,100 million plus countries total
- 87.7 79.7 1.9 2.1 15.1 7.2 22.6 24.3 19 21 151 72 226 243
WORLD 18.6 154.5 140.4 1.9 2.0 16.2 7.8 24.0 25.0 19 20 162 78 240 250
International Journal of Community Medicine and Public Health | May 2018 | Vol 5 | Issue 5 Page 1851
Table 4: Estimated population of infants/ children under five years of age, 2017 (in millions).
Country/ World
Children 0 to 59 months Total
Children 6 to 59 months
Children 9 to 59 months
Children 12 to 59 months
Infants (0 to 5 months)
Infants (6 to 11 months)
Children (12 to 23 months)
Children (24 to 59 months)
Children (6 to 23 months)
Bangladesh 15.0 14.0 13.0 12.0 2.0 2.0 3.1 9.0 4.6
Brazil 15.0 13.0 13.0 12.0 2.0 2.0 3.0 8.8 4.5
China 85.0 76.0 72.0 68.0 9.0 9.0 17.3 50.6 25.9
Ethiopia 15.0 14.0 13.0 12.0 2.0 2.0 3.1 9.1 4.7
India 120.0 108.0 101.0 95.0 12.0 12.0 24.4 71.1 36.5
Indonesia 25.0 22.0 21.0 20.0 3.0 3.0 5.0 14.7 7.5
Japan 5.0 5.0 4.0 4.0 1.0 1.0 1.1 3.1 1.6
Mexico 12.0 10.0 10.0 9.0 1.0 1.0 2.4 6.9 3.5
Nigeria 32.0 29.0 27.0 26.0 3.0 3.0 6.6 19.2 9.9
Pakistan 25.0 23.0 21.0 20.0 3.0 3.0 5.1 14.9 7.7
Philippines 12.0 10.0 10.0 9.0 1.0 1.0 2.4 6.9 3.5
Russian Federation 10.0 9.0 8.0 8.0 1.0 1.0 1.9 5.7 2.9
United States of America 20.0 18.0 17.0 16.0 2.0 2.0 4.0 11.7 6.0
13, 100 million plus countries total 390.2 350.5 330.7 310.8 39.7 39.7 79.4 231.7 118.8
WORLD 678.0 609.0 575.0 540.0 69.0 69.0 137.9 402.6 206.4
Table 5: Estimated population of infants/ children in different age groups per 100 and 1,000 total population, 2017.
Per 100 total population Per 1,000 total population
Country/ World
0 to 5
9
m
onth
s (M +F
)/ 10
0
6 to 5
9
m
onth
s (M +F
)/ 10
0
9 to 5
9 m onth s (M +F )/ 10 0 12 to 59 m ont
hs (M +
F)/ 100 Infants ( 0 t o 5 mo n th s) (M + F)/
100 Infants (
6 t o 1 1 m onths ) (M +F )/ 100 Ch il dren (12 to 23 m on ths) (M +F )/ 100 Ch il dren (24 to 59 m on ths) (M +F )/ 100 Ch il dren (6 to 2 3 m onths ) (M +F )/ 100 Ch il dren < 18 y ears (M+ F)/ 100 0
to 59 m
onth
s (M +F
)/ 1,0
00
6 to 5
9
m
onth
s (M +F
)/ 1,0
00
9 to 5
9
m
onth
s (M +F
)/ 1,0
00
12 to
59 m
ont
hs (M +
F)/ 1,0 00 Infants ( 0 t o 5 mo n th s) (M + F)/
1,000 Infants (
6 t o 1 1 m onths ) (M +F )/ 1,000 Ch il dren (12 to 23 m on ths) (M +F )/ 1,000 Ch il dren (24 to 59 m on ths ) (M +F )/ 1,000 Ch il dren (6 to 2 3 m onths ) (M +F )/ 1,000 Ch il dren < 18 y ears (M+ F)/ 1,000
Bangladesh 9.2 8.3 7.8 7.3 0.9 0.9 1.9 5.5 2.8 36.2 92 83 78 73 9 9 19 55 28 362
Brazil 7.1 6.4 6.0 5.6 0.7 0.7 1.4 4.2 2.2 28.3 71 64 60 56 7 7 14 42 22 283
China 6.0 5.4 5.1 4.8 0.6 0.6 1.2 3.6 1.8 22.0 60 54 51 48 6 6 12 36 18 220
Ethiopia 14.6 13.2 12.4 11.7 1.5 1.5 3.0 8.7 4.5 49.5 146 132 124 117 15 15 30 87 45 495
India 8.9 8.0 7.6 7.1 0.9 0.9 1.8 5.3 2.7 35.1 89 80 76 71 9 9 18 53 27 351
Indonesia 9.4 8.4 7.9 7.5 1.0 1.0 1.9 5.6 2.9 34.1 94 84 79 75 10 10 19 56 29 341
Japan 4.2 3.7 3.5 3.3 0.4 0.4 0.8 2.5 1.3 16.6 42 37 35 33 4 4 8 25 13 166
Mexico 8.9 8.0 7.6 7.1 0.9 0.9 1.8 5.3 2.7 33.9 89 80 76 71 9 9 18 53 27 339
Nigeria 17.0 15.2 14.4 13.5 1.7 1.7 3.4 10.1 5.2 51.5 170 152 144 135 17 17 34 101 52 515
Pakistan 12.8 11.5 10.8 10.2 1.3 1.3 2.6 7.6 3.9 42.2 128 115 108 102 13 13 26 76 39 422
Philippines 11.1 9.9 9.4 8.8 1.1 1.1 2.3 6.6 3.4 39.3 111 99 94 88 11 11 23 66 34 393
Russian Federation 6.6 5.9 5.6 5.3 0.7 0.7 1.3 3.9 2.0 20.8 66 59 56 53 7 7 13 39 20 208
United States of
America 6.1 5.5 5.2 4.8 0.6 0.6 1.2 3.6 1.9 24.1 61 55 52 48 6 6 12 36 19 241
13, 100 million plus
countries total 8.0 7.2 6.7 6.3 0.8 0.8 1.6 4.7 2.4 29.3 80 72 67 63 8 8 16 47 24 293
WORLD 9.0 8.1 7.6 7.2 0.9 0.9 1.8 5.3 2.7 32.0 90 81 76 72 9 9 18 53 27 320
International Journal of Community Medicine and Public Health | May 2018 | Vol 5 | Issue 5 Page 1853
Table 6 : Estimated population of adolescents (10 to 19 years), youth (10 to 24 years), children <18 years of both sexes, adolescent girls from 10 to 14 years, 15 to 19 years, 10 to 19 years of age and women of reproductive age from 15 to 49 years of age, 2017 (in millions), 2017.
Country/ World
Adolescents (10 to 19 years, M+F)
Youth (10 to 24 years, M+F)
Children < 18 years, M+F
Early adolescence : Adolescent girls (10 to 14 years)
Late adolescence : Adolescent girls (15 to 19 years)
Early and Late Adolescence: Adolescent girls (10 to 19 years)
Total population of 15 to 49 years women of reproductive age
Bangladesh 32.3 47.8 59.6 7.9 7.9 15.8 46.0
Brazil 32.9 50.2 59.3 7.7 8.4 16.1 57.0
China 158.0 248.4 310.0 37.0 36.4 73.4 354.0
Ethiopia 25.5 36.1 52.0 6.5 6.1 12.7 26.0
India 251.9 371.7 470.6 60.1 58.9 119.0 346.0
Indonesia 46.6 68.5 90.1 11.5 11.1 22.6 71.0
Japan 11.5 17.6 21.1 2.7 2.9 5.6 26.0
Mexico 23.3 34.7 43.8 5.6 5.8 11.4 35.0
Nigeria 43.6 60.1 98.4 11.6 9.8 21.4 44.0
Pakistan 39.5 58.2 83.2 9.7 9.3 19.0 50.0
Philippines 20.8 30.7 41.2 5.1 5.0 10.1 27.0
Russian Federation 13.7 21.2 30.0 3.6 3.1 6.7 34.0
United States of America 42.1 64.9 78.2 10.2 10.4 20.6 74.0
13, 100 million plus countries total 741.8 1,062.4 1,377.9 171.5 167.1 354.5 1,189.0
WORLD 1220.2 1814.1 2,419.3 301.0 288.5 589.5 1,887.0
Table 7: Estimated number of currently pregnant women (PW), Women of reproductive age (WRA), infants and children aged 0 to 23 months per 1,000, 500 and 250 total population for the first 1,000 days monitoring and estimated number of pregnant women (PW), lactating women (LW) and pregnant and
non-lactating women (NPNL) per 1,000 total population (%) among the women of reproductive age (WRA, 15 to 49 years, 2017.
Population of first thousand (1,000) days
Population of women of reproductive age in different stages : pregnancy, lactation, no-pregnancy and no-lactation
Country/ World NFH S -4, 2015 -16 *** (C ur rentl y pr egnant o f WR A (4.4% ) Infants ( 0 t o 5 mo n th s) (M +F ) Ch il dren (6 to 2 3 m onths ) (M +F ) WR A PW + I nf ant 0 -5m + Infants/ Chi ldre n 6 -23 m (M
+ F) WR
A
: 15 t
o 4 9 yea rs (F) Nu mber of A nnu al Bir th s Nu mber of A nnu al Pregn an ci es PW @ 0.5 of the a nnu al pregnancie
s in any
g
iven
month
*
PW @
0.7 of t
he annu
al
pregnancie
s in a gi
ven month ** NFH S -4, 2015 -16 *** (C ur rentl y pr egnant o f WR A (4.4% ) NPN L ( W R A -PW (4. 4% estima te -LW ) Infant s (0 to 5 mo n th s) (M +F ) as a pr oxy f or lact at in g wom en ( LW ) WR A
: 15 t
o 4
9 yea
rs (F)
Bangladesh 12 9 28 49 280 19 20 10 14 12 259 9 280
Brazil 12 7 22 41 274 19 21 11 15 12 255 7 274
China 11 6 18 35 251 27 30 15 21 11 234 6 251
Ethiopia 11 15 45 71 246 14 15 8 11 11 220 15 246
India 11 9 27 47 258 12 13 7 9 11 238 9 258
Indonesia 12 10 29 51 267 31 34 17 24 12 245 10 267
Japan 9 4 13 26 203 18 20 10 14 9 190 4 203
Mexico 12 9 27 48 273 8 9 5 6 12 252 9 273
Nigeria 10 17 52 79 229 18 19 10 13 10 202 17 229
Pakistan 11 13 39 63 252 38 42 21 29 11 228 13 252
Philippines 11 11 34 56 258 23 25 13 18 11 236 11 258
Russian Federation 10 7 20 37 236 12 14 7 10 10 219 7 236
United States of America 10 6 19 35 228 13 14 7 10 10 212 6 228
13, 100 million plus countries average 11 8 24 43 243 19 21 11 15 11 224 8 243
WORLD per 1,000 population (~200 Households) 11 9 27 47 250 19 20 10 14 11 230 9 250
WORLD per 500 population (~100 Households) 6 5 14 24 125 9.5 10 5 7 5.5 115 4.5 125
WORLD per 250 population (~50 Households) 2.8 2.3 6.8 11.8 62.5 4.75 5 2.5 3.5 2.75 57.5 2.25 62.5
% of WRA, 15 to 49 years 4 4 11 19 100 - - 4.0 5.6 4.4 92.0 3.6 100
International Journal of Community Medicine and Public Health | May 2018 | Vol 5 | Issue 5 Page 1855
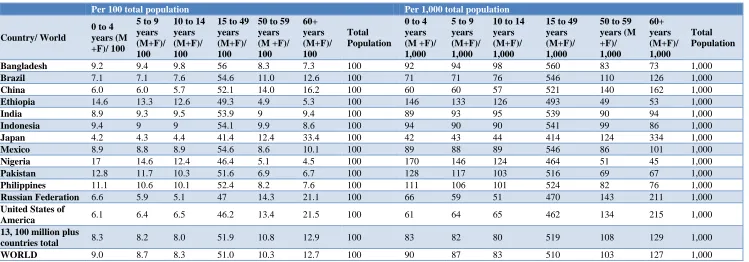
Table 8: Estimated population of major age groups of population per 100 and per 1,000 total population, 2017.
Per 100 total population Per 1,000 total population
Country/ World
0 to 4 years (M +F)/ 100
5 to 9 years (M+F)/ 100
10 to 14 years (M+F)/ 100
15 to 49 years (M+F)/ 100
50 to 59 years (M +F)/ 100
60+ years (M+F)/ 100
Total Population
0 to 4 years (M +F)/ 1,000
5 to 9 years (M+F)/ 1,000
10 to 14 years (M+F)/ 1,000
15 to 49 years (M+F)/ 1,000
50 to 59 years (M +F)/ 1,000
60+ years (M+F)/ 1,000
Total Population
Bangladesh 9.2 9.4 9.8 56 8.3 7.3 100 92 94 98 560 83 73 1,000
Brazil 7.1 7.1 7.6 54.6 11.0 12.6 100 71 71 76 546 110 126 1,000
China 6.0 6.0 5.7 52.1 14.0 16.2 100 60 60 57 521 140 162 1,000
Ethiopia 14.6 13.3 12.6 49.3 4.9 5.3 100 146 133 126 493 49 53 1,000
India 8.9 9.3 9.5 53.9 9 9.4 100 89 93 95 539 90 94 1,000
Indonesia 9.4 9 9 54.1 9.9 8.6 100 94 90 90 541 99 86 1,000
Japan 4.2 4.3 4.4 41.4 12.4 33.4 100 42 43 44 414 124 334 1,000
Mexico 8.9 8.8 8.9 54.6 8.6 10.1 100 89 88 89 546 86 101 1,000
Nigeria 17 14.6 12.4 46.4 5.1 4.5 100 170 146 124 464 51 45 1,000
Pakistan 12.8 11.7 10.3 51.6 6.9 6.7 100 128 117 103 516 69 67 1,000
Philippines 11.1 10.6 10.1 52.4 8.2 7.6 100 111 106 101 524 82 76 1,000
Russian Federation 6.6 5.9 5.1 47 14.3 21.1 100 66 59 51 470 143 211 1,000
United States of
America 6.1 6.4 6.5 46.2 13.4 21.5 100 61 64 65 462 134 215 1,000
13, 100 million plus
countries total 8.3 8.2 8.0 51.9 10.8 12.9 100 83 82 80 519 108 129 1,000
WORLD 9.0 8.7 8.3 51.0 10.3 12.7 100 90 87 83 510 103 127 1,000
Estimated number of currently pregnant women, infants and children aged 0 to 23 months per 1,000, 500 and 250 total populations for a first thousand days approach to service delivery and program monitoring
For a first thousand day approach to service delivery, rationalization of workload, we need to know the number pregnant women, number of 0 to 5 months post-partum mothers and mothers of 6 to 23 months infants/ children. The assumption here does not take into consideration, late child bearing after 49 years of age, which may be a few. Considering the recent DHS survey estimates of 4.4% of currently pregnant women, the number of currently pregnant women varies from 9 in Japan to 12 each in Bangladesh, Brazil, Indonesia and Mexico. The number of 0 to 5 months post-partum mothers as a proxy of 0 to 5 months children varies from 4 in case of Japan to 17 in case of Nigeria. The number of mothers of 6 to 23 months children varies from 13 in case of Japan to 52 in case of Nigeria.
Estimated number of pregnant women (PW), lactating women (LW) and non-pregnant and non-lactating women (NPNL) per 1,000 total population (%) among the women of reproductive age (WRA, 15 to 49 years) to monitor women of reproductive age in different stages of pregnancy, lactation and pregnant and non-lactation
In surveys and program, services delivery planning and monitoring, we also need estimates of pregnant, lactating and NPNL women. This has been estimated by different methods per thousand total populations. The annual pregnancies have been estimated per thousand total population and using three references, an estimate of 0.5 of them being pregnant in a given month or 0.7 being pregnant in a given month out of the annual estimated pregnancies and 4.4% being currently pregnant among women of reproductive age has been considered for the estimation. 0.7 is a weighted estimate of full-term pregnancies plus those pregnancies that terminate early. The estimate from using 50% of the annual pregnancies varies from 5 in Mexico to 21 in Pakistan. The estimates using 70% of the annual pregnancies varies from 6 in Mexico to 29 in Pakistan per thousand population in a given month. The survey estimate of 4.4% of women or reproductive age varies from 9 in Japan to 12 each in Bangladesh and India. The number of NPNL has been estimated by subtracting the pregnant women, lactating women from the total number of women of reproductive age in a thousand population (Table 7).
Estimated population of major age groups per 1,000 total population
The population elderly (60+ years) has also been estimated per 1,000 populations for program planning purposes. The number of 60+ years; men and women in a thousand populations varies from 45 in Nigeria to 334 in
Japan. The per cent of population of elderly (60+) varies from 4.5% in Nigeria to 33.4% in Japan with the world average being 12.7%, following the stage of demographic transition in these two countries (Table 8).
Indonesia field data validation
This was also validated at the field level in a puskesmas area, which is a health facility in Indonesia. Indonesia with a population of 264 million is an archipelago consisting of approximately 13,466 islands and is administratively divided into 34 provinces. Based on the Regulation of the Minister of Home Affairs No. 39, year 2015 regarding codes and data of Administrative Regions, Indonesia is administratively divided into 34 provinces, 514 districts/municipalities (comprising 416 districts and 98 municipalities), 7,094 sub-districts, 8,412 administrative villages (Indonesian: Kelurahan) and 74,093 villages. As of December 2013, there were 9,754 Puskesmas in the country, which provides basic and additional health programs. A puskesmas covers a number of Desa. A Desa is divided into several RW and one RW is divided into several RT based on population, reach and terrain. The values at the grassroots level health facilities in both the countries are similar to the values estimated at the macro country level. The details of population of children under five years and the proportions have been presented in the Table 9.
Philippines field data validation
International Journal of Community Medicine and Public Health | May 2018 | Vol 5 | Issue 5 Page 1857
Table 9: Population of a Puskesmas catchment area in Indonesia, as on December 2017.
Sl.
No. Desa
Total Population
0 to 59 months population
% of 0 to 5 months out of total population
0 to 5 months population
% of 0 to 5 months out of total
population
1 Sepatan 12,123 1,215 10.0 146 1.2
2 Pandok Jaya 9,922 995 10.0 120 1.2
3 Karet 35,535 3,562 10.0 429 1.2
4 Pisangan Jaya 25,100 2,516 10.0 393 1.6
5 Kayu Agung 11,948 1,197 10.0 188 1.6
6 Sarakan 12,566 1,259 10.0 197 1.6
7 Kayu Bongkok 6,091 611 10.0 95 1.6
8 Mekarjaya 9,762 978 10.0 121 1.2
Total for Sepatan Puskesmas 123,047 12,333 10.0 1,689 1.4
Indonesia 9.4 1.0
Source: Puskesmas, Sepatan
Table 10: Population of a rural health unit (RHU) in a municipality in Philippines, as on February, 2018.
Sl. No. Barangays Total Population
Number of 0 to 59 months children
% of 0 to 59 months out of total population
Number of 0 to 5 months infants
% of 0 to 5 months of the total population
1 Balaas 813 80 9.8 4 0.5
2 Balisong 2,169 240 11.1 12 0.6
3 Bogo 3,666 355 9.7 17 0.5
4 Butong 996 81 8.1 4 0.4
5 Bug-ot 911 83 9.1 2 0.2
6 Calagasan 1,094 93 8.5 7 0.6
7 Canbantug 870 98 11.3 2 0.2
8 Canbanua 2,584 202 7.8 11 0.4
9 Casay 910 86 9.5 5 0.5
10 Catang 633 73 11.5 4 0.6
11 Conalum 603 50 8.3 4 0.7
12 Jomgao 1,145 96 8.4 1 0.1
13 Lamacan 2,735 198 7.2 11 0.4
14 Lapay 704 59 8.4 2 0.3
15 Linut-od 1,057 92 8.7 3 0.3
16 Panadtaran 604 60 9.9 5 0.8
17 Tabayag 921 88 9.6 3 0.3
18 Talaga 3,617 334 9.2 18 0.5
19 Talaytay 1,738 151 8.7 3 0.2
20 Tiguib 892 110 12.3 10 1.1
21 Tulic 2,891 271 9.4 10 0.3
22 Usmad 1,173 65 5.5 3 0.3
Total for RHU-2 32,726 2,965 9.1 141 0.4
Philippines 11.1 1.1
Source: Rural Health Unit-2, Argao Municipality
DISCUSSION
Denominator estimation is carried out for program monitoring but detailed guidance on it is relatively rare in the literature. So, it is an attempt to standardize the process of denominator estimation, which could facilitate the process of program planning, budgeting and
about 200 households or about a thousand population, assuming a mean household size of about five persons per household.
CONCLUSION
Denominator estimation for program monitoring at regular intervals is a veritable necessity at every level of health system to obtain the pulse of the program, facilitating the path towards effective course correction. In order to obtain more realistic estimates at the different administrative levels, it is recommended to undertake this computation at sub-national levels, which could facilitate program planning and monitoring at sub-national levels and used for program course corrections to achieve the broader goals of SDGs.
ACKNOWLEDGEMENTS
The authors acknowledge the use of the data published on the public domain by the Department of Economic and Social Affairs, Population Division of the United Nations. The authors also acknowledge the support of the staff of the puskesmas in Indonesia and the staff of Rural Health Unit in Philippines and the colleagues of Nutrition International in India, Indonesia and Philippines.
Funding: No funding sources Conflict of interest: None declared Ethical approval: Not required
REFERENCES
1. United Nations, Department of Economic and Social Affairs, Population Division (2017). World Population Prospects: The 2017 Revision, Key Findings and Advance Tables. Working Paper No. ESA/P/WP/248.
2. United Nations, Department of Economic and Social Affairs, Population Division (2017). World Population Prospects: The 2017 Revision, Volume I: Comprehensive Tables (ST/ESA/SER.A/399). 3. United Nations, Department of Economic and Social
Affairs, Population Division (2017). World
Population Prospects: The 2017 Revision, Volume II: Demographic Profiles (ST/ESA/SER.A/400). 4. United Nations, Department of Economic and Social
Affairs, Population Division (2017). World Population Prospects: The 2017 Revision, Methodology of the United Nations Population Estimates and Projections, Working Paper No. ESA/P/WP.250. New York: United Nations.
5. World Health Organization, UNICEF, IFPRI, University of UC Davis, FANTA 2, AED, USAID, (2010). Indicators for assessing infant and young child feeding practices: Part 1: Definitions: Conclusions of a consensus meeting held 6–8 November 2007 in Washington D.C., USA.
6. World Health Organization, UNICEF, IFPRI, University of UC Davis, FANTA 2, AED, USAID, (2010). Indicators for assessing infant and young child feeding practices: Part 2: Measurement : Conclusions of a consensus meeting held 6–8 November 2007 in Washington D.C., USA.
7. Ministry of Health and Family Welfare, Government of India (2010). Guidelines for Antenatal Care and Skilled Attendance at Birth by ANM/LHVs/ SNs. Maternal Health Division, New Delhi.
8. Johns Hopkins Bloomberg School of Public Health and International Federation of Red Cross and Red Crescent Societies (2008). Public health guide in emergencies, Geneva 19 Switzerland.
9. International Institute for Population Sciences (IIPS) and ICF. 2017. National Family Health Survey (NFHS-4), 2015-16: India. Mumbai: IIPS.
10. Ministry of Health, Republic of Indonesia. Indonesia Health Profile, 2015. Available at: http://www.depkes.go.id/resources/download/pusdati n/profil-kesehatan-indonesia/indonesian%20
health%20profile%202015.pdf. Accessed on 4 January 2018.