Efficient Task Scheduling using Load Balancing
in Cloud Computing
Rupinder Kaur
Department of CSE, Baba Banda Singh Bahadur Engineering College, Fatehgarh Sahib, Punjab, India. Email: [email protected]
Dr.Kanwalvir Singh Dhindsa
Department of CSE, Baba Banda Singh Bahadur Engineering College, Fatehgarh Sahib, Punjab, India. Email: [email protected]
---ABSTRACT--- Workflow scheduling is a challenging field in computing in which tasks are scheduled according to the user requirement and it becomes costly due to the quality of service demand by the user. Cloud environment has been deployed for this work so as to reduce the overall cost. To maintain & utilize resources in the cloud computing scheduling mechanism is needed. Many algorithms and protocols are used to manage the parallel jobs and resources which are used to enhance the performance of the CPU in the cloud environment. Particles swarm Optimization (PSO) and Grey Wolf Optimization (GWO) are used for effective scheduling. This work is based on the optimization of Total execution time and total execution cost. The results of the proposed approach are found to be effective in compare to existing methods. The particle swarm optimization is initialized by using Pareto distribution. TET and TEC illustrated the minimized cost and time by using the GWO to converge the decision of virtual machine. Thus the work concludes that GWO performs better in compare to existing BAT algorithm. Keywords - Particles swarm Optimization (PSO), Grey Wolf Optimization (GWO), Virtual Machine, BAT algorithm.
--- Date of Submission: Sep 06, 2018 Date of Acceptance: Sep 15, 2018 ---
I.
INTRODUCTIONT
he cloud computing is platform on the internet which follows the concept of on-demand computing. It provides the platform where resources and data is shared with other devices. The cloud computing platform has the ability to provide the resources, storage and infrastructure to the user[1]. It provides the hardware and software platform for the applications that needs high specification system. The cloud computing is based on the concept of pay as you use the systems on cloud.Cloud computing provides the services through the internet; these service belongs to hardware and software both[2]. Cloud computing concept is growing high day by day due to its service pay per usage concept. When cloud provides the service in the form of platform it is called as Platform as a service model[3]. When cloud provides the hardware to the consumer it is called as Infrastructure as a service model. When cloud provided the software services it is also called as Software as s service. Due to huge amount of user data on the cloud network resources are not utilized properly and in results delay and service failure is occur. To avoid this problem load balancing method is used in which request from the user is distributed among different resources[4].
II.
RELATED
STUDY
Cloud supports the Multi-tenancy feature and provides the scalability and other benefits to the other users. Resource management is an important task in the multi-tenant cloud computing which is done by using the scheduling process. In this work cloud based workflow scheduling policy is
proposed for efficient computing in cloud. This policy reduces the overall workflow completion time, cost of execution and properly utilize the resources. The result of the proposed work is compared with existing approaches and algorithms. The simulation result of the proposed approach shows more effective results than the existing approaches. Zhang et al. [5] discussed the various cloud computing technologies and commercial products in detail. The commercial products have been compared on parameters like cloud provider, computing classes, target application, computation, auto scaling and storage. The research challenges presented in this work are service provisioning automation, server consolidation, virtual machine migration, energy management and data security.
resources, improved responsiveness thereby improving user experience, enabling a generation of collaborative scientific workflows and reducing the cost in challenges and opportunities in running scientific workflows on cloud. The challenges faced by the applications are architectural challenges, service challenges for integration tools, high-end computing support language-conversion challenge, challenge in compute intensive applications, challenge for data management, service management challenge.Vockler
et al. [8] highlighted a scientific application is executed on FutureGrid, Amazon EC2 cloud and NERSC’s Magellan in this paper. The result of this paper have been compared and analyzed to comprehend various challenges that came across during the process. In this work Pegasus workflow management system has been used to execute a scientific application which was used to process data from the Kepler project by NASA to find out planets similar to the earth.
Ostermann et al. [9] discussed the various features of cloud computing which help ease the execution of scientific applications. It evaluates these features by different workloads like SJSI, MJSI and SJMI on Amazon EC2 cloud platform. Different types of benchmarks like Lmbench, Bonnie, and HPC are used to evaluate the performance of EC2 cloud for scientific applications. Deelman et al. [10] discussed dependency of cost on execution models in this work. In this work, the cost is calculated as a function of number of processors. The cost of executing montage workflow has been estimated by running simulation using GridSim tool. Three montage workflows have been Remote I/O, regular and dynamic cleanup. Three montage workflow that are executed are following montage degree 1, degree 2 and degree 4. The cost of running each of the data management models have been compared graphically. To maintain the trade-off between the number of processors and reduction in execution time.
III.
PROPOSED
METHODOLOGY
This section explains the proposed work with the algorithm and flow chart of the methodology in detail.
STEP 1 :Input the workflows. STEP 2 :Parse the tasks.
STEP 3 :Task follows the Pareto distribution. STEP 4 :Provides the virtual machines according to
paths.
STEP 5 :Initialize the optimization algorithm GWO (Grey wolf optimization).
STEP 6 :Update the fitness function
STEP 7 :Optimized output of objective function. STEP 8 :Check the output is optimized or not. If yes
then analyze otherwise again initialize.
STEP 9 :Analyze the time and cost (TET and TOC)
A. PSO & GWO Algorithms
PSO is synonymous with optimizing the particle swarm. PSO is a stochastic optimization algorithm based
on the behavior of birds. It works in the same way as the genetic algorithm[11]. In PSO is initialized with a group of random particles. In each iteration, each particle is updated by the two "best" values. The first best solution shows the aptitude of the particles and this is called pbest. The second best value is followed by the optimizer is the best value. This value is called globally better (gbest). When a particle takes part of the population as its topological neighbors; The best value is a better local and is called lbest [12].
GWO: Grey Wolf optimization algorithm is a bio-inspired algorithm which is based on the leadership and hunting behavior of the wolves in the pack[13]. The grey wolves prefer to live in the pack which is a group of approximate 5-12 wolves. In the pack each member has social dominant and consisting according to four different levels[14].
B. PROPOSED ALGORITHM: PSO_GWO
Step 1: Input the mammographic images. Step 2: Apply Gray Scale on the images.
Step 3: Edge detection by using the Prewitt Filter. Step 4: For optimization input in the PSO model.
Step 5: Apply the loop in PSO model. for each particle n in S do
Step6 : for each dimension d in D do
Step7: //initialize each particle’s position and velocity Step8: yp,q= min)
Step9: = /3 , /3)
Step10: end for
Step11: //initialize particle’s best position and velocity (l+1) = (l) + (l)) + (G- (l)) New velocity
(l+1) = (l) + (l+1) Where
p denotes the particle index l denotes discrete time index zp denotes velocity of nth particle ypdenotes position of nth particle
pn denotes best position found by nth particle(personal best)
J denotes best position found by swarm(global best, best of personal bests)
J(1,2)i- random number on the interval[0,1]applied to the nth particle
Step12: =
// update global best position Step13: if ) <
Step 14: Step15: end if end for
IV.
RESULTS
&
COMPARISON
This section illustrates the performance of the proposed approach on two different workflows that are cyber shake and LIGO.
1. Comparison of BAT and PSO_GWO using CYBERSHAKE
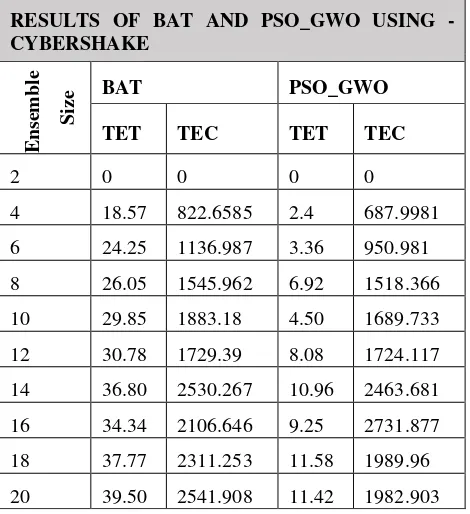
Table 1.1: Comparison table of BAT and PSO_GWO using CYBERSHAKE
The above given Table 1.1 depicts the behavior of CYBERSHAKE workflow on different virtual machines. The table represents the TET (Total Execution Time) and TEC (Total Execution Cost) results of the BAT optimization and PSO_GWO optimization algorithms.
1.1 Comparison graph of TET of both BAT and PSO_GWO using CYBERSHAKE
Fig.1.1. Comparison graph of TET of both BAT and PSO_GWO using CYBERSHAKE
In Fig. 1.1 X-axis represent the number of virtual machines and Y-axis total time of execution in graph at 2 VM execution time BAT approach is 22ms and PSO_GWO 5m sec , at 10 VMs In BAT execution time 30 ms and PSO_GWO execution time 4 ms and in 20 VMs BAT execution time 35 ms and PSO_GWO execution time 12 ms below analysis these parameter PSO_GWO perform well. These parameters PSO_GWO work well in the parameters of cost and time due to the search time optimization of swarm of particles decide by adaptive pheromones and the migration of tasks of VM depends on the transitory problem but in genetic algorithm it depends both on the candidate solution and static but the initialization of PSO_GWO depends on the distribution that depends on the normal distribution.
1.2. Comparison graph of TEC of both BAT and
PSO_GWO using CYBERSHAKE:
0 500 1000 1500 2000 2500 3000
2 6 10 14 18
T
E
C(
in $
)
Ensemble size(in no.)
BAT TEC
PSO_GWO TEC
Fig.1.2. Comparison graph of TEC of both BAT and PSO_GWO using CYBERSHAKE
In Fig. 1.2, X-axis represent the number of virtual machines and Y-axis Total cost execution in graph at 2 VM execution time BAT approach is 2$ and PSO_GWO 1$ , at 10 VMs In BAT execution time 1800$ and Step16:Initialize GWO (i=1, 2, …n)
Initialize x, X, and Y
Step 1 :Calculate fitness function for every search agent best search agent
second beat search agent Third best search agent While (T<Max iterations)
For ( in every pack)
Update current position of wolf by eq. (1) Update x, X and Y
Calculate the fitness function for all search agents
Update , , and End for
For best pack insert migration ( )
Evaluate fitness function for new individuals selection of best pack
New random individuals for migration End if
End while
RESULTS OF BAT AND PSO_GWO USING -CYBERSHAKE
E
ns
emble Size
BAT PSO_GWO
TET TEC TET TEC
2 0 0 0 0
4 18.57 822.6585 2.4 687.9981
6 24.25 1136.987 3.36 950.981
8 26.05 1545.962 6.92 1518.366
10 29.85 1883.18 4.50 1689.733
12 30.78 1729.39 8.08 1724.117
PSO_GWO execution time 1500$ and in 20 VMs BAT execution time 2500$ and PSO_GWO execution time 2000$execution cost of BAT is better than ACO. The cost of executing BAT is better than ACO because the distribution stops takes more time for VM mapping per task. This will affect the execution of the total cost because the assignment of stop to VM, but the TET always improves the importance.
2. Comparison of BAT and PSO_GWO using LIGO:
In Table 2.1 below LIGO analysis on TET and TEC parameter in different virtual machine or ensemble size.
Table 2.1: Comparison table of both BAT and PSO_GWO using LIGO
2.1 Comparison Graph of TET of BAT and PSO_GWO using LIGO :
0 50 100 150 200
2 6 10 14 18
T
E
T
(i
n
m
s)
Ensemble Size(in no.)
BAT TET PSO_GWO TET
Fig. 2.1: Comparison graph of TET of both BAT and PSO_GWO using LIGO
In Fig. 2.1 X-axis represent the number of virtual machines and Y-axis total time of execution in graph at 2 VM execution time BAT approach is 22ms and PSO_GWO 5 m sec , at 10 VMs In BAT execution time 82 ms and PSO_GWO execution time 18 ms and in 20 VMs BAT execution time 145 ms and PSO_GWO execution time 82 ms below result analysis, find that response time of PSO_GWO is more as compare to BAT in local simulation.
2.2 Comparison Graph of TEC of BAT and PSO_GWO using LIGO:
Fig. 2.2: Comparison graph of TOC of both BAT and PSO_GWO using LIGO
In Fig. 2.2 X-axis represent the number of virtual machines and Y-axis Total cost execution in graph at 2 VM execution time BAT approach is 2$ and PSO_GWO 1$ , at 10 VMs In BAT execution time 5800$ and PSO_GWO execution time 5000$ and in 20 VMs BAT execution time 12000$ and PSO_GWO execution time 11000$ below result analysis, find that response time of PSO_GWO is more as compare to BAT in local simulation.
In the result analysis process response time of PSO_GWO is higher than the BAT in the simulation process. The response time is reduced by using cloud with SLA. In addition, this work can be extended for multi-objective algorithm to get solution for load balancing and task failures.
In the proposed approach, Pareto distribution instead of random initialization. If random distributions are used, more time will be taken to converge and sometime enforces the convergence by iteration but enforcing of convergence will increase the computation and execution time therefore does not meet the deadline condition. So, task initialization is an important task as defined in this paper. Another thing represented in these graphs and tables is that PSO_GWO performs better in comparison to BAT for reduction of cost and time because of the random crossover.
RESULTS OF BAT and PSO_GWO USING –LIGO
E
ns
emble Size
BAT PSO_GWO
TET TEC TET TEC
2 0.0 0.0 0.0 0.0
4 44.91 2762.633 6.61 1467.243
6 65.89 4191.678 24.09 4022.422
8 35.66 4883.178 45.34 5699.963
10 68.82 5304.774 15.98 4708.369
12 102.39 7331.103 26.65 6271.538
14 58.96 7729.967 33.7 7550.524
16 151.28 10608.93 49.58 9948.208
18 87.77 11384.08 71.95 11188.03
V.
CONCLUSION
PSO-GWO algorithm on different workflows of the cloud network has been implemented. The worthy results are achieved because PSO (particle swarm optimization) play important role in global optimization and GWO optimize locally and we have merged the two algorithms . With the proposed approach in most of the work processes we can deliver bring down cost efficient schedule then additionally decreasing the time delay.
REFERENCES
[1] Callagha, S., Deelman, E., Gunter , D., Juve, G., Maechling, P., Brooks , C., Vahi, K., Milner, K., RobertGraves, EdwardField, Okaya, D. and Jorda,T., Scaling up workflow-based applications, Journal of Computer and System Sciences, 76( 6), 2010, 428-446.
[2] Alkhanak, C., Nabiel ,E. And Peck L., A hyper-heuristic cost optimisation approach for Scientific Workflow Scheduling in cloud computing, Future
Generation Computer Systems, pp. 5-11, 2018.
[3] Anubhav, C., Gupta, I., Singh,V. and Jana P., A GSA based hybrid algorithm for bi-objective workflow scheduling in cloud computing, Future Generation Computer Systems , 83(5), 2018, 14-26.
[4] Vinothina, V. and Sridaran, R., An Approach for Workflow Scheduling in Cloud Using ACO, Big Data
Analytics, Springer, Singapore, 2018, 525-531.
[5] Zhang, Q., Cheng, L. and Boutaba, R., Cloud computing: state-of-the-art and research challenges, Journal of internet services and applications, 1(1), 2010, 7-18.
[6] Christian, P., Pandey, S. and Buyya, R., High-performance cloud computing: A view of scientific applications, 10th International Symposium on. IEEE,
2009, 452- 460.
[7] Zhao, Y., Fei, X., Raicu, I. and Lu, S., Opportunities and challenges in running scientific workflows on the cloud In Cyber-Enabled Distributed Computing and Knowledge Discovery (CyberC), International Conference on IEEE, 2011, 455-462 .
[8] Vockler, Sonke, J., Juve, G., Deelman, E., Rynge, M. and Berriman, B., Experiences using cloud computing for a scientific workflow application, In Proceedings of the 2nd international workshop on Scientific cloud computing, 2011, 15-24.
[9] Ostermann, S., Iosup,A., Yigitbasi, N., Prodan, R., Fahringer,T. and Epema D., A performance analysis of EC2 cloud computing services for scientific computing, In International Conference on Cloud Computing, Springer, Berlin, Heidelberg, 2009, 115-131.
[10] Deelman, E., Singh, G., Livny M., Berriman, B., and Good , J., The cost of doing science on the cloud: the
montage example, In High Performance Computing, Networking, Storage and Analysis, International Conference for Ieee , 2008, 1-12.
[11] Liu, L., Zhang, M., Buyya, R. and Fan, Q., Deadline‐constrained coevolutionary genetic algorithm for scientific workflow scheduling in cloud computing, Concurrency and Computation: Practice and Experience , 29( 5), 2017, 3111-3119.
[12] Jyoti, G. and Bhathal,G., Research Paper on Genetic Based Workflow Scheduling Algorithm in Cloud Computing, International Journal of Advanced Research in Computer Science , 8(5) , 2017, 2111-2116.
[13] Kaur, P. and Mehta, S., Resource provisioning and work flow scheduling in clouds using augmented Shuffled Frog Leaping Algorithm, Journal of
Parallel and Distributed Computing , 101 , 2017,
41-50.
[14] Boloni, L. and Turgut, D., Value of information based scheduling of cloud computing resources, Future Generation Computer Systems ,
71 , 2017, 212-220.
Author Profile:
Rupinder Kaur is M.tech Research Scholar in the Department of CSE at Baba Banda Singh Bahadur Engg. College, Fatehgarh Sahib (Punjab). His research interests are in the fields of Cloud Computing & Big Data.